FTSE 350 Real Estate Key Figures
|
FTSE 350 Real Estate Balance Sheet| %1$s Balance Sheet | | Sorry No Data Available |
|
 Share Price Performance| Share Price Performance | | Sample Period † | High | Low | | 1 week | 430.73 | 412.99 |
| 4 weeks | 433.49 | 412.99 |
| 12 weeks | 434.99 | 391.06 |
| 1 year | 437.38 | 338.11 |
Share Price Chart (5 years)| Share Price Chart (5 years) | 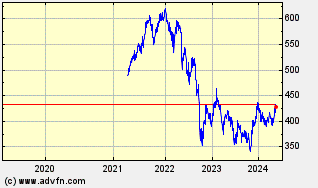 |
|
FTSE 350 Real Estate Historic Returns| %1$s Historic Returns | | Giorni da oggi † | Open | Change | % | Open Avg. | Avg. Daily Vol [m] | Total Vol [m] | VWAP | | 1 week | 430.06 | -14.40 | -3.35 | 412.99 | - | | - |
| 4 weeks | 433.29 | -17.63 | -4.07 | 412.99 | - | | - |
| 12 weeks | 412.86 | 2.80 | 0.68 | 391.06 | - | | - |
| 26 weeks | 408.30 | 7.36 | 1.80 | 384.40 | - | | - |
| 1 year | 385.45 | 30.21 | 7.84 | 338.11 | - | | - |
| 3 years | 546.34 | -130.68 | -23.92 | 338.11 | - | | - |
| 5 years | 86.76 | 328.90 | 379.09 | 86.76 | - | | - |
| † periods calculated are whole weeks rather than calendar months | |
|
FTSE 350 Real Estate Key Management Ratios
|
FTSE 350 Real Estate Investment Ratios
|
FTSE 350 Real Estate Financial Ratios
| Beta coefficients | | Beta (60-Mnth) | Beta (36-Mnth) | | Sorry No Data Available | Sorry No Data Available |
|
FTSE 350 Real Estate Operating Ratios
|
FTSE 350 Real Estate Dividends
|
|
FTSE 350 Real Estate Fundamentals |
|
|
FTSE 350 Real Estate Balance Sheet
|
FTSE 350 Real Estate Cash Flow Statement
|
FTSE 350 Real Estate Brokers| Broker infomation is not available for this class of share. |
|
| |
| |
| |
| |