false
0001334933
0001334933
2023-11-13
2023-11-13
UNITED STATES
SECURITIES AND EXCHANGE COMMISSION
Washington, D.C. 20549
FORM 8-K
CURRENT REPORT
Pursuant to Section 13 or 15(d) of the Securities Exchange Act of 1934
November 13, 2023
Date of Report (Date of earliest event reported)
URANIUM ENERGY CORP.
(Exact name of registrant as specified in its charter)
|
Nevada
|
001-33706
|
98-0399476
|
|
(State or other jurisdiction of incorporation)
|
(Commission File Number)
|
(IRS Employer Identification No.)
|
|
500 North Shoreline, Ste. 800
Corpus Christi, Texas
|
|
78401
|
|
(U.S. headquarters)
|
|
(Zip Code)
|
|
1830 – 1030 West Georgia Street
Vancouver, British Columbia, Canada
|
|
V6E 2Y3
|
|
(Canadian headquarters)
|
|
(Zip Code)
|
(Address of principal executive offices)
(361) 888-8235
Registrant’s telephone number, including area code
Not applicable.
(Former name or former address, if changed since last report)
Check the appropriate box below if the Form 8-K is intended to simultaneously satisfy the filing obligation of the registrant under any of the following provisions:
|
☐
|
Written communications pursuant to Rule 425 under the Securities Act (17 CFR 230.425)
|
|
☐
|
Soliciting material pursuant to Rule 14a-12 under the Exchange Act (17 CFR 240.14a-12)
|
|
☐
|
Pre-commencement communications pursuant to Rule 14d-2(b) under the Exchange Act (17 CFR 240.14d-2(b))
|
|
☐
|
Pre-commencement communications pursuant to Rule 13e-4(c) under the Exchange Act (17 CFR 240.13e-4(c))
|
Securities registered pursuant to Section 12(b) of the Act:
|
Title of each class
|
Trading Symbol (s)
|
Name of each exchange on which registered
|
|
Common Stock
|
UEC
|
NYSE American
|
Indicate by check mark whether the registrant is an emerging growth company as defined in as defined in Rule 405 of the Securities Act of 1933 (Section 230.405 of this chapter) or Rule 12b-2 of the Securities Exchange Act of 1934 (Section 240.12b-2 of this chapter).
Emerging growth company ☐
If an emerging growth company, indicate by check mark if the registrant has elected not to use the extended transition period for complying with any new or revised financial accounting standards provided pursuant to Section 13(a) of the Exchange Act. ☐
Uranium Energy Corp. has completed a SK-1300 Technical Report Summary entitled “Technical Report Summary – Initial Assessment: Alto Parana”, dated November 2023, for its Alto Parana Project located in Paraguay.
A copy of such Technical Report Summary is attached as Exhibit 96.1 hereto.
|
Item 9.01
|
Financial Statements and Exhibits
|
|
(a)
|
Financial Statements of Business Acquired
|
Not applicable.
|
(b)
|
Pro forma Financial Information
|
Not applicable.
|
(c)
|
Shell Company Transaction
|
Not applicable.
SIGNATURES
Pursuant to the requirements of the Securities Exchange Act of 1934, the registrant has duly caused this report to be signed on its behalf by the undersigned hereunto duly authorized.
| DATE: November 13, 2023. |
URANIUM ENERGY CORP. |
|
| |
|
|
|
| |
By: |
/s/ Pat Obara |
|
| |
|
Pat Obara, Secretary and |
|
| |
|
Chief Financial Officer |
|
Exhibit 23.1
CONSENT OF COLIN WILLIAM ROTHNIE
The undersigned hereby consents to:
| |
(i)
|
The filing of the technical report summary entitled “Technical Report Summary – Initial Assessment: Alto Paraná” dated November 2023 (the “TRS”), filed as Exhibit 96.1 to the Current Report on Form 8-K dated November 13, 2023 (the “8-K”) of Uranium Energy Corp. (the “Company”) being filed with the United States Securities and Exchange Commission;
|
| |
(ii)
|
The incorporation by reference of such TRS attached as Exhibit 96.1 to the 8-K into the Company’s Form S-3 Registration Statements (File Nos. 333-220404, 333-267992 and 333-268417), and any amendments or supplements thereto (the “S-3s”);
|
| |
(iii)
|
The incorporation by reference of such TRS attached as Exhibit 96.1 to the 8-K into the Company’s Form S-8 Registration Statements (File Nos. 333-147626, 333-162264, 333-172092, 333-192462, 333-201423, 333-213500, 333-227023, 333-233736, 333-249679, 333-262197 and 333-273321) and any amendment or supplements thereto (the “S-8s”); and
|
| |
(iv)
|
The use of my name in the S-3s and the S-8.
|
| /s/ Colin William Rothnie |
|
| Colin William Rothnie (M. AusIMM) |
|
| |
|
| Date: November 13, 2023. |
|
Exhibit 23.2
CONSENT OF TZ MINERALS INTERNATIONAL PTY LTD
The undersigned hereby consents to:
| |
(i)
|
The filing of the technical report summary entitled “Technical Report Summary – Initial Assessment: Alto Paraná” dated November 2023 (the “TRS”), filed as Exhibit 96.1 to the Current Report on Form 8-K dated November 13, 2023 (the “8-K”) of Uranium Energy Corp. (the “Company”) being filed with the United States Securities and Exchange Commission;
|
| |
(ii)
|
The incorporation by reference of such TRS attached as Exhibit 96.1 to the 8-K into the Company’s Form S-3 Registration Statements (File Nos. 333-220404, 333-267992 and 333-268417), and any amendments or supplements thereto (the “S-3s”);
|
| |
(iii)
|
The incorporation by reference of such TRS attached as Exhibit 96.1 to the 8-K into the Company’s Form S-8 Registration Statements (File Nos. 333-147626, 333-162264, 333-172092, 333-192462, 333-201423, 333-213500, 333-227023, 333-233736, 333-249679, 333-262197 and 333-273321), and any amendment or supplements thereto (the “S-8”); and
|
| |
(iv)
|
The use of our names in the S-3s and the S-8s.
|
| /s/ Gavin Diener |
|
| TZ Minerals International Pty Ltd |
|
| Per: Gavin Diener, Chief Executive Officer |
|
Exhibit 96.1
TZ Minerals International Pty Ltd
PO Box 1371, Osborne Park DC
WA 6916, Australia
Telephone: 61 8 9359 6000
Email: marketing@tzmi.com.au
Web site: www.tzmi.com
Report No. 11814/11_2023
COPYRIGHT AND DISCLAIMER
Copyright (and any other applicable intellectual property rights) in this document and any accompanying data or models which are created by TZ Minerals International Pty Ltd (TZMI) is reserved by TZMI and is protected by international copyright and other laws. Copyright in any component parts of this document such as images is owned and reserved by the copyright owner so noted within this document.
The use of this document is strictly subject to terms licensed by TZMI to the named recipient or recipients of this document or persons to whom TZMI has agreed that it may be transferred to (the Recipients). Unless otherwise agreed by TZMI, this does not grant rights to any third party. This document may not be utilized or relied upon for any purpose other than that for which it is stated within and neither TZMI nor its directors shall be liable for any loss or damage caused by such use or reliance. In the event that the Recipient of this document wishes to use the content in support of any purpose beyond or outside that which it is expressly stated or for the raising of any finance from a third party where the document is not being utilized in its full form for this purpose, the Recipient shall, prior to such use, present a draft of any report or document produced by it that may incorporate any of the content of this document to TZMI for review so that TZMI may ensure that this is presented in a manner which accurately and reasonably reflects any results or conclusions produced by TZMI.
This document shall only be distributed to any third party in full as provided by TZMI and may not be reproduced or circulated in the public domain (in whole or in part) or in any edited, abridged or otherwise amended form unless expressly agreed by TZMI. Any other copyright owner’s work may not be separated from this document, used or reproduced for any other purpose other than with this document in full as licensed by TZMI. In the event that this document is disclosed or distributed to any third party, no such third party shall be entitled to place reliance upon any information, warranties or representations which may be contained within this document and the Recipients of this document shall indemnify TZMI against all and any claims, losses and costs which may be incurred by TZMI relating to such third parties.
© TZMI Pty Ltd 2023
| |
TABLE OF CONTENTS |
Page |
| |
|
|
| 1.0 |
Executive summary |
1 |
| |
1.1 |
Project description and location |
2 |
| |
1.2 |
Geological setting and mineralization |
4 |
| |
1.3 |
Exploration |
4 |
| |
1.4 |
Development and operations |
5 |
| |
1.4 |
Mineral Resource estimates |
5 |
| |
1.6 |
Capital and operating cost estimate |
9 |
| |
1.7 |
Economic analysis |
9 |
| |
1.8 |
Environmental, permitting and social license |
10 |
| |
1.9 |
Conclusions and Recommendations |
11 |
| |
|
|
| 2.0 |
Introduction |
13 |
| |
2.1 |
Background |
13 |
| |
2.2 |
Registrant for whom the Technical Report Summary was prepared |
13 |
| |
2.3 |
Terms of reference and purpose of the report |
13 |
| |
2.4 |
Principal sources of information and data |
14 |
| |
2.5 |
Site visits and scope of personal inspection |
14 |
| |
2.6 |
Qualified Persons |
14 |
| |
2.7 |
Previously filed Technical Report Summary Reports |
14 |
| |
|
|
| 3.0 |
Property description and location |
15 |
| |
3.1 |
Project location |
15 |
| |
3.2 |
Mineral Lease |
17 |
| |
3.3 |
Mineral Rights |
22 |
| |
3.4 |
Royalties and other payments |
23 |
| |
3.5 |
Environmental liabilities |
24 |
| |
3.6 |
Mining Concessions |
24 |
| |
|
|
| 4.0 |
Accessibility, climate, local resources, infrastructure and physiography |
25 |
| |
4.1 |
Topography, elevation and vegetation |
25 |
| |
4.2 |
Accessibility |
26 |
| |
4.3 |
Climate |
26 |
| |
4.4 |
Infrastructure |
26 |
| |
|
|
|
| 5.0 |
History |
28 |
| |
5.1 |
Previous Resource Estimates |
28 |
| |
|
|
| 6.0 |
Geological setting, mineralization and deposit |
30 |
| |
6.1 |
Regional geology |
30 |
| |
6.2 |
Local geology |
35 |
| |
6.3 |
Property geology |
38 |
| |
6.4 |
Mineralisation |
39 |
| |
6.5 |
Block A mineralization |
48 |
| |
6.6 |
Block E1 mineralization |
49 |
| |
6.7 |
Block E2 mineralization |
50 |
| |
6.8 |
Deposit type - Lateritic titanium accumulation |
50 |
| 7.0 |
Exploration |
55 |
| |
7.1 |
Summary of sampling programs |
55 |
| |
7.2 |
Exploration sampling methods |
56 |
| |
7.3 |
Discussion of exploration results |
57 |
| |
7.4 |
Drilling |
59 |
| |
7.4.1 |
Block A |
59 |
| |
7.4.2 |
Block E1 & E2 Drilling 2021/22 |
61 |
| |
|
|
| 8.0 |
Sample preparation, analyses and security |
65 |
| |
8.1 |
Block A Drilling 2019 and 2020 sample preparation |
65 |
| |
8.2 |
Block A 2023 sample preparation |
65 |
| |
8.3 |
Block E1 & E2 Drilling 2021 & 2022 sample preparation |
66 |
| |
8.4 |
Sample recovery |
66 |
| |
8.5 |
Block A 2020 analyses |
67 |
| |
8.6 |
Block A 2023 analyses |
68 |
| |
8.7 |
Block E1/E2 2022 analyses |
69 |
| |
8.8 |
Discussion of laboratory methods for drill samples |
71 |
| |
8.9 |
Sample security |
72 |
| |
|
|
| 9.0 |
Data verification |
73 |
| |
9.1 |
QA/QC sampling overview |
73 |
| |
9.2 |
Twinned drillholes |
73 |
| |
9.3 |
Blind duplicate samples |
74 |
| |
9.4 |
Laboratory duplicates and standards |
76 |
| |
9.5 |
QA/QC discussion |
78 |
| |
9.6 |
Verification of data sources |
78 |
| |
9.7 |
Visual data verification: Block E1 mineralization |
79 |
| |
9.8 |
Visual data verification: Block A mineralization |
85 |
| |
9.9 |
Discussion on the adequacy of data for the purposes of estimating Resources |
93 |
| |
|
|
| 10.0 |
Mineral processing and metallurgical testing |
94 |
| |
10.1 |
Background and historical testwork |
94 |
| |
10.2 |
2022 metallurgical testing and analytical procedures |
94 |
| |
10.3 |
2022 bulk sample selection and collection |
94 |
| |
10.4 |
Metallurgical testwork laboratories |
96 |
| |
10.5 |
Metallurgical testwork results |
96 |
| |
10.6 |
Process design basis |
99 |
| |
10.7 |
Process description |
99 |
| |
10.8 |
QP opinion of the data adequacy |
100 |
| |
10.9 |
QP opinion on sample representation of mineralization |
101 |
| |
|
|
| 11.0 |
Mineral Resources estimates |
104 |
| |
11.1 |
Indicated Resources estimation, summary of key assumptions, parameters and methodology |
104 |
| |
11.2 |
Block modelling methodology |
104 |
| |
11.3 |
Bulk density |
105 |
| |
11.4 |
Block E1 mineralization variography |
114 |
| |
11.5 |
Mineralogy determination |
116 |
| |
11.6 |
Cut-off grade |
119 |
| |
11.7 |
Block E1 Block Model and Resource Estimate |
121 |
| |
11.8 |
Block A Block Model and Resource Estimate |
122 |
| |
11.9 |
Regional Resource Estimate |
124 |
| |
11.10 |
Summary of Resource estimates |
127 |
| |
11.11 |
Resource Estimates Conclusions & Recommendations |
127 |
| |
|
|
| 12.0 |
Mineral Reserves Estimates |
129 |
| |
|
|
| 13.0 |
Mining methods |
130 |
| |
13.1 |
Geotechnical analysis |
130 |
| |
13.2 |
Mining method selection |
130 |
| |
13.3 |
Base case mine design, mining method |
131 |
| |
13.4 |
Production schedule |
133 |
| |
13.5 |
Base case mining fleet, equipment and personnel |
137 |
| |
13.6 |
Tailings |
138 |
| |
|
|
| 14.0 |
Processing and recovery methods |
143 |
| |
14.1 |
Concentration |
145 |
| |
14.2 |
Mineral separation plant |
151 |
| |
14.3 |
Slagging plant |
152 |
| |
14.4 |
QP opinion of the process method selected |
157 |
| |
|
|
| 15.0 |
Infrastructure |
159 |
| |
15.1 |
Site location |
159 |
| |
15.2 |
Site access and logistics |
160 |
| |
15.3 |
Product logistics |
160 |
| |
15.4 |
Power |
164 |
| |
15.5 |
Buildings and workshops |
165 |
| |
15.6 |
Site based analytical facilities |
165 |
| |
15.7 |
Water |
165 |
| |
15.8 |
Accommodation camp |
165 |
| |
|
|
| 16.0 |
Market studies |
166 |
| |
16.1 |
Titanium feedstock market overview |
166 |
| |
16.2 |
Alto Paraná product quality review |
167 |
| |
16.3 |
Potential offtake opportunities for Alto Paraná products |
169 |
| |
16.4 |
HPPI market overview |
169 |
| |
16.5 |
Contracts |
170 |
| |
|
|
| 17.0 |
Environmental studies, permitting and social and community impact |
171 |
| |
17.1 |
Overview of ESG aspects |
171 |
| |
17.2 |
Regulatory environment |
173 |
| |
17.3 |
Next steps |
174 |
| |
17.4 |
External (Argentina or Uruguay) regulatory environment |
175 |
| |
17.5 |
Mine closure requirements |
176 |
| |
17.6 |
Environmental conclusions |
176 |
| |
17.7 |
GHG emissions |
176 |
| |
|
|
| 18.0 |
Capital and operating costs |
178 |
| |
18.1 |
Capital costs |
178 |
| |
18.2 |
Operating costs |
180 |
| |
|
|
| 19.0 |
Economic analysis |
183 |
| |
19.1 |
Introduction |
183 |
| |
19.2 |
Key economic model assumptions |
183 |
| |
19.3 |
Economic model results base case Indicated + Inferred Resources |
184 |
| |
19.4 |
Economic model results base case Indicated Resources only |
186 |
| |
19.5 |
Economic model results stretch case Indicated + Inferred Resources |
188 |
| |
19.6 |
Economic model results stretch case Indicated Resources only |
190 |
| |
|
|
| 20.0 |
Adjacent properties |
193 |
| |
|
|
| 21.0 |
Other relevant data and information |
196 |
| |
21.1 |
SWOT analysis |
196 |
| |
|
|
| 22.0 |
Interpretation and conclusions |
197 |
| |
22.1 |
Geology and Resources |
197 |
| |
22.2 |
Mining |
197 |
| |
22.3 |
Metallurgy and process |
197 |
| |
22.4 |
Economic analysis |
197 |
| |
22.5 |
GHG emissions |
197 |
| |
22.6 |
Risks |
198 |
| |
22.7 |
Opportunities |
199 |
| |
|
|
| 23.0 |
Recommendations |
201 |
| |
23.1 |
Exploration and Resource definition |
201 |
| |
23.2 |
Mining and tailings deposition |
201 |
| |
23.3 |
Processing |
202 |
| |
23.4 |
ESG |
202 |
| |
23.5 |
Infrastructure |
203 |
| |
|
|
| 24.0 |
References |
204 |
| |
24.1 |
References |
204 |
| |
24.2 |
Measurement units |
205 |
| |
24.3 |
Glossary |
206 |
| |
|
|
| 25.0 |
Reliance on information provided by the registrant |
213 |
| |
25.1 |
Introduction |
213 |
| |
25.2 |
Mineral Tenure Purpose Administering Authority |
213 |
| |
|
|
| 26.0 |
Date and signature pages |
213 |
LIST OF FIGURES
| Figure 1‑1: |
GHG emissions comparison for selected western ilmenite smelters 1 2 |
2 |
| Figure 1‑2: |
Project location |
3 |
| Figure 1‑3: |
Model for Block E1 Indicated Resource showing ilmenite grades |
6 |
| Figure 1‑4: |
Block A Indicated and Inferred Resource models showing ilmenite grade |
7 |
| Figure 1‑5: |
Regional Inferred Resource polygons showing whole rock TiO2 grades |
8 |
| Figure 3‑1: |
Project location map |
16 |
| Figure 3‑2: |
Project concession blocks location map |
17 |
| Figure 3‑3: |
Uranium Energy Corp. - Organization chart |
18 |
| Figure 3‑4: |
UEC pilot plant area |
22 |
| Figure 4‑1: |
Typical landscape at Block E1 |
25 |
| Figure 6‑1: |
Regional geology |
30 |
| Figure 6‑2: |
Intracratonic Basins in South America, showing the Paraná Basin |
31 |
| Figure 6‑3: |
Stratigraphic Column and Paraná Basin schematic cross-section |
32 |
| Figure 6‑4: |
Paleogeography at 130Ma at the time the Alto Paraná formation erupted |
33 |
| Figure 6‑5: |
Distribution of low-Ti and high-Ti basalts |
34 |
| Figure 6‑6: |
Outcrop geology along drainage channels, east of Minga Pora (CIC sampling 2009, 2010) |
35 |
| Figure 6‑7: |
Schematic weathering profile at Alto Paraná |
36 |
| Figure 6‑8: |
Top portion of the laterite profile exposed in a road cutting, Block A Alto Paraná |
36 |
| Figure 6‑9: |
Alto Paraná basalt quarry showing overlying laterite |
37 |
| Figure 6‑10: |
Road cutting at Block A showing the laterite profile |
37 |
| Figure 6‑11: |
Schematic cross-section showing geomorphological features of the mineralized laterite horizon |
38 |
| Figure 6‑12: |
Block A prospect geology |
39 |
| Figure 6‑13: |
Ilmenite concentrate from Block E2 |
40 |
| Figure 6‑14: |
Particle size distribution of the two magnetic fractions |
40 |
| Figure 6‑15: |
QEMScan image of 0.5A mags fraction (dominantly ilmenite) |
41 |
| Figure 6‑16: |
Titanomagnetite concentrate with frequent euhedral crystal forms |
42 |
| Figure 6‑17: |
SEM image of titanomagnetite-rich fraction |
43 |
| Figure 6‑18: |
Coarse titanomagnetite grain showing lamellae of titanium and iron-rich zones |
43 |
| Figure 6‑19: |
Enlargement of a small section of one titanomagnetite grain (previous image) showing element distributions (elements are labelled in the lower left corner) |
44 |
| Figure 6‑20: |
Close-up in natural light showing very weakly magnetic titanomagnetite |
45 |
| Figure 6‑21: |
Plot showing recoverable TiO2 versus whole rock TiO2 |
47 |
| Figure 6‑22: |
Drillholes on Block A showing average whole-rock TiO2 of the laterite layer |
48 |
| Figure 6‑23: |
Block E1, average laterite drill hole and pit sample TiO2 assays |
49 |
| Figure 6‑24: |
Block E2, average laterite TiO2% in drillholes and pit samples |
50 |
| Figure 6‑25: |
Mass loss in lateritic chemical weathering |
51 |
| Figure 6‑26: |
Ternary diagram for weathered mineral compositions at Alto Paraná |
52 |
| Figure 6‑27: |
Thin-section grainsize comparison of gabbro (left) and basalt (right) |
52 |
| Figure 6‑28: |
Thin section photomicrograph of partly weathered Alto Paraná gabbro-diorite |
53 |
| Figure 6‑29: |
Geological model for the Alto Paraná ilmenite mineralization |
54 |
| Figure 7‑1: |
TiO2 contours derived from 2008 - 2011 pit and drill sampling |
56 |
| Figure 7‑2: |
Auger sampling at one meter |
57 |
| Figure 7‑3: |
Mechanized auger for drilling deeper auger samples |
57 |
| Figure 7‑4: |
Shallow pit samples on Block A. Red points are >10% TiO2 in the whole-rock analyses |
58 |
| Figure 7‑5: |
2019/2020 Drilling on Block A, showing drilling rig and samples |
59 |
| Figure 7‑6: |
Drillhole plan from 2019/2020 drilling on Block A (from Haines, 2021) |
61 |
| Figure 7‑7: |
Geoprobe direct-push coring and sampling tool used in 2021/22 drilling (left) and schematic diagram showing the operation of the tool (right) |
62 |
| Figure 7‑8: |
2022 drilling: Geoprobe sampling tool being pushed down with an air-hammer (left) and the recovered sample tubes containing core (right) |
62 |
| Figure 7‑9: |
Block E1 drillhole location plan: 2022 drillholes |
63 |
| Figure 7‑10: |
2021/22 drilling on Block E2, also showing bulk sample locations BSE201, BSE202 & BSE204 |
64 |
| Figure 8‑1: |
Feed Preparation procedure in Paraguay |
65 |
| Figure 8‑2: |
2022 Drill sample recovery vs depth |
67 |
| Figure 8‑3: |
Sample preparation at ALS laboratories, 2020 drilling |
67 |
| Figure 8‑4: |
LDE Sample preparation process 2023 |
68 |
| Figure 8‑5: |
Drill sample process flowsheet at ALS Peru, 2022 |
69 |
| Figure 8‑6: |
Sample preparation process at IHC |
70 |
| Figure 8‑7: |
Stage 2 of IHC drill sample processing |
71 |
| Figure 9‑1: |
Scatter plot showing comparison of whole-rock TiO2 grades of redrilled Block E1 samples |
74 |
| Figure 9‑2: |
Scatter plot of blind duplicate results for the -45µm ‘slimes’ fraction |
74 |
| Figure 9‑3: |
Scatter plot showing +1mm ‘oversize’ results for blind duplicates |
75 |
| Figure 9‑4: |
Scatter plot showing HM grades of blind duplicate samples |
76 |
| Figure 9‑5: |
-45µm slimes analyses for IHC internal laboratory repeats |
77 |
| Figure 9‑6: |
-+1mm oversize analyses for IHC internal laboratory repeats |
77 |
| Figure 9‑7: |
Heavy mineral grade for IHC internal laboratory repeats |
78 |
| Figure 9‑8: |
Comparison of average values of whole rock TiO2 and heavy mineral (HM) with minimum and maximum values from individual samples within the same intervals, northern-most drill traverse on E1 |
80 |
| Figure 9‑9: |
Plan view of E1 drillholes and Resource, showing the local grid section lines 28400N, 28000N and 27600N used for visual verification |
81 |
| Figure 9‑10: |
Block E1 Local grid 27600N: visual verification of key drilling data: elevation, thickness and grade values |
82 |
| Figure 9‑11: |
Block E1 Local grid 28000N visual verification of key drilling data |
83 |
| Figure 9‑12: |
Block E1 Local Grid 28400N visual verification of key drilling data |
84 |
| Figure 9‑13: |
Block A drillholes and Indicated Resource boundary, showing the N-S section lines used for visual data verification 707400E – 710100E |
86 |
| Figure 9‑14: |
Block A Section 707400E visual verification of key drilling data (looking west) |
87 |
| Figure 9‑15: |
Block A Section 707800E visual verification of key drilling data (looking west) |
88 |
| Figure 9‑16: |
Block A Section 708600E visual verification of key drilling data |
89 |
| Figure 9‑17: |
Block A Section 709400E visual verification of key drilling data |
90 |
| Figure 9‑18: |
Block A Section 710100E visual verification of key drilling data |
91 |
| Figure 10‑1: |
UEC exploration permit areas and a zoom-in of the Block E2 bulk sample locations |
95 |
| Figure 10‑2: |
Geochemistry trends showing Al2O3 vs TiO2 of bulk sample products and HM from regional drill samples |
102 |
| Figure 10‑3: |
MgO content of bulk sample products versus regional samples |
103 |
| Figure 11‑1: |
Block modelling steps to remove the effect of topography on the block model |
104 |
| Figure 11‑2: |
Tree roots (left) and a road cutting (right) at Alto Paraná |
106 |
| Figure 11‑3: |
Bulk density determination by pit excavation (2011) |
107 |
| Figure 11‑4: |
Large diameter auger drilling bulk density test |
110 |
| Figure 11‑5: |
Corn grain being poured into one auger hole to measure volume. The lifting scale used to measure the weight of extracted material and replacement corn is visible on the loader |
110 |
| Figure 11‑6: |
Pit excavations for 2023 bulk density tests and samples taken for analyzing moisture |
111 |
| Figure 11‑7: |
LIDAR scanning of pits and a cut-away example of the resulting LIDAR point cloud data |
111 |
| Figure 11‑8: |
Examples of the 3D models made from the LIDAR scans of the excavations (from left APBD001, APBD002 and APBD003, all on Block A near the pilot plant) |
111 |
| Figure 11‑9: |
Scatter plot showing dry bulk density of LIDAR excavation laterite samples by depth |
113 |
| Figure 11‑10: |
Semi-variograms (vertical and horizontal) for HM at Block E1 mineralization |
115 |
| Figure 11‑11: |
Comparison of ilmenite grades with ilmenite grade estimated from whole rock TiO2 |
119 |
| Figure 11‑12: |
Estimated ilmenite grades for Block E1 Resource (block model and drillhole values) |
122 |
| Figure 11‑13: |
Ilmenite grade. Inferred Resource ilmenite grade is calculated using whole rock TiO2 |
124 |
| Figure 11‑14: |
Regional Inferred Resource polygons, colored by whole rock TiO2 |
125 |
| Figure 11‑15: |
Comparison of measured ilmenite grade compared to whole rock TiO2 grade for 63 drillholes away from the Indicated Resources |
126 |
| Figure 13‑1: |
Proposed mining path at Block A Indicated Resource |
134 |
| Figure 13‑2: |
Final mining area outline at Block A |
134 |
| Figure 13‑3: |
Proposed hydraulic mining paths at Block E1 |
135 |
| Figure 13‑4: |
Final mining area outline at Block E1 |
135 |
| Figure 13‑5: |
Production profile and HM grade |
137 |
| Figure 13‑6: |
Consolidating tailings showing bleed water |
139 |
| Figure 13‑7: |
Solar drying/shrinkage testing on site showing three months of drying |
140 |
| Figure 13‑8: |
2012 silt/clay tailings drying cell and detail of a clay ‘pillar‘ indicating sample location |
140 |
| Figure 13‑9: |
Solar dried pilot plant silt/clay tailings |
141 |
| Figure 14‑1: |
Alto Paraná Titanium Project flow diagram |
144 |
| Figure 14‑2: |
Feed preparation plant and wet concentration plant process flow diagram |
146 |
| Figure 14‑3: |
Feed preparation plant |
147 |
| Figure 14‑4: |
Wet concentration plant |
148 |
| Figure 14‑5: |
Alto Paraná Project water cycle |
150 |
| Figure 14‑6: |
Mineral separation plant schematic |
151 |
| Figure 14‑7: |
Slagging plant process flow diagram |
153 |
| Figure 14‑8: |
Furnace process flow diagram |
154 |
| Figure 14‑9: |
Slag plant process flow diagram |
156 |
| Figure 14‑10: |
Iron treatment process flow diagram |
157 |
| Figure 15‑1: |
Site locations with roads and powerlines shown |
159 |
| Figure 15‑2: |
Supercarretera Itaipu between Hernandarias and Minga Pora |
160 |
| Figure 15‑3: |
Barge and container unloading on the Paraguay River |
163 |
| Figure 15‑4: |
Barge loading port on the Paraná River |
164 |
| Figure 16‑1: |
Demand by individual feedstock for the TiO2 pigment end-use |
166 |
| Figure 16‑2: |
Historical and forecast HPPI price |
170 |
| Figure 17‑1: |
GHG emissions comparison for selected western smelters |
177 |
| Figure 18‑1: |
Pig Iron loading into barges |
182 |
| Figure 18‑2: |
Barge transport of loose bulk materials |
182 |
| Figure 19‑1: |
Profile of forecast annual cashflow base case Indicated + Inferred Resources |
185 |
| Figure 19‑2: |
Post tax NPV8 sensitivity tornado diagram base case Indicated + Inferred Resources |
185 |
| Figure 19‑3: |
Post-tax IRR sensitivity plot base case Indicated + Inferred Resources |
186 |
| Figure 19‑4: |
Profile of forecast annual cashflow base case Indicated Resources only |
187 |
| Figure 19‑5: |
Post tax NPV8 sensitivity tornado diagram base case Indicated Resources only |
187 |
| Figure 19‑6: |
Post-tax IRR sensitivity plot base case Indicated Resources only |
188 |
| Figure 19‑7: |
Profile of forecast annual cashflow stretch case Indicated + Inferred Resources |
189 |
| Figure 19‑8: |
Post tax NPV8 sensitivity tornado diagram stretch case Indicated + Inferred Resources |
189 |
| Figure 19‑9: |
Post-tax IRR sensitivity plot stretch case Indicated + Inferred |
190 |
| Figure 19‑10: |
Profile of forecast annual cashflow stretch case Indicated Resources only |
191 |
| Figure 19‑11: |
Post tax NPV8 sensitivity tornado diagram stretch case Indicated Resources only |
191 |
| Figure 19‑12: |
Post-tax IRR sensitivity plot stretch case Indicated Resources only |
192 |
| Figure 20‑1: |
Prospecting and exploration permits Alto Paraná District, Paraguay |
194 |
| Figure 20‑2: |
Active quarries in the MYNM Exploration Permit areas |
195 |
LIST OF TABLES
| Table 1‑1: |
2023 Estimate of Inferred Resource on currently held mineral leases |
7 |
| Table 1‑2: |
2022 Resource estimations |
8 |
| Table 1‑3: |
Economic results |
10 |
| Table 1‑4: |
Forward Works Cost Estimate |
12 |
| Table 3‑1: |
Exploration permits and tenure details |
20 |
| Table 5‑1: |
Historical Resource estimations for the currently held leases (using 6% whole rock TiO2 cut-off) |
28 |
| Table 6‑1: |
Alto Paraná ‘pure’ ilmenite mineral, analyses of major and minor elements |
42 |
| Table 6‑2: |
Alto Paraná Titanomagnetite analysis |
45 |
| Table 6‑3: |
Alto Paraná laterite whole rock analysis |
46 |
| Table 7‑1: |
Early exploration sampling at Alto Paraná |
55 |
| Table 7‑2: |
Drillhole Details for 2019 and 2020 drilling on Block A |
60 |
| Table 9‑1: |
Block E1 Redrill comparison between 2010 results and 2021/22 results |
73 |
| Table 9‑2: |
Comparison of key drilling results for two adjacent drillholes: PH612 (from 2012) and AP027 (drilled 2019, analyzed in 2022) |
92 |
| Table 10‑1: |
2022 bulk samples dispatched to LDE |
96 |
| Table 10‑2: |
UE22-11 Products and smelter feed blend |
98 |
| Table 11‑1: |
Bulk Density and Specific Gravity |
105 |
| Table 11‑2: |
Dry bulk density samples |
106 |
| Table 11‑3: |
Dry bulk density samples |
107 |
| Table 11‑4: |
Bulk density and moisture percentages derived from 2011 pit excavation at the pilot plant site |
108 |
| Table 11‑5: |
Auger drill testing of bulk density: Location and volume calculations |
109 |
| Table 11‑6: |
Auger drill testing of bulk density: Weights and density results |
109 |
| Table 11‑7: |
Overall totals from the 2023 LIDAR excavations |
112 |
| Table 11‑8: |
Total of excavated laterite only material by depth |
112 |
| Table 11‑9: |
QEMScan mineralogy of Tronox 2014 processing products |
116 |
| Table 11‑10: |
Chemistry of Tronox's 2014 processing products |
116 |
| Table 11‑11: |
Mineral compositions from Tronox 2014 testwork (Block A sample material) |
117 |
| Table 11‑12: |
Summary QEMScan mineralogy of major UE23-02 products |
117 |
| Table 11‑13: |
Chemistry of the UE23-02 products |
118 |
| Table 11‑14: |
End-member mineral compositions derived from UE23-02 testwork |
118 |
| Table 11‑15: |
Unit costs used for the cut-off grade determination |
120 |
| Table 11‑16: |
Product revenues used for cut-off grade determination |
120 |
| Table 11‑17: |
Block modelling parameters for the Resource model for Block E1 |
121 |
| Table 11‑18: |
Block E1 Indicated Resource estimate |
122 |
| Table 11‑19: |
Block modelling parameters for the Block A Resource model |
123 |
| Table 11‑20: |
Block A Indicated Resource estimation |
123 |
| Table 11‑21: |
2023 Estimate of Inferred Resource on currently held mineral leases |
126 |
| Table 11‑22: |
Compilation of Resource estimations |
127 |
| Table 13‑1: |
Block A production schedule |
136 |
| Table 13‑2: |
Block E1 production schedule |
136 |
| Table 13‑3: |
Base case mining fleet |
138 |
| Table 13‑4: |
Base case estimated mining labor requirement |
138 |
| Table 14‑1: |
Concentrator process design criteria Block E1 |
145 |
| Table 14‑2: |
MSP process design criteria |
151 |
| Table 14‑3: |
Slagging plant process design criteria |
152 |
| Table 14‑4: |
Predicted smelter product chemistry |
155 |
| Table 15‑1: |
Road transport cycle times (base case) |
161 |
| Table 15‑2: |
Road transport cycle times (base case) |
161 |
| Table 15‑3: |
Road transport fleet size (base case) |
162 |
| Table 16‑1: |
Alto Paraná slag as chloride slag |
168 |
| Table 17‑1: |
Preliminary high-level ESIA schedule. |
174 |
| Table 17‑2: |
Government stakeholders (preliminary) |
175 |
| Table 17‑3: |
Non-Government stakeholders (preliminary) |
175 |
| Table 18‑1: |
Total project capital cost summary |
178 |
| Table 18‑2: |
Base case operating cost plus sustaining capital summary |
180 |
| Table 18‑3: |
Stretch case operating cost plus sustaining capital summary |
181 |
| Table 19‑1: |
Key economic model assumptions |
184 |
| Table 19‑2: |
Economic measures base case Indicated + Inferred Resources |
184 |
| Table 19‑3: |
Economic measures base case Indicated Resources only |
186 |
| Table 19‑4: |
Economic measures stretch case Indicated + Inferred |
188 |
| Table 19‑5: |
Economic measures stretch case Indicated only |
190 |
| Table 20‑1: |
MYNM exploration permits - August 2023 |
193 |
| Table 20‑2: |
MYNM permits for resolution - July 2023 |
193 |
| Table 20‑3: |
Adjacent exploration permits |
193 |
| Table 21‑1: |
Project SWOT analysis |
196 |
| Table 23‑1: |
Estimated costs associated with recommendations |
201 |
This technical report summary (TRS) was prepared in accordance with the U.S. Securities and Exchange Commission Regulation S-K Subpart 1300 (S-K 1300) for Uranium Energy Corp. (UEC or the Company) by TZ Minerals International Pty Ltd (TZMI) on the Alto Paraná Titanium Project (the Project).
The Project is located in the Republic of Paraguay, South America, which contains Resource of 3.6 billion tonnes at 7.3% TiO2, measured on a whole rock basis, with an average thickness of 6.3 meters. The Project is located adjacent to a large renewable power source and close to well-established logistics and other infrastructure. The combination of favorable aspects of mineralization, low-cost renewable power and efficient logistics give rise to a potential project that will produce titanium feedstock and high-quality pig iron with a projected carbon intensity of less than 0.6t CO2e/tonne of final product when considering Scope 1 and 2 emissions. The Project utilizes less than 4.2% of the regional Resource for the base case presenting scalability and consists of a proposed open pit hydraulic mining operation, with beneficiation of the mined material to produce ilmenite for use as a smelter feed. The ilmenite from the concentrator is smelted in an electric arc furnace to produce chloride slag, chloride fines and a high-quality pig iron product. The slag is planned to be sold as a feedstock for the production of titanium dioxide pigment. The pig iron would be sold to the iron and steel industry as a source of high-quality iron units for the production of steel or to the foundry industry for the production of high-quality ductile iron castings. The proposed Project concept has an initial design capacity of approximately 150,000 tonnes per annum (tpa) of high titania slag and 100,000 tonnes per annum pig iron based on a single furnace plant as a base case. Given the large Resource, a further stretch case sensitivity has been developed with a design capacity of 500,000 tonnes per annum of high titania slag and 320,000 tonnes per annum of high purity pig iron (HPPI), based on two mining and concentrator operations and multiple furnaces.
Within the pigment market, the demand for chloride slag, the primary product of the Alto Paraná operation, is expected to outpace the overall market with a compound annual growth rate (CAGR) of 7.7% in TiO₂ pigment end-use markets from 2022 and 2030. This is due to constraints in natural rutile supply, a significant source of high-grade feedstock, combined with the growth in Chinese chloride pigment and titanium sponge output, for which chloride slag is the main feedstock of choice.
The slag and HPPI planned to be produced from the Project are expected to have lower greenhouse gas emissions per tonne of final products compared to the ilmenite smelting operations considered in this study. The benefits of hydroelectric power, hydraulic mining and electric drying are the main reasons the greenhouse gas emissions per tonne of product is so low compared to other smelters considered in the study.
Figure 1‑1: GHG emissions comparison for selected western ilmenite smelters 1 2
1 The TZMI industry GHG curve that is used in the comparison has been produced as part of the annual Feedstock Cost Study Report published by TZMI. The Feedstock Cost Study reviews the costs, revenue, production and Scope 1, Scope 2 and limited Scope 3 (feedstock transport only) GHG emissions data for producers across the titanium feedstock sector with 36 operations included in the 2022 study.
2 Based on - Greenhouse Gas Protocol “Technical Guidance for Calculating Scope 3 Emissions (Version1)” for transport of ilmenite
Based on the work carried out in this TRS, and the resultant economic evaluation, a positive business case has been identified for the development of operations with a post-tax net present value (NPV) of US$419 million and an IRR of 21% for the base case. The stretch case presents a post-tax NPV of US$1,554 million and an IRR of 25%.
The economic results of this TRS indicate a robust project based on the assumptions of this report. Given the size of the Alto Paraná Resource, and therefore the opportunity to extend the life of mine, additional returns and/or the possibility of future expansions may be investigated.
The reader is cautioned that the economic results summarized here are preliminary in nature and include Inferred Mineral Resources that are considered too speculative geologically to have modifying factors applied to them that would enable them to be categorized as Mineral Reserves, and there is no certainty that the results of this economic assessment will be realized.
|
1.1
|
Project description and location
|
The Alto Paraná Project is located in eastern Paraguay in the departments of Alto Paraná and Canindeyú. The center of the property is located approximately 100 kilometers (km) northwest of Ciudad del Este. The 2022 exploration drilling and bulk sampling for testwork programs focused on proving up the ilmenite Resource at Block E1 and E2 on the western edge of the lease area. The current study work has included mining and concentration of ilmenite followed by smelting ilmenite into marketable high titania slag and HPPI products in the Hernandarias Industrial area. This site has been chosen due to the close proximity to the Itaipu hydroelectric power station. Smelting the ilmenite produces products with a significantly higher value than the Alto Paraná ilmenite taking advantage of the large Resource and low-cost power available in Alto Paraná.
Therefore, while parts of this TRS report focus on the ilmenite mineralization, equal attention is paid to the assessment of upgrading the product through smelting. Together, the Resource and the smelter form a single integral project. For these reasons, this study includes more details on processing, smelting and economic modelling than might typically be found in a standard initial assessment.
Two processing and smelting options have been proposed to investigate the effect of increasing the scale of the Project. The base case has been developed to investigate the design production rate of 150,000 tonnes of slag and 100,000 tonnes of HPPI per year. In the base case, the mining will begin in Block A before relocation of the mining operation and concentration plant to the western side of Block E1 at the at the beginning of year 18, where mining will continue.
Additional property is required for the mineral separation plant and the slagging plant which will convert the ilmenite into slag and pig iron. This facility is proposed to be located 15km northwest of Hernandarias and 25km northwest of Ciudad del Este. This location is close to existing high voltage powerlines and major transport corridors while having separation from populated areas.
As the base case utilizes a very small proportion of the Mineral Resource, a stretch production case has been developed to investigate the effect of increasing the design production rate to 500,000 tonnes of slag and 320,000 tonnes of HPPI per year on project economics by revising the mine production schedule and updating the previously proposed process flowsheet and cost estimates. The intention of the stretch case is to demonstrate the benefits of economy of scale on the upside potential of the Project for a stretched production output.
Figure 1‑2: Project location
|
1.2
|
Geological setting and mineralization
|
UEC’s Alto Paraná project is located at the southern end of the Paraná Basin, the largest intra-cratonic basin in South America. The basement geology and original source of the titanium mineralization is the Alto Paraná Formation, a thick sequence of mostly tholeiitic basalt and mafic intrusions deposited throughout the basin in the Early Cretaceous.
Across the region lateritic weathering has removed much of the original rock volume, leaching out most of the original chemical elements and leaving behind the least soluble: titanium, aluminum, iron and to a lesser extent silicon. These are present in the lateritic weathering profile as ilmenite and titanomagnetite grains, the insoluble remnants from the original rocks, and red/brown iron-stained kaolinite, the weathering products of all the other minerals. Quartz, goethite, silica- and iron-concretions are also present in the laterite in very minor quantities.
Ilmenite accumulations within the laterite are the target of the current study. The weathering process has not only concentrated ilmenite by removing the original surrounding silicate minerals, but has also made extracting the mineral easier by replacing the original hard silicates with silt and clay. The original exploration work relied on whole rock TiO2 assays to determine grade, however most of the TiO2 is not in a useful form. The current and future assessment will use the defined classification of ilmenite as the valuable component of the resource.
The weathered laterite horizon is generally found as a 5-10 meter thick ‘blanket’ layer overlying the undulating, fresh and weathered rock surface. Consistency in the composition of the original intrusions and the subsequent weathering process has led to very uniform mineralization within the laterites, with the ilmenite grades closely linked to the underlying source rock. Economic grades are generally found over mafic intrusions with coarser grainsize than the more prevalent, very fine grained, basaltic basement.
CIC Resources (Paraguay) Inc. began systematic exploration for titanium in Alto Paraná in 2009, with widely spaced, up to 4km apart, shallow and deep pit sampling completed to delineate the limits of TiO2 anomalies and test for high grade zones. Shallow pit samples were collected at a depth of one meter and deep pit samples were collected over each meter interval from the surface to the laterite/saprolite interface.
Early sampling was successful in defining wide areas of anomalous and high-grade whole rock TiO2. Subsequent exploration in 2012 and 2013 concentrated on the areas closest to the pilot plant and in the years since 2013 work has focused on drilling rather than auger and pit sampling. The new work recognizes that only sand-sized ilmenite mineral has useful value in contemporary industrial use. To date approximately one third of the whole rock TiO2 has been shown to be contained in this ilmenite fraction.
Drilling
In 2019/2020 a diamond drilling rig was used to drill systematically over part of the Block A mineralization. The Longyear 38 drilling rig was equipped with HQ drill rods and used a split tube system to take good quality samples with high rates of recovery. The program comprised 49 drillholes with target depths of 10 meters, for a total of 460 meters drilled.
In 2021 and 2022, drilling was conducted on Blocks E1 and E2 with direct push sampling equipment and using a local drilling contractor with a water drilling rig. While sample recovery was not as high as with the diamond drilling rig, the drilling process was much faster and caused less damage to crops. A total of 30 drillholes were completed on Block E1 for a total of 228 meters and 12 drillholes were completed on Block E2 for a total of 56 meters.
The following assays and sample information have been derived from various laboratory analyses of the drill samples:
|
●
|
Whole rock TiO2 from XRF analyses of the ‘run of mine’ mineralization.
|
|
●
|
Heavy minerals (HM, particles between 45um and 1mm with SG > 2.8), slimes (-45µm) and oversize (+1mm). These assays are traditionally used when evaluating heavy mineral deposits and most common types of titanium mineralization.
|
|
●
|
Magnetic fractionation of the HM into three magnetic fractions.
|
|
●
|
Ilmenite and titanomagnetite grades are then derived from XRF analyses of the magnetically separated, heavy mineral fraction of the mineralization. Ilmenite is predominantly found in the weakly magnetic ‘Mag2’ fraction.
|
|
1.4
|
Development and operations
|
With the exception of a number of small artisanal basalt quarries, the Alto Paraná region is not a historical mining area. Prior work on the Project has resulted in the development of processing technology enabling the successful recovery of the heavy mineral components utilizing known and proven unit processes. This work included design, construction and operation of a 1.5tph pilot plant in Paraguay where the pilot plant produced approximately 108 tonnes of concentrate over a three-month period in 2011. In 2012 electric arc smelting tests conducted on this concentrate demonstrated the feasibility of producing a high titania slag and a pig iron product. This work is described in detail in the Alto Paraná 2012 preliminary economic assessment (PEA) (Haines, 2012).
In 2022 new bulk samples were extracted from the Block E2 area for the purposes of testing alternative flowsheets to liberate the magnetic minerals from the clay matrix. The new testing conducted at Alto Paraná in 2022, and subsequently confirmed at LightDeepEarth (Pty) Ltd (LDE)’s laboratory in South Africa, has shown that a two-stage rotary scrubbing process utilizing rock media is a viable method to efficiently liberate the target minerals from the Alto Paraná host clay. Standard mineral sand processing operations of desliming to remove the -45µm slimes followed by gravity separation, drying and magnetic separation has been used to produce the products that can be blended to make the smelter feed.
|
1.5
|
Mineral Resource estimates
|
The smelter feed is predominantly ilmenite (87%) and so the ilmenite grade from drill samples is used to determine the potential value of mineralization. Ilmenite grade is determined by separating the heavy mineral fraction (HM) from the mineralization, magnetically separating it into three fractions and then chemically analyzing the magnetic fractions. Ilmenite is predominantly found in the weakly magnetic ‘Mag2’ fraction along with varying quantities of titanomagnetite. The proportion of ilmenite present is determined using the TiO2 analysis of this fraction.
The economic cut-off grade is calculated at 0.9% ilmenite measured in the Resource. Under the S-K 1300 definition, the cut-off grade is based entirely on whether the material has economic value if delivered to the processing facility. However, practical considerations show that purchasing ilmenite on the open market and delivering it to the smelter location would be cheaper, in theory if such a supply was available, than mining and processing local mineralization with less than 1.6% ilmenite grade. Therefore, a 1.6% ilmenite grade, measured in the Resource and generally rounded up to 2%, is used as the effective cut-off.
Laboratory processes currently used to analyze drill samples at the Project provide direct measurements of ilmenite grade, and these results have been used to define Indicated zones of the Resources where recent drilling has occurred. To date, the new methods have only been applied to a small fraction of the regional mineralization within the Project area. For the remaining Project area, whole rock TiO2 analyses are used as an indication of potential ilmenite mineralization. While there is a moderate correlation between whole rock TiO2 grade and ilmenite grade, the whole rock TiO2 results are only suitable for defining Resources at an Inferred level.
Regular drilling and detailed sample analyses in parts of both Blocks E1 and A have allowed the estimation of Indicated Resource zones. Resources have been modelled as block models, using the laterite/saprolite boundary as a constant datum. Drilling has been completed on roughly 400 meter spaced drillholes and the block models use 100 meter x 100 meter x 0.5 meter blocks. Semi-variograms were used to set the inverse distance search parameters and sample weighting to a flat circular ellipsoid of 1,100 meter horizontal radius and 40 meter vertical radius. The resulting models match the original drill data very well, although this is expected given the relatively smooth grade through the Resources. Drill spacings and block model cell sizes are larger than those typically found in ilmenite and heavy mineral Resources of Indicated category elsewhere. However, the style of mineralization at Alto Paraná has resulted in mineral grades with much less spatial variability than found in other styles. 400 meter spaced drilling is sufficient to demonstrate grade continuity, provide reliable estimates of the global average grade of the Resources, as well as providing reasonable estimates of local grades for conceptual mine planning or scoping work.
Bulk density sampling conducted in 2023 showed that the Project mineralization averages 1.2 tonne/m3 dry bulk density, and this factor has been applied to all Resource models.
Thirty drillholes were completed on Block E1 in 2021/2022 at approximately 400 meter spacings across a mineralized section of laterite approximately 3.3km long (east-west) and 1.4km wide. Ilmenite grades for these drillholes are shown in Figure 1‑3, along with the resulting E1 Resource model. Mineralization is open to the southwest, to the east, and the north. Further drilling in these areas is planned.
Figure 1‑3: Model for Block E1 Indicated Resource showing ilmenite grades
In 2019 and 2020 samples from 47 drillholes from Block A were re-analyzed using the most recent laboratory techniques. Ilmenite grades from these holes were combined with earlier estimates from 2012 Tronox analyses of other drillholes to provide approximately 400 meter spaced drilling coverage of two adjacent zones of mineralized laterite. The drillhole grades and Resource model grades are shown on in Figure 1‑4.
For Block A, Inferred Resource zones have been defined adjacent to the Indicated Resource to provide smelter feed in later years of the base case production schedule. To date there are no ilmenite grade measurements in these zones, so the ilmenite grade is estimated using the whole rock TiO2 grade. The estimated ilmenite grades for both the Indicated and Inferred Resources on Block A are shown below in Figure 1‑4. Drillhole ilmenite grades indirectly estimated using whole rock TiO2 are shown faded and with italics font.
Figure 1‑4: Block A Indicated and Inferred Resource models showing ilmenite grade
For the regional Resource estimation, drillhole intervals that intersected laterite from all leases were composited to give thickness and average whole rock TiO2 grades. Voronoi polygons constructed around the drillholes were trimmed with the lease areas, bosque areas using updated 2022 satellite imagery, townsite areas and highway land. Other Indicated and Inferred Resources on Block E1 and Block A, as described above, were also excluded and remnant polygons with very small areas deleted. The resulting polygons are shown on Figure 1‑5.
An assay of 5.75% whole rock TiO2 is used as the low-grade cut-off for determining the regional Inferred Resource, approximately equal to 2% ilmenite. In the map below, polygons below the cut-off are colored green and blue, while those above are colored yellow, orange and red. It is possible that zones of the regional Inferred Resource, yet to be tested using the new ilmenite-based sample processing methods, will not contain the expected levels of ilmenite. Work is ongoing to obtain and analyze samples from all areas to address this uncertainty.
Table 1‑1: 2023 Estimate of Inferred Resource on currently held mineral leases
|
Zone (Model)
|
Resource
Category
|
|
Vol
(m3 x 106)
|
|
|
Tonnes
(106)
|
|
|
Whole
Rock TiO2
|
|
|
Average Thickness
(meters)
|
|
|
2023 Estimate MYNM Leases (5.75% TiO2 Cut-off grade)
|
Inferred
|
|
2,900 |
|
|
3,500 |
|
|
7.3% |
|
|
6.3 |
|
Table 1‑2 contains a compilation of the Resource estimations for this Project.
Figure 1‑5: Regional Inferred Resource polygons showing whole rock TiO2 grades
Table 1‑2: 2022 Resource estimations
|
Zone (Model)
|
Resource
category
|
|
Volume
(Mm3)
|
|
|
Tonnes (Mt)
|
|
|
Ilmenite1,2
|
|
|
Whole rock TiO2
|
|
|
MYNM Regional3,4
|
Inferred
|
|
2,900 |
|
|
3,500 |
|
|
|
|
|
7.3% |
|
|
Block E1 (E1E)
|
Indicated
|
|
28 |
|
|
34 |
|
|
4.9% |
|
|
7.5% |
|
|
Block A (A5C)
|
Indicated
|
|
30 |
|
|
36 |
|
|
4.8% |
|
|
7.7% |
|
|
Block A (A5C)4
|
Inferred
|
|
67 |
|
|
80 |
|
|
|
|
|
7.7% |
|
|
TOTAL3
|
|
3,000 |
|
|
3,600 |
|
|
|
|
|
7.3% |
|
Notes:
| |
1.
|
Ilmenite: ‘heavy mineral’ particles between 45µm and 1mm, denser than 2.8g/cm3 containing an average of 50% TiO2
|
| |
2.
|
All grades are expressed as in situ grades.
|
| |
3.
|
Estimates for the MYNM Regional Resource and the Total are rounded to two significant figures, as appropriate for Inferred Resources.
|
| |
4.
|
On the basis of sampling and comparison assays done to date it is estimated the Inferred Resources contain between 4 and 5% ilmenite.
|
| |
5.
|
A cut-off grade of 2% ilmenite has been applied where the ilmenite grade is known, otherwise whole rock TiO₂ of 5.75%
|
|
1.6
|
Capital and operating cost estimate
|
This section contains forward-looking information related to capital and operating cost estimates for the Project. The material factors that could cause actual results to differ materially from the conclusions, estimates, designs, forecasts or projections in the forward-looking information include any significant differences from one or more of the material factors or assumptions that were set forth in this section including prevailing economic conditions continue such that projected capital costs, labor and equipment productivity levels and that contingency is sufficient to account for changes in material factors or assumptions.
As the Project has the potential to be developed into a large Resource, two scenarios have been developed to support two economic analysis cases of different scales. The capital and operating cost estimate incorporates the mine production schedule, process flowsheet and mass balance information generated following the testwork program completed in 2022 and 2023. All costs are in United States dollars with a base date of mid-2022.
The total capital costs for the base case producing 150,000tpa of slag is approximately US$340 million. The total capital costs for the for the stretch case producing 500,000tpa of slag is approximately US$920 million including the direct costs of owner operated hydraulic mining, equipment purchase, transport and installation as well as the indirect costs associated with the design, procurement, construction support facilities and a 25% contingency.
The estimated operating costs for the mine, concentration plants, smelter and product transport for the Project were developed after taking account of previous studies, labor numbers and current labor rates, UEC and in-country specialists provided rates; Administración Nacional de Electricidad (ANDE) hydroelectric power rate of US$ 0.041/kWh plus 10% value added tax (VAT) and preliminary in-country vendor enquiries.
The average life-of-mine operating costs, plus sustaining capital, for the base case is US$99 million per year, equivalent to US$16.50 per tonne of material mined, and to US$712 per tonne slag produced. The life of mine averages for the base case are calculated on 23 years for mining and concentration and 24 years for the slagging plant operation.
The average life-of-mine operating costs, plus sustaining capital, for the stretch case is US$308 million per year, equivalent to US$14.30 per tonne of material mined, and to US$681 per tonne slag produced. The life of mine averages for the stretch case are calculated on 22 years for mining and concentration and 23 years for the slagging plant operation.
This section contains forward-looking information related to economic analysis for the Project. The material factors that could cause actual results to differ materially from the conclusions, estimates, designs, forecasts or projections in the forward-looking information include any significant differences from one or more of the material factors or assumptions that were set forth in this sub-section including estimated capital and operating costs, Project schedule and approvals timing, availability of funding, projected commodities markets and prices.
The two economic evaluations were prepared using the standard discounted cashflow methodology (DCF). All costs are in United States dollars with a base date of mid-2022.
The annual production profiles derived for the study are based on the mine plans and the physical assumptions as outlined in the body of this report. Total production over the modelled life of mine for the base case is 3.1 million tonnes of slag and 2.1 million tonnes of pig iron. Total production for the stretch case is 10.3 million tonnes of slag and 6.6 million tonnes of pig iron. Smelter relines have been set to occur every five years. The key economic metrics for the Project are presented in Table 1‑3.
Table 1‑3: Economic results
|
Measure
|
Units
|
Base case
150,000tpa slag
|
Stretch case
500,000tpa slag
|
|
Initial capital cost
|
US$ million
|
338 |
|
918 |
|
|
Annual operating cost*
|
US$ million
|
99 |
|
308 |
|
|
Annual revenue
|
US$ million
|
200 |
|
652 |
|
|
Post-tax NPV
|
US$ million
|
419 |
|
1,554 |
|
|
Post-tax IRR
|
%
|
21 |
|
25 |
|
|
R/C ratio **
|
2.2 |
|
2.3 |
|
|
Payback
|
Years
|
4.7 |
|
4.2 |
|
* Includes sustaining capital costs
** Revenue/(Operating Expenses + Royalties)
The economic results of this study indicate a robust project using the assumptions of this report. Given the size of the Alto Paraná Resource, and therefore the likelihood of extending the life of the mine, additional returns and/or the possibility of future expansions may be investigated.
For all cases the Project post-tax NPV is most sensitive to changes in the slag price and operating costs and the IRR is most sensitive to changes in the slag price and capital expenditure. Refer to Section 19.0 for the sensitivity charts.
|
1.8
|
Environmental, permitting and social license
|
National environmental and social aspects
Within Paraguay, a high-level overview of the relevant national environmental permitting requirements has identified a list of stakeholders for the principal components of the Project.
The strategy for obtaining the relevant environmental and social permits to operate includes:
|
●
|
Developing baseline data for each area affected by the Project;
|
|
●
|
Developing public outreach plans;
|
|
●
|
Preparing Life of Mine plans, including land restoration and rehabilitation standards;
|
|
●
|
Preparing Environmental and Social Impact Assessments (ESIA) incorporating all of the above.
|
A hierarchical approach will be applied to ESIA development:
|
●
|
Paraguayan regulations and guidelines to be applied, where they exist;
|
|
●
|
Any gaps will be covered by international standards or international best practice.
|
Next steps
The following steps have been identified for the next phase of the Project:
|
●
|
Open dialogue with Paraguayan Regulators [Ministry of the Environment and Sustainable Development (MADES) is the lead agency] should continue;
|
|
●
|
Permitting requirements and their relation to ESIA approval should be defined and accounted for in the schedule;
|
|
●
|
Develop a Community Engagement Plan to ensure ongoing support from all stakeholders.
|
Environmental conclusions
Gaining approval for the Project requires a standard environmental authorization process, commencing with discussions with MADES to set the terms of reference for the ESIA.
In planning and managing the environmental approvals for the Project, the Company will apply environmental, social, and governance (ESG) principles to local processes to ensure the Project:
|
●
|
Has local, national and international support;
|
|
●
|
Has strong ESG procedures in place to guide the development of the Project;
|
|
●
|
Helps to set the standard for future development projects in Paraguay.
|
Growing awareness of the risks associated with greenhouse gas (GHG) emissions means that energy efficient projects, especially those utilizing renewable hydroelectricity (such as the Project) will become preferred ‘green’ alternatives when sourcing feedstocks for titanium products and iron metal for ductile iron castings. The combination of hydro-electric power, efficient mining and processing methods, and economical river-based transport logistics result in the delivery of high titania slag and iron metal products with lower associated greenhouse gas emissions than from any comparable supplier.
Scope 1, Scope 2 and limited Scope 3 emissions are included in the GHG emissions calculation consistent with the method applied by TZMI. TZMI has positioned the Project onto the TZMI industry GHG curve showing how the carbon dioxide equivalent (CO2e) per tonne of final products compares to the western ilmenite smelters considered in the study.
Hydraulic mining, electric drying of concentrates, low reductant consumption in smelting and efficient transport logistics are the main reason the CO2e per tonne of product is low compared to other smelters, including those that benefit from hydropower.
|
1.9
|
Conclusions and Recommendations
|
Based on the work carried out in this study, and the resultant economic evaluation, a positive business case has been identified for the development of operations. The high titania slag and HPPI planned to be produced from the Project are expected to have the lowest GHG emissions per tonne of final products compared to ilmenite smelters considered in the study.
QP opinion on MRE
The Qualified Person (QP) has prepared the Mineral Resource estimates in this study using newly acquired data, supervised by the QP, supplemented with a limited quantity of historically acquired data. By its nature, the Alto Paraná mineralization style is consistent across large areas. In the opinion of the QP, the drill samples obtained are representative of the mineralization, and the laboratory processes applied to the drill samples emulate the likely processing steps for the minerals in future processing plants. Estimates for the Indicated Resources therefore have a high level of confidence for all aspects of volume, tonnage, mineralogy and grade.
For the much larger Inferred Resource zones, most areas depend on whole rock titanium analyses rather than direct measurements of ilmenite grade. While there is a moderately strong correlation between whole rock titanium and ilmenite grades in all areas tested to date, in the view of the QP, Resources defined using whole rock TiO2 grades can only be classified as Inferred. The QP notes that work is on-going to conduct in-fill sampling and obtain new analyses for these regional zones and believes, based on the results attained to date, there is a high likelihood that most of these Inferred zones will contain economic grades of ilmenite.
The QP has reviewed the data upon which the Mineral Resource estimate (MRE) is based and is of the opinion that the procedures and systems employed to collect and manage this information meets industry best practice. The QP is of the opinion that the supporting data is representative and adequately support the geological interpretations and estimates to the level of classification assigned.
QP opinion on relevant economic factors
The Indicated Resources have been included in the economic analyses in this study after being modified to account for likely mining losses and dilution, with the assumed factors based on experience at comparable operations. The operating and capital cost estimates have been sourced from TZMI’s database of comparable operations and are well suited to a project at this stage of development. The product pricing values reflect TZMI’s extensive experience in the titanium industry and the supply and demand of titanium feedstocks. Macro-economic assumptions such as exchange rates and global growth rates used in the economic assessment are reasonable.
The QP has considered the relevant economic factors in selecting an appropriate cut-off grade and in identifying those portions of the Resource with reasonable prospects for economic extraction.
QP level of uncertainty
Within the Indicated Resources, grades and thickness of mineralization vary smoothly, and little variation is expected with either grades or volumes when future in-fill drilling is completed. The bulk density factor is based on thorough testing completed in 2023, and while bulk density samples still need to be taken across the Indicated Resource zones, sampling to date shows only minor variability across large areas of the Project.
In the view of the QP, the two areas of greatest uncertainty regarding the Resources within the Project are: the ilmenite grades within Inferred Resources with moderate- to high- grade whole rock titanium values, and the minor-element chemistry of the ilmenite in both the Indicated and Inferred Resources. Both of these uncertainties are being addressed with on-going in-fill drilling and new laboratory analyses.
On consideration, the QP believes that the levels of uncertainty with the Resource estimations are adequately reflected in the classification of Mineral Resources for the Project.
Furthermore, it is important to note that significant additional technical work, including the acquisition of additional site-specific data, is required to advance the Project to the next development stage as defined under S-K 1300, that being a Pre-Feasibility Study. The estimated costs for these activities are presented in Table 1‑4.
Table 1‑4: Forward Works Cost Estimate
|
Activity
|
|
Cost estimate
US$
|
|
Exploration and Resource definition
|
|
|
500,000 |
|
|
Hydraulic mining trials/site tailings testing/site processing/metallurgical testwork
|
|
|
900,000 |
|
|
ESG
|
|
|
150,000 |
|
|
Infrastructure
|
|
|
150,000 |
|
|
Coordination and reporting
|
|
|
500,000 |
|
|
Total
|
|
|
2,200,000 |
|
[Remainder of page intentionally left blank]
TZ Minerals International Pty Ltd (TZMI) was commissioned by Uranium Energy Corp (UEC) to prepare a Technical Report Summary (TRS) to provide investors a comprehensive understanding of the Alto Paraná Titanium Project (the Project) in accordance with the requirements of Regulation S-K, Subpart 1300 (‘S-K 1300’) of the Securities Exchange Commission of the United States (SEC).
UEC is undertaking exploration and development work for a range of metals and minerals. On July 10 2017, UEC exercised its option to acquire all of the issued and outstanding shares of CIC Resources (Paraguay) Inc. (CIC). CIC owns 100% of Paraguay Resources Inc. (Cayman) which owns and controls Metálicos y No Metálicos S.R.L. (MYNM)., the holder of 70,498 hectares of concessions approved for exploration.
The Project consists of a proposed open pit hydraulic mining operation, with concentration of the mined material to produce ilmenite which is then smelted in an arc furnace to produce a high titania slag and a high-quality pig iron product. The current study work has included processing the Alto Paraná ilmenite into marketable high titania slag and HPPI products taking advantage of the large Resource and low-cost power available in Alto Paraná. Smelting the ilmenite produces products with a significantly higher value than the Alto Paraná ilmenite. Two processing and smelting options have been proposed to investigate the effect of increasing the scale of the Project. The proposed base case project concept has a design capacity of 150,000tpa high titania slag and 100,000tpa pig iron based on a single furnace plant. The stretch case concept has a design capacity of 500,000tpa high titania slag and 100,000tpa pig iron based on multiple parallel mining operations and a multiple furnace plant.
All measurement units used in this TRS are metric units and abbreviations are summarized in Section 24.0. The currency used is US dollars. Rates provided in the local currency of Paraguayan Guaraní during the course of the study have been converted to US dollars at the rate of 7,000 Guaraní to US$1.
|
2.2
|
Registrant for whom the Technical Report Summary was prepared
|
This TRS for the Alto Paraná Titanium Project in the Alto Paraná Region, Paraguay, was compiled for UEC by TZMI with input from Colin Rothnie, a geological consultant employed by UEC.
|
2.3
|
Terms of reference and purpose of the report
|
With respect to technical submissions (‘Technical Report Summary’ as defined under item 601 of S-K 1300) relating to the Project, UEC will be specifically required to comply with S-K 1300 and item 17 Code for Federal Regulations Parts 229, 230, 239 and 249 effective 25 February 2019. S-K 1300 is regulated under the Securities Act of 1933 and the Securities Exchange Act of 1934.
The purpose of this TRS is to report Mineral Resources for the Project. In order to properly report the Mineral Resources for the Project the TRS considers the mineral processing required for the Project to produce high titania slag and HPPI products. The reporting standard adopted for the reporting of Mineral Resources included in this TRS is S-K 1300 which acts as both a reporting format for the TRS and Mineral Resources which, at the effective date of implementation, was broadly aligned with the Committee for Mineral Reserves International Reporting Standards (CRIRSCO) reporting template. Accordingly, TZMI also considers that the terms and definitions incorporated into S-K 1300 for Mineral Resource reporting to be broadly aligned with those adopted worldwide for market-related reporting and financial investments.
|
2.4
|
Principal sources of information and data
|
TZMI and UEC have based the review of the Project on information and data provided by UEC, or its advisors, along with other relevant published and unpublished data. The Qualified Persons (QPs) have endeavored, by making all reasonable enquiries, to confirm the authenticity and completeness of the technical data upon which the TRS is based.
Reference to the main sources of information used are provided in Section 24.0. Additional information was provided by UEC personnel as requested.
|
2.5
|
Site visits and scope of personal inspection
|
Steven Gilman of TZMI and Colin Rothnie visited the sites of the Project, the UEC pilot plant, Hernandarias Industrial Area, Ciudad del Este, Tres Fronteras, Itaipu power station and Asunción from August 8-13 2022, reviewing the mineralization, available transport and logistics infrastructure.
During the site visit the team met with the following personnel:
|
●
|
Victor Fernández – Country Manager – Uranium Energy Corp
|
|
●
|
Carlos Zaldivar – Vice Minister of Mines and Energy and senior ministry staff
|
|
●
|
Bernard Gunther – General Manager Operations Terport Terminales Portuarias S.A.
|
|
●
|
Ricardo D. dos Santos – General Manager – Terport Terminales Portuarias S.A.
|
|
●
|
Axel Cid Benitez Ayala – Electrical Engineering Consultant
|
Sections 1 to 4, 10, 13 to 16 and 18 to 25 of this TRS were prepared by TZMI, a third-party firm comprising mining experts in accordance with S-K 1300 sub-section 229.1302(b)(1). UEC has determined that TZMI meets the qualifications specified under the definition of Qualified Person in sub-section 229.1300. References to the Qualified Person in these sections of the TRS are references to TZMI and not to any individual employed at TZMI.
Sections 5 to 9, 11 and 17 were prepared by Mr. Colin Rothnie, a geological consultant employed principally by UEC over the last two years, whom UEC has determined meets the qualifications specified under the definition of Qualified Person in sub-section 229.1300. References to the Qualified Person in these sections of the TRS refer to Mr. Rothnie. All Resource estimations included as part of this study using S-K 1300 requirements were prepared by Mr. Rothnie.
|
2.7
|
Previously filed Technical Report Summary Reports
|
This is the first TRS filed for the Alto Paraná Titanium Project.
[Remainder of page intentionally left blank]
|
3.0
|
Property description and location
|
UEC’s Alto Paraná Titanium Project is located in eastern Paraguay in the departments of Alto Paraná and Canindeyú (Figure 3‑1). The center of the property is located approximately 100km northwest of Ciudad del Este and 75km northwest of the industrial area of Hernandarias. The Project’s Exploration Permits held by MYNM extend from 7,245,000 to 7,310,000 meters north and 692,000 to 730,000 meters east in UTM grid 21S (EPSG: 32721). The Project location is shown in Figure 3‑1 and Figure 3‑2.
Ciudad del Este has a population of approximately 300,000 and is the second largest city in Paraguay. Ciudad del Este is the major commercial center for eastern Paraguay and is connected to the city of Foz do Iguaçu in Brazil via a bridge crossing the Paraná River. Hernandarias has a population of over 80,000.
The Pan-American Highway connects Ciudad del Este to the capital, Asunción, which is approximately 300km to the west.
Additional property is required for the slagging plant which is proposed to be located 15km northwest of Hernandarias and 25km northwest of Ciudad del Este 100km from the Block E1 mine site. This location is close to existing high voltage powerlines and major transport corridors while having clear separation from populated areas.
Finished products including slag and pig iron will be transported 360km by road from the slagging plant to a port site near Asunción on the Paraguay River. The products will be periodically loaded onto barges and transported along the Paraguay and Paraná Rivers to the Río de la Plata area to be transhipped onto ocean going vessels. Consumables including coal and anthracite will be transported on the reverse journey.
Figure 3‑1: Project location map
Figure 3‑2: Project concession blocks location map
(Source: UEC)
Figure 3‑2 shows the location of the Project concessions blocks and the corresponding Table 3‑1 includes details for the licenses held.
Under the mining laws of the Republic of Paraguay, title to the mineral rights for UEC’s Alto Paraná Titanium Project is held through ‘Exploration Permits’ granted by the Ministry of Public Works and Communications (MOPC), the mining regulator in Paraguay. These mineral rights provide for the exploration of metallic and non-metallic minerals and precious and semi-precious gems within the territory of Paraguay for up to a six-year period, and for the exploitation of minerals for a minimum period of 20 years beginning from the production phase and, extendable for an additional 10 years.
UEC’s mineral properties are held as exploration permits. The coordinates of the individual 10 blocks of property are detailed in Table 3‑1.
On July 10, 2017, UEC exercised its option to acquire all of the issued and outstanding shares of CIC. CIC owns 100% of Paraguay Resources Inc. (Cayman) which owns and controls MYNM, the holder of 70,498 hectares approved for exploration. UEC owns 100% of CIC and through JDL Resources Inc. (Cayman Islands) owns 99% of Trier S.A. (Paraguay) (‘Trier’). Trier controls 100% of the pilot plant and 30 hectares of property, fee simple, upon which the Project pilot plant resides. The UEC Organization chart is shown in Figure 3‑3.
Figure 3‑3: Uranium Energy Corp. – Organization chart
As with any mining project in most countries, UEC has taken reasonable measures to ensure proper title to its interests in mineral properties and other assets, however there is no guarantee that the title to any of such interests will not be challenged. No assurance can be given that UEC will be able to secure the grant or the renewal of existing mineral rights and tenures on terms satisfactory to UEC, or that governments in the jurisdictions in which UEC operates will not revoke or significantly alter such rights or tenures or that such rights or tenures will not be challenged or impugned by third parties, including local governments, aboriginal peoples or other claimants. UEC has had communications and filings with the MOPC, whereby the MOPC is taking the position that certain concessions forming part of the Project are not eligible for extension as to exploration or continuation to exploitation in their current stages. While UEC remains fully committed to its development path forward in Paraguay, it has filed certain applications and appeals in Paraguay to reverse the MOPC’s position in order to protect UEC’s continuing rights in those concessions. UEC’s mineral properties may be subject to prior unregistered agreements, transfers or claims, and title may be affected by, among other things, undetected defects. A successful challenge to the precise area and location of UEC’s claims could result in UEC being unable to operate on its properties as permitted or being unable to enforce the Company’s rights with respect to the Company’s properties.
Tenure summary
Block A: On June 1, 2023, UEC received, through its subsidiary MYNM, the application approval certificate granted by the MOPC Mining Application Evaluation Committee. Internal procedures continue in the MOPC and the Ministry of Economy for the submission of the mining concession contract to the National Congress for its corresponding approval.
|
●
|
Environmental license: The environmental license according to resolution DGCCARN 1787 of the Ministry of the Environment and Sustainable Development (MADES) is in force until October 13, 2023. License renewal is in process.
|
Block B: On June 16, 2022, UEC received the Certificate of Approval of the Concession contract request from the MOPC Evaluation Committee for mining areas applications.
|
●
|
Environmental licenses: Environmental licenses for Blocks B1, B2 and B3 in force according to resolutions DGCCARN 2268, DGCCARN 046 and DGCCARN 047 of MADES.
|
Block C: UEC received from the MOPC the Resolution 429 of March 30, 2023, which authorizes the start of the first year of extension of the exploration phase.
|
●
|
Environmental License: Environmental license according to resolution DGCCARN 2044 of MADES in force until 2025.
|
Block D: On July 11, 2023, UEC received from the MOPC enforcement authority the Resolution 1187, which authorizes the start of the first year of extension of the exploration phase.
|
●
|
Environmental License: Environmental license according to resolution DGCCARN 2272 of MADES in force until 2025.
|
Block E: In February 2023, the request for the third year of extension of the exploration phase was submitted in a timely manner. A response from the MOPC is awaited.
|
●
|
Environmental license: MADES Resolution DGCCARN 3143 valid until September 2024.
|
Table 3‑1 provides a summary of the mineral registration information associated with each of the areas comprising the Project.
There is sufficient land available within the Alto Paraná property holdings to provide for all required mine, concentrator plant, tailings storage, and related infrastructure requirements. Additional property is required for the mineral separation plant and the slagging plant which will convert the ilmenite into slag and pig iron. This facility is proposed to be located 15km northwest of Hernandarias and 25km northwest of Ciudad del Este.
Table 3‑1: Exploration permits and tenure details
|
Block
|
Code
|
File Number
|
Area (ha)
|
Ownership
|
Permit Type
|
Permit Status
|
Approval/ Expiration date
|
Environmental license
|
Approval date
|
Expiration date
|
|
A
|
I7-i
|
17/15 (1st extension) 188/17 (2nd extension and reduction) 235/19 (3rd extension)
|
15,155.50
|
MYNM
|
Exploration
|
In process of granting extension of exploration permit pass to exploitation (pending). Reduction was approved by Res. 188/17. Application filed in Nov, 2019
|
Awaiting resolution
|
DGCCARN Nr. 1787/2022
|
13/10/2022
|
13/10/2024
|
|
B1
|
I6-a4h
|
1910/13 1891/16 (reduction)
|
8,140.00
|
MYNM
|
Exploration
|
Reduction approved by Res. 1891/2016 (31 Oct 2016). In process of granting extension of exploration permit pass to exploitation (pending).
|
Awaiting resolution
|
DGCCARN Nr. 2268/2023
|
28/07/2023
|
28/07/2024
|
|
B2
|
I6-d3
|
1910/13 1891/16 (reduction)
|
11,685.00
|
MYNM
|
Exploration
|
Reduction was approved by Res. 1891/2016 (31 Oct 2016). In process of granting extension of exploration permit pass to exploitation (pending).
|
Awaiting resolution
|
DGCCARN Nr. 046/2023
|
10/01/2023
|
10/01/2024
|
|
B3
|
I7-e1
|
1910/13 1891/16 (reduction)
|
5,942.00
|
MYNM
|
Exploration
|
Reduction was approved by Res. 1891/2016 (31 Oct 2016). In process of granting extension of exploration permit pass to exploitation (pending).
|
Awaiting resolution
|
DGCCARN Nr. 047/2023
|
10/01/2023
|
10/01/2024
|
|
C1
|
I6-d1h
|
118/15; 2242/15 (reduction); 418/22 429/2023 (1st extension current)
|
2,831.00
|
MYNM
|
Exploration
|
1st year of exploration extension
|
Awaiting resolution
|
DGCCARN Nr. 2044/2023
|
10/07/2023
|
10/07/2024
|
|
C2
|
I7-e3
|
118/15; 2242/15 (reduction); 418/22 429/2023 (1st extension current)
|
9,804.00
|
MYNM
|
Exploration
|
1st year of exploration extension
|
Awaiting resolution
|
DGCCARN Nr. 2044/2023
|
10/07/2023
|
10/07/2024
|
| Block |
Code |
File Number |
Area (ha) |
Ownership |
Permit Type |
Permit Status |
Approval/ Expiration date |
Environmental license |
Approval date |
Expiration date |
|
D1
|
I6-d3e
|
106/15; 1404/15 (reduction); 419/22 1187/2023 (1st extension current)
|
400
|
MYNM
|
Exploration
|
1st year of exploration extension
|
Awaiting Resolution
|
DGCCARN Nr. 2272/2023
|
28/07/2023
|
28/07/2025
|
|
D2
|
I7-e4
|
106/15; 1404/15 (reduction); 419/22 1187/2023 (1st extension, current)
|
6,645.50
|
MYNM
|
Exploration
|
1st year of exploration extension
|
Awaiting Resolution
|
DGCCARN Nr. 2272/2023
|
28/07/2023
|
28/07/2025
|
|
E1
|
I7-h1
|
999/14; 795/17 (reduction); 420/2021 (1st extension) and 1027/2022 (2nd extension – current)
|
4,620.00
|
MYNM
|
Exploration
|
In process of granting extension of exploration permit (pending).
|
16-05-22/ 16/05/2023
|
DGCCARN Nr. 3143/2022
|
29/09/2022
|
29/09/2024
|
|
E2
|
I7-h2
|
999/14; 795/17 (reduction); 420/2021 (1st extension) and 1027/2022 (2nd extension – current)
|
5,275.00
|
MYNM
|
Exploration
|
In process of granting extension of exploration permit (pending).
|
16-05-22/ 16/05/2023
|
DGCCARN Nr. 3143/2022
|
29/09/2022
|
29/09/2024
|
Source: UEC
UEC owns in fee simple, 100% Interest, a 30 hectare parcel within the UEC exploration permits. This property is the site of the pilot plant and test pit as illustrated in Figure 3‑4.
Figure 3‑4: UEC pilot plant area
Mining law in Paraguay
Paraguay has no significant history of mining. Mining activity in Paraguay is governed by the national constitution under Law 3180/07 (the ‘Mining Law’) and as amended by various articles in Laws No. 4269/2011 and 4935/2013. All Mineral Resources with the exception of sand and gravel are vested in the State. The MOPC is charged with the responsibility for administering the Mining Law and regulating mining activities. The Mining Law does not cover petroleum, petroleum by-products or other hydrocarbons.
Mineral rights in Paraguay are in three forms: Permiso de Prospección (Prospecting Permit), Permiso de Exploración (Exploration Permit) and Concesión de Explotación (Mining Concession). Each type of mining right has specific attributes and obligations.
The exploration land is privately owned and mainly farmland, accessible from main highways and unpaved farm roads. Prospecting and exploration permits allow UEC to dig pits, trenches, and drill, but it is necessary to obtain the landowners’ permission to work on their property.
Prospecting and exploration rights are granted by the State through permits for specified periods of time. Mining concessions are enacted as specific laws in the national Congress. Mining concessions have specific attributes with respect to the length of term of the concession and the associated financial obligations and benefits. All mining rights must be recorded in the Mining Registry to be valid.
The Mining Law (Law 3180/07) was amended by Law No. 4269/11, was made official on July 15, 2011. The amendments provide additional flexibility in mineral exploration and development and provided incentives for mining companies. Specifically, the amendments to the Mining Law provide for exemptions from local or departmental (provincial) taxes on services provided to the mining rights holder by sub-contractors, and value-added tax-free import of all non-locally produced machinery, vehicles, supplies, tools and materials necessary for mining activities during the prospecting and exploration phases.
Exploration, prospecting and mining activities are subject to prior approval of environmental plans and filing of environmental impact statements and/or environmental impact assessments with MADES. The construction and operation of the pilot plant was approved pursuant to an Environmental Impact Assessment report and the regulations pertaining to the existing Environmental License for Exploration.
The mining laws where the Project is located may be subject to certain inherent political risks for mining investment due to adverse government decisions. However, the mining legislation of Paraguay contains regulatory tools that allow for the settling of differences between the parties involved, making it possible to defend the rights of companies conducting mining activities in Paraguay.
In the case of the Project, the mineral exploration process has worked without issue since the start of exploration/development activities in 2009. However, in 2017 and 2018, there were discrepancies within the enforcement authority that led to the use of administrative regulatory tools established in the law through reconsideration measures which were resolved in favor of the Company for the Project including on Blocks B and E cases. In other cases, including Blocks C and D, lawsuits were launched against certain determinations made by the enforcement authority which were resolved with positive results, resulting in extrajudicial agreements approved by the courts allowing the restitution of all mining rights held by the Company.
At the time of writing, mining rights over all areas of the Project have been re-established and several of the exploration permits (Blocks A and B) are in the process of acquiring concessions based on contracts to be approved by the National Congress.
Project Permitting
The Project will be required to submit a detailed environmental impact assessment (Evaluación de Impacto Ambiental, ‘EIA’) for the Project prior to obtaining a permit for mine development and construction of the processing and smelting facilities in accordance with Law 294/93. The EIA must cover all aspects of the Project and provide details on prevailing environmental conditions with respect to water, flora and fauna, air, noise, social and other factors, the expected impacts of the Project on the physical and social environment, as well as any mitigating measures. The EIA must be prepared and submitted to the Ministry of the Environment and Sustainable Development (MADES) by a locally registered and approved environmental consultant.
There are no known legal, permitting, or title issues that could have a detrimental effect on the Mineral Resource estimates and potential mineability of these estimates.
Permits to take water from either underground or surface sources for industrial purposes will be required in accordance with Law 3239/2007. Hydrogeological studies of the impact of water withdrawal on the subsurface aquifer and on surface water drainage patterns will be required. Permits will also be required for discharge of treated water to any receiving streams and for the disposal of tailings which could release water to the surrounding surface or subsurface environment. Characterization studies of tailings discharges will be required.
Permits for taking potable water and for sewage disposal will be required under Law 1614/00.
To date, Paraguayan authorities have been very co-operative and there are no known legal, permitting, or title issues that could have a detrimental effect on accessing the groundwater required by the Project.
|
3.4
|
Royalties and other payments
|
The Project is subject to a 1.0% net smelter returns (NSR) royalty payable to CIC. There are no royalties payable to the state in Paraguay.
|
3.5
|
Environmental liabilities
|
At the pilot plant, active mining and tailing areas were refilled to natural elevation and topsoil replaced. Most of the affected area is now being routinely cropped with little evidence of the earlier mining activities. Small areas near the pilot plant that remained unrehabilitated, such as small pits and working areas, are rapidly becoming over-grown with natural regrowth. The pilot plant itself can be easily disassembled and removed when it is no longer required. There are no long-term liabilities evident from the trial mining at the pilot plant.
No mining concessions have been issued for the Project.
[Remainder of page intentionally left blank]
|
4.0
|
Accessibility, climate, local resources, infrastructure and physiography
|
|
4.1
|
Topography, elevation and vegetation
|
The Project property is located in the department of Alto Paraná in eastern Paraguay. The Project property covers a very large area extending 65km in a north-south direction and 38km west to east. Over this large area the elevations are variable and range between 150-380 meters above sea level. Drainages are generally west to east leading to the Paraná River. Drainage valleys are typically wooded. Environmental regulations require farmers to set aside a proportion of the land for tree cover. As similar regulations apply to mining activities the mine plan has included 100 meter buffers to be left beside vegetated bosque areas so that native vegetation is not disturbed by the mining process.
Figure 4‑1: Typical landscape at Block E1
The Block A lease, where the base case mining operation will commence, covers approximately 12km x 15km and consists mainly of gently rolling farmland consisting of cropped fields with sparse scattered bush and forested areas remaining. Eastern Paraguay, especially the department of Alto Paraná where the Project is located, is intensively farmed. Typical land uses within the Project area include farming of soybeans, corn, wheat, rice, canola and raising cattle.
Access to the property is provided by a paved highway (Highway 509) leading north from Ciudad del Este and roughly bisecting the property to the town of Cruce Carolina. A network of gravel roads throughout the concession areas provides local access to all areas of the property. The center of the property is located approximately 100km northwest of Ciudad del Este.
Ciudad del Este is located approximately 300km east of, and is connected to, the capital Asunción by the Pan-American Highway. The Pan-American Highway connects to Brazil via a crossing of the Paraná River from Ciudad del Este to Foz de Iguaçu. Foz de Iguaçu, a city with a population of approximately 260,000, is connected to several ports on the east coast of Brazil via national highways and railroad. The new bridge at Tres Fronteras is complete, and construction of the road approaches is well under way. By the forecasted Project startup date, the second road crossing is expected to be in use.
The capital of Paraguay is Asunción, a modern city with a population of approximately 3.5 million. The country has a modern system of highways and international airports in Asunción and Ciudad del Este, the second largest city. The economy is largely based on agriculture, with some light manufacturing and tourism.
The Paraná River is navigable up to Tres Fronteras and barge shipping to ports near Ciudad del Este is available from ports in Argentina and Uruguay. Shipments to the property can also be made through Asunción via the Paraguay River and Rio de la Plata from Argentina.
The Yacyreta Dam is part of the route from Ciudad del Este to the Atlantic. Due to the time taken to traverse through the lock the eastern side of the Paraná River has a limit on barging capacity which is a contributing factor to the decision to export the products via Asunción and the Paraguay River.
The climate in the Project area is classified as semi-tropical. Rainfall is recorded in every month of the year and averages approximately 1,800 millimeters (mm) per year, with a peak of approximately 220mm in October and a minimum of approximately 70mm in August. While there is no distinct dry season, the winter months of June through August receive significantly less rainfall than other months. Rainfall in the peak months is often in the form of intense downpours. The average number of rainy days varies from 12 days per month in January to 5 days per month in August.
Temperatures are typically moderate, with peak daytime temperatures experienced during the summer months of November through March. The maximum temperature in March averages approximately 31°C, with a minimum of approximately 21°C. June and July are the coolest months, with maximum temperatures in the range of 22°C – 23°C and minimum temperatures as low as 12°C.
Neither weather nor climate poses a risk to mine or plant operation. However, the unsealed roads and in-pit ground conditions may become soft and slippery during high rainfall events limiting the use of heavy vehicles in active mining areas. Heavy rain in the active mining areas will collect in catchments and hydraulic mining channels, however most storm events are intermittent and hydraulic mining machinery will likely be unaffected by rainfall events.
Paraguay is a major exporter of hydroelectric power, with major dams at Itaipu, Acaray and Yacyreta on the Paraná River. The Itaipu dam is a joint operation between the governments of Paraguay and Brazil and has the world’s second largest instantaneous hydroelectric generating capacity with a rated generating capacity of 14,000MW and supplies approximately 90% of Paraguay’s power requirements. The Itaipu Dam is located just north of Ciudad del Este and approximately 80km southeast of the center of the Project property. The availability of low-cost hydroelectric power is one of the major industrial attractions of Paraguay and provides the opportunity to produce slag and pig iron with a very low carbon footprint.
High voltage power transmission lines , 66kV and 220kV, run next to the highway, as well as lower voltage local power lines. There is a major sub-station located at Itakary, approximately 20km south of the Project pilot plant site connecting the 220kV and 66kV power lines from the Itaipu hydroelectric power station. A 500kV line is currently under construction and will follow the right-of-way of the 220kV line.
Local infrastructure in the area is good with a paved national highway (Highway 509) leading north from Ciudad del Este through the UEC Concession area. Local access and farm roads provide a well-developed network of access throughout the property. The national system of highways is reasonably well developed and connects the major cities in Paraguay. The Pan-American Highway crosses Paraguay from Ciudad del Este to Asunción, with bridge connections to Brazil between Ciudad del Este and Foz de Iguacu. There is also a bridge connecting Encarnaçion with Posadas in Argentina. A rail line connects Asunción to Buenos Aires through a crossing from Encarnaçion to Posadas, but within Paraguay the line is in a state of disrepair and has been assumed to be unusable for the purposes of the study.
Water transport on the Paraná River using barges is available for movement of bulk commodities from a network of ports located below the Itaipu dam near Ciudad del Este and Tres Fronteras. This barge system provides for access to ocean ports in Uruguay and Argentina. The maximum allowable draft at low water is approximately 3.6 meters at Encarnaçion, which decreases to approximately 2.7 meters at the ports located near Tres Fronteras. As there are no existing facilities suitable for handling bulk industrial products at Tres Fronteras barge port facilities for the storage, loading and unloading of materials would need to be constructed as part of the Project’s development. Currently the port of Tres Fronteras is only authorized for the export of grains and both UEC and TZMI have been advised that authorization and infrastructure development required for the export of minerals is considered extremely costly and of limited interest to current port and barge operators.
The Upper Paraná River section from Tres Fronteras to the confluence with the Paraguay River has a limited draft and the dredging planned by the MOPC will improve the outlook for this transport route.
Additionally, there is a risk the Upper Paraná River waterway is subject to seasonal variation with restrictions being imposed during periods of drought. Additional detail is provided in Section 15.0 Infrastructure.
The Paraná River is navigable from the Atlantic Ocean to the confluence with the Paraguay River, and then on to Asunción. HandySize ocean going vessels of up to 25,000 dwt are able to navigate to Asunción. There are a number of contract barge operators in Asunción and Villeta 30km south with existing infrastructure suitable for the storage, loading and unloading of bulk industrial products and containers.
Make-up water required for hydraulic mining and concentration will be extracted from the near surface aquifer where the water table is reported to be present near the saprolite/laterite interface.
A number of small to mid-size towns within the mineral leases provide local services and supplies. Local manual labor is generally available from the surrounding communities, while skilled labor and heavy construction equipment is sourced from Ciudad del Este. The previous owners of the project, CIC, constructed a small pilot plant near the mid-sized town of Minga Pora which is connected to the local power grid. As part of the pilot plant program a water well for process water was drilled and equipped at the pilot plant.
There are two aggregate crushing operations nearby which can provide sufficient aggregate for construction purposes and provide scrubbing and attritioning media.
Natural gas is not available in Paraguay and Paraguay has no proven natural gas reserves.
[Remainder of page intentionally left blank]
The previous owners of the Project, CIC, began reconnaissance sampling for bauxite on the properties in 2008. Anomalous levels of titanium in early samples caused a change in exploration focus. The following year widely spaced, shallow auger drilling identified elevated levels of titanium across large areas of Alto Paraná and Canindeyú Departments of eastern Paraguay. In 2010 and 2011 infill auger drilling and pit sampling delineated areas of high-grade titanium mineralization within the laterite horizon. A test mine and pilot plant were constructed in one mineralized area near the town of Minga Pora, and ilmenite and titanomagnetite concentrates were produced. One hundred and eight tonnes of mixed concentrate was subsequently smelted in South Africa to produce slag and pig iron products, as described in the Alto Paraná 2012 PEA (Haines, 2012).
Tronox Mineral Sands (Pty) Ltd (Tronox), a subsidiary of Tronox Holdings Plc., held an option on the Project in 2012/2013 and conducted processing tests on existing drill samples. In conjunction with Hatch Goba, they produced a Key Elements Analysis report in 2014. The Key Elements Analysis report did not identify any technical fatal flaws, but Tronox elected not to proceed with the project. It is noteworthy that at the time of that decision, product prices had fallen markedly from highs seen in 2012.
|
5.1
|
Previous Resource Estimates
|
There are no historical Mineral Resource estimates reported using the definitions from S-K 1300. The historical estimate discussed in the following paragraphs was classified in accordance with the definitions for Mineral Resources in the Canadian Institute for Mining (CIM) Definition Standards for Mineral Resources and Mineral Reserves.
Early Resource estimates for this Project applied to different areas than the currently held leases and are not directly comparable to the current area (Haines, 2012, Kuhn et al., 2015). In the first comparable estimate, Kuhn & Brown (2017) reported an Inferred Resource estimate for the current lease areas using the same sample data and applying the same techniques as previous estimations reporting 4.9Bt at 7.4% TiO2, using a 6% whole rock TiO2 cut-off grade, and assuming a bulk density factor of 1.64tonne/m3.
Table 5‑1: Historical Resource estimations for the currently held leases (using 6% whole rock TiO2 cut-off)
|
Reference
|
Category
|
Tonnage
(Mt)
|
Average
whole rock
TiO2%
|
Average
whole rock
Fe2O3%
|
Average thickness
(m)
|
Comments
|
|
Kuhn & Brown, 2017
|
Inferred
|
4,940
|
7.41
|
23.58
|
6.61
|
First resource estimate for the currently held lease areas. Doesn’t use S-K 1300 definitions.
|
Notes:
|
1.
|
CIM definitions were followed.
|
|
2.
|
Qualified Person is David Brown P. Geo.
|
|
3.
|
Minimum thickness of 1 meter was used.
|
|
4.
|
The Resources lie within a property area of 70,498 hectares.
|
|
5.
|
Effective date December 2016.
|
Previous Resource estimations included the following clarifying comment:
“There are some physical factors concerning moisture content, specific gravity variation, and grain size which could affect the recoverable titanium metal from the currently estimated resource. These factors will have to be assessed in any future reserve estimates and economic evaluation studies.”
In the work reported in the current study, uncertainty regarding the recoverable titanium metal has been addressed within areas tested to date. In addition, new Resource estimates have been made, complying with S-K 1300 requirements and incorporating new bulk density information acquired as part of this study.
[Remainder of page intentionally left blank]
|
6.0
|
Geological setting, mineralization and deposit
|
Precambrian Cratons in Paraguay
The oldest rocks in Paraguay are exposed in two Precambrian blocks in the Eastern Region of the country as shown in Figure 6‑1. The Apa River Province lies about 300km north of Asunción in the Concepción Department, extending north of the border into Brazil. The Tebicuary River Province is located about 150km SSE of Asunción, straddling the boundary between Paraguarí and Misiones departments.
Both cratonic blocks include crystalline units of Paleoproterozoic age, Mesoproterozoic fold belts and Neoproterozoic-Cambrian platform units.
Figure 6‑1: Regional geology
Source: Background map extracted from the Geological Relief Map of South America, Commission for the Geological Map of the World (2022)
Phanerozoic rocks in Paraguay
The Phanerozoic in Paraguay is represented by two large basins: the Chaco Basin in the west and the Paraná Basin in the east as shown in Figure 6‑2. The Paraná Basin encompasses a vast area of the South American continent, approximately 1,500,000km2, encompassing parts of southern Brazil, northeastern Argentina, eastern Paraguay and northern Uruguay. With its major axis oriented NNE-SSW and its structural depocenter located along the Paraná River, the Paraná Basin contains sedimentary and volcanic rocks with a total thickness exceeding 7,000 meters.
Figure 6‑2: Intracratonic Basins in South America, showing the Paraná Basin
Source: Milani & Zalan, 1999
The equivalent Paraguayan stratigraphy for the Paraná Basin is given in Figure 6‑3. The figure shows the Paraná Basin Schematic Cross-Section NNW-SSE showing the Alto Paraná Formation (Fm Serra Geral) at the top of the sequence. The deepest portion of the basin corresponds approximately with the Paraná River.
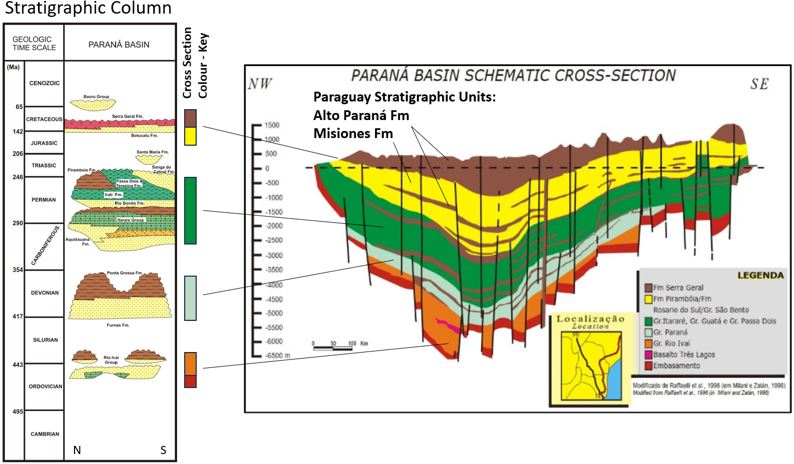
Figure 6‑3: Stratigraphic Column and Paraná Basin schematic cross-section
Sources: (Menezes & Travassos, 2010; Gomes & Gomes, 2018)
At the time the Alto Paraná Formation eruptions commenced, the Paraná Basin was covered in thick desert sands. The basalts of the Alto Paraná Formation now overlie and are interbedded with clean aeolian sandstones of the Misiones Formation shown in yellow in Figure 6‑3. Along with stratigraphic equivalents in Argentina and Brazil, these formations comprise the Guarani Aquifer (Foster et al, 2004), which forms an extensive aquifer with good quality groundwater under the basalts throughout the Project area and the greater region.
Figure 6‑4 shows the paleogeography at 130Ma at the time the Alto Paraná Formation erupted (Scotese, 2013). The circle marks the location of the Paraná-Etendeka Large Igneous Province (PE-LIP).
Figure 6‑4: Paleogeography at 130Ma at the time the Alto Paraná formation erupted
Source: Scotese, 2013
The thick sequence of mostly tholeiitic basalt and associated intrusives of the Alto Paraná Formation covers most of the present extent of the Paraná Basin. This voluminous stack of volcanic and intrusive rocks resulted from extensional rifting when the South Atlantic Ocean opened, separating South America from Africa. The cause of the rifting is believed to be a mantle plume that may have remained active up to modern times and is currently situated under the island of Tristan da Cunha (Lindsay et al, 2021). The Paraná Basin sequence, along with similar formations in Namibia (Etendeka Continental Flood Basalts) form the Paraná-Etendeka Large Igneous Province (PE-LIP), one of the world’s major Large Igneous Provinces with an estimated erupted volume of over 1 million km3 (Lindsay et al, 2021). Comparable provinces are the perhaps better known Deccan Traps in India and the Siberian Traps, both with comparable volumes of basalt, although deposited at different times.
Eruption of the PE-LIP developed during the Early Cretaceous age, commencing about 134Ma. The sequence consists mostly of tholeiitic rocks exposed as large subaerial lava flows, radiating and circumferential dike swarms and intrusive igneous rocks. Older low-Ti igneous rocks predominate in the south with younger high-Ti basalts and intrusives towards the north (Bellieni et al., 1984b, Buchan and Ernst, 2019).
Figure 6‑5 shows the Distribution of low-Ti and high-Ti basalts in the South American portion of the Paraná-Etendeka Large Igneous Province.
Figure 6‑5: Distribution of low-Ti and high-Ti basalts
Source: Bacha et al, 2022
Intrusives in the Alto Paraná Formation are an essential component in the subsequent development of titanium mineralization in the Alto Paraná region. Although intrusive dikes and sills are observed in basalt exposures and quarries in the Project area, their distribution, as with the basalt, is generally concealed by widespread lateritic weathering across the region. Their presence may be inferred, however, from the geochemical characteristics of the laterite and coarser grainsize of remnant mineral particles. Mapping of rocky exposures along drainages east of Minga Pora recorded 10 outcrops of intrusives, including gabbro and gabbro-diorite, and 29 outcrops of basalt.
Figure 6‑6 below shows the Outcrop geology along drainage channels, east of Minga Pora, with basalt in blue and intrusives in green.
Figure 6‑6: Outcrop geology along drainage channels, east of Minga Pora (CIC sampling 2009, 2010)
Source: UEC 2022
Given that the many hundreds of meters thick Alto Paraná Formation basalt erupted into the Paraná Basin, the early basaltic eruptions are likely to have formed a ‘cap’ that presented an obstacle for later magmas reaching the surface. Some of these later TiO2 enriched magmas have apparently intruded as dykes and sills between earlier basalt flows and cooled more slowly, allowing the ilmenite and titanomagnetite to crystallize into larger particles (see Figure 6‑27).
Above the basalts of the Alto Paraná formation are Cretaceous sandstones of the Acaray Formation, correlated with the Upper Cretaceous Caiuá Formation of Brazil, the base of the Baurú Group.
Subsequently, there are minor tertiary and quaternary sediments and weathering products, including the lateritic profiles that form the focus of the current study.
The laterite profile dominating the basaltic plateau region of Alto Paraná (Figure 6‑7) generally consists of:
|
●
|
A soil layer at the surface, generally with organic matter;
|
|
●
|
A ‘laterite’ horizon consisting of red-brown kaolinitic clay, black ilmenite, magnetite sand and rare iron- or clay-cemented ‘nodules’;
|
|
●
|
Saprolite, highly weathered rock or rock fragments, often ochre-yellow in color;
|
|
●
|
Weathered basalt, generally pale clay-altered basalt with remnant textures and structures (vesicles etc); and
|
Figure 6‑7: Schematic weathering profile at Alto Paraná
Source: Haines, 2012
Figure 6‑8: Top portion of the laterite profile exposed in a road cutting, Block A Alto Paraná
Figure 6‑9 shows a basalt quarry in the Alto Paraná province with overlying laterite. In this location, there is very little saprolite or weathered basalt.
Figure 6‑9: Alto Paraná basalt quarry showing overlying laterite
Figure 6‑10 shows a road cutting at Block A with the laterite profile and heavy mineral derived from the profile concentrated in a rainwater channel.
Figure 6‑10: Road cutting at Block A showing the laterite profile
Figure 6‑11: Schematic cross-section showing geomorphological features of the mineralized laterite horizon
As described in the previous section, the basalts of Alto Paraná Formation have interlayered intrusive dykes and sills. These intrusives have probably weathered differently to the more common basalt layers due to grainsize and compositional differences. As well, from interpreting available information, the sills appear to be of variable length and thickness.
In places the sills appear to have been preferentially weathered and eroded and are now located in low topographic zones near the generally wide, flat drainage channels (bosques). These channel areas are not generally prospective for laterite mineralization as the laterite layer has been largely stripped from the profile (see Figure 6‑11). Thin titanium enriched zones are often found, however, near the surface of slopes flanking the channels.
In other areas, the sills underly topographically elevated areas such as ridges and the gently undulating flanks of hills. In these locations the laterite layers are prospective for large volumes of contiguous, high-grade titanium mineralization and have therefore been the target of recent exploration work.
Block A Property geology
On the basis of the pit and drillhole sampling on Block A, there appears to be three types of basement with corresponding overlying laterite layers (Figure 6‑12):
|
●
|
Low-Ti zones. Probably with low-TiO2 basalt in the basement and overlain by laterite containing about 6% whole rock TiO2 (5-7%) and 2% or less Recoverable TiO₂;
|
|
●
|
Mid-Ti zones. Possibly gabbroic or doleritic basement, overlain by laterite containing about 7% whole rock TiO2 (7-8%) and 3-5% Recoverable TiO₂;
|
|
●
|
High-Ti zones. Probably gabbroic basement overlain by laterite containing greater than 8% whole rock TiO2 and 4–7% Recoverable TiO2.
|
The Low-Ti zone corresponds to a topographic ridge that runs NNW-SSE in the north-center of the tested zone. Samples from laterites in this area have a low percentage of recoverable ilmenite. Unfortunately, many of the samples tested by Tronox in 2012-13 were from this zone.
The mid-Ti zone is mostly found in the south of the tested area, including the area around the pilot plant site and the material mined for the trial mining in 2011.
The extent of the high-Ti zone is complicated by the anomalously high TiO2 values found in laterites next to the drainage channels, however there are sufficient samples away from these zones to indicate the high-Ti zone occupies a large portion of the western area, a discrete zone just south of the low-Ti zone and, probably, a narrow zone on both sides of the drainage channels on the east of the sampled zone (Figure 6‑12). In this figure, three types of basement and laterite are shown: Low-Ti, generally about 6% TiO2, mid-Ti, about 7% TiO2, and high-TiO2 generally above 8% TiO2. Topographic contours of 10 meters are shown.
Figure 6‑12: Block A prospect geology
Blocks E1 & E2 Property geology
Unlike Block A, there has been insufficient drilling and sampling to characterize the basement in these other blocks. Recent drilling on Block E1 has demonstrated a moderately large area of high-elevation and high-Ti basement exists in the drilled area in the north of the lease, but the lateral extents of this zone are poorly defined. For Block E2, there was less recent drilling completed and the results are mixed.
Titanium bearing phases
Titanium is present in three different phases in the Alto Paraná laterites:
|
●
|
groundmass or ilmenite and titanomagnetite finer than 45µm
|
Ilmenite
Ilmenite is present as fine to medium grains. QEMScan sizing analyses of the bulk sample BSE204 show the ilmenite is clearly finer-grained and better sorted than the titanomagnetite, with a D50 of about 100µm. Figure 6‑13 is a photomicrograph of ilmenite concentrate from Block E2 showing relatively clean ilmenite, but with some surface contamination of clay.
Figure 6‑13: Ilmenite concentrate from Block E2
Figure 6‑14 shows the particle size distribution of the two main titanium-bearing magnetic fractions 0.05A magnetics (Mag1, predominantly titanomagnetite) and 0.5A magnetics (Mag2, predominantly ilmenite). Note that about 80% of the ilmenite grains lie between about 50 and 215µm.
Figure 6‑14: Particle size distribution of the two magnetic fractions
In comparison to titanomagnetite in the laterite layer, ilmenite has a relatively uniform composition and interior structure. This is rare for weathered ilmenite, as ilmenite in heavy mineral deposits typically exhibits zoning, lamellae and exsolution rims. Figure 6‑15 shows three QEMScan images of the 0.5A mags fraction, predominantly ilmenite, showing generally uniform composition between and within the ilmenite grains. The coarser, variable grains in the image are titanomagnetite.
Figure 6‑15: QEMScan image of 0.5A mags fraction (dominantly ilmenite)
The chemistry of the ilmenite depends on the purity of the concentrate and the degree of grain coatings. While the major elements TiO2 and Fe2O3 are not significantly affected by impurities and coatings, the Al2O3 and SiO2 are mostly attributable to these contaminants.
The contaminants contained in the coatings can be accounted for by:
|
●
|
Intensively leaching and attritioning the ilmenite concentrate to remove coatings;
|
|
●
|
Scanning of just the interior of the ilmenite grains with a scanning electron microscope.
|
The results below reflect some of the more ‘pure’ ilmenite samples that have been analyzed at Alto Paraná.
Table 6‑1: Alto Paraná ‘pure’ ilmenite mineral, analyses of major and minor elements
|
Zone
|
|
TiO2
|
|
|
Fe2O3
|
|
|
Al2O3
|
|
|
SiO2
|
|
|
MgO
|
|
|
MnO
|
|
|
V2O5
|
|
|
2022 Acid Leached Sample *
|
|
48.6 |
|
|
53.9 |
|
|
0.29 |
|
|
0.27 |
|
|
0.99 |
|
|
0.63 |
|
|
0.28 |
|
|
2013 Tronox Ilmenite Concentrate from Block A for Smelter Testing*
|
|
47.8 |
|
|
53.0 |
|
|
0.44 |
|
|
0.23 |
|
|
1.12 |
|
|
0.54 |
|
|
0.31 |
|
|
2014 calculated Ilmenite end-member composition from QEMScan results of IR (Ilmenite-rich) Concentrate (Block A)
|
|
50.2 |
|
|
51.4 |
|
|
0.34 |
|
|
0.20 |
|
|
1.19 |
|
|
0.55 |
|
|
0.27 |
|
|
2023 QEMScan calculated ilmenite end-member within the RED Mag ilmenite-rich product (Block E2)
|
|
51.3 |
|
|
50.0 |
|
|
0.40 |
|
|
0.40 |
|
|
1.0 |
|
|
0.60 |
|
|
0.18 |
|
* ilmenite concentrates typically still contain a portion of titanomagnetite, lowering the TiO2 and raising the Fe2O3 and the V2O5
Titanomagnetite
Titanomagnetite is the second-most important titanium-bearing mineral at Alto Paraná. As noted in the previous section, it is coarser than the ilmenite, poorly sorted and more angular. The titanomagnetite D50 measured in the QEMScan sizing analysis is approximately 230µm. Another notable feature of the titanomagnetite grains are the cavities on many of the grains and crystals faces - reminiscent of ‘hopper’ crystals with cavities resulting from the crystal growing faster at the edges of each face than at the center. Figure 6‑16 shows the titanomagnetite concentrate with frequent euhedral crystal forms and clay- and iron oxide-rich concretions inside the cavities on the grain faces.
Figure 6‑16: Titanomagnetite concentrate with frequent euhedral crystal forms
Figure 6‑17 shows a QEMScan false color image of a titanomagnetite-rich fraction. Note the lamellae and zoning in most of the grains, where TiO2-rich zones, typically of ilmenite composition, are shown in pink. The large particle in the box is shown in more detail further below. Clay-rich coatings and inclusions are shown in green.
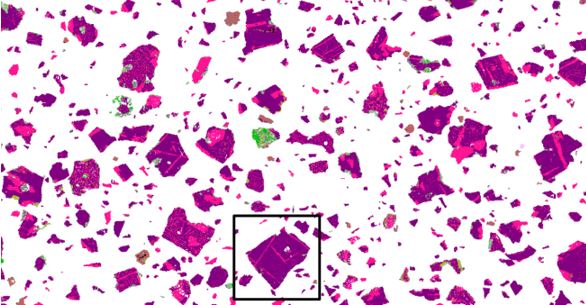
Figure 6‑17: SEM image of titanomagnetite-rich fraction
Figure 6‑18 shows a coarse titanomagnetite grain with lamellae of titanium and iron-rich zones. The minor elements inside the marked rectangle are mapped in Figure 6‑19. The element map images show that the darker stripes on the SEM image are enriched in Ti, Mg and to a small extent Mn. Fe and Al are enriched in the lighter areas.
Figure 6‑18: Coarse titanomagnetite grain showing lamellae of titanium and iron-rich zones
Figure 6‑19: Enlargement of a small section of one titanomagnetite grain (previous image) showing element distributions (elements are labelled in the lower left corner)
QEMScan analyses show that titanomagnetite grains are typically strongly zoned with Ti-rich lamellae and less regular ‘blebs’ of ilmenite. Even when zoomed in to a very small area (Figure 6‑19), the Ti and Fe maps show a strongly latticed structure, with alternating Ti and Fe-rich layers. Refer to the Fe and Ti maps on the top row of the above image.
The structures are likely to be due to the titanomagnetite crystallizing out of the mafic melt at high temperature and then becoming unstable as the magma cooled or in the weathering profile.
Magnetic response of titanomagnetite
Generally, titanomagnetite can be separated from ilmenite using low intensity magnetic separation (LIMS). However, in some areas the titanomagnetite has reduced magnetic susceptibility, presumably due to the magnetite converting to hematite. From the work completed to date, the areas where titanomagnetite has reduced magnetism are near the tops of hills, possibly reflecting more lengthy oxidizing weathering conditions.
The loss of magnetism in the titanomagnetite in some zones makes it more difficult to separate ilmenite and titanomagnetite in the ‘standard’ way with magnetic separation, because their magnetic response is similar. However, testing of a short duration reducing roast showed that the magnetism of the titanomagnetite can be easily restored. As well, there are grainsize differences that can also be used to separate the minerals.
Figure 6‑20 shows a photomicrograph close-up in natural light showing very weakly magnetic titanomagnetite grains with clay-rich fill inside the surface concavities.
Figure 6‑20: Close-up in natural light showing very weakly magnetic titanomagnetite
Chemical composition of titanomagnetite
Very few of the titanomagnetite mineral concentrates have been sufficiently cleaned to remove all of the Al2O3-rich coatings and inclusions. To date, the best compositions have been derived from scanning the grains with SEM as shown in Table 6‑2.
Table 6‑2: Alto Paraná Titanomagnetite analysis
|
Zone
|
|
TiO2
|
|
|
Fe2O3
|
|
|
Al2O3
|
|
|
SiO2
|
|
|
MgO
|
|
|
MnO
|
|
|
V2O5
|
|
|
2014 Tronox calculated end-member from Titanomagnetite concentrate ‘CM’ from Block A
|
|
25.5 |
|
|
71.8 |
|
|
1.46 |
|
|
0.40 |
|
|
0.50 |
|
|
0.48 |
|
|
0.76 |
|
|
2023 SEM scanning of titanomagnetite grains from the LIMS Mag product (calculated end-member)
|
|
25.5 |
|
|
73.0 |
|
|
1.50 |
|
|
0.50 |
|
|
0.52 |
|
|
0.48 |
|
|
0.72 |
|
It is noteworthy that the principal contaminants in the titanomagnetite are Al2O3 and V2O5. This is in comparison to ilmenite, where the principal contaminants, once Al2O3 and SiO2 on the coatings are removed, is MgO.
Groundmass
A portion of the TiO2 is contained in the fine fraction of the mineralization and is not recovered when samples are screened. Currently, 45um screens are used to reject fine particles and groundmass.
There have been several attempts to directly measure the proportion of TiO2 finer than 45µm in the silt and clay (slimes) fraction. When the drill samples from the 2022 program were wet screened, the slimes fractions for two samples were retained, dried and analyzed with XRF.
|
●
|
In sample 25636, a typical, moderately high-grade laterite sample with 8.3% whole-rock TiO2, 32% of that TiO2 was contained in the -45µm fraction.
|
|
●
|
In the second sample (25632, a saprolite sample) 56% of the TiO2 was contained in the -45µm fraction.
|
Table 6‑3: Alto Paraná laterite whole rock analysis
|
Zone
|
|
TiO2
|
|
|
Fe2O3
|
|
|
Al2O3
|
|
|
SiO2
|
|
|
MgO
|
|
|
MnO
|
|
|
V2O5
|
|
|
Sample 25632 APE2011 3-4m (saprolite)
|
|
|
Whole Sample (with 9.5% HM)
|
|
|
7.55 |
|
|
|
26.9 |
|
|
|
19.9 |
|
|
|
34.5 |
|
|
|
0.64 |
|
|
|
0.33 |
|
|
|
0.17 |
|
|
-45µm Fraction (86.6% of total)
|
|
|
4.91 |
|
|
|
23.5 |
|
|
|
24.0 |
|
|
|
35.7 |
|
|
|
0.65 |
|
|
|
0.27 |
|
|
|
0.13 |
|
|
Proportion of element in -45µm fraction
|
|
|
56% |
|
|
|
76% |
|
|
|
100% |
|
|
|
90% |
|
|
|
88% |
|
|
|
71% |
|
|
|
66% |
|
|
Sample 25636 APE2012 2-3m (typical laterite)
|
|
|
Whole Sample (with 15.3% HM)
|
|
|
8.34 |
|
|
|
26.4 |
|
|
|
24.9 |
|
|
|
28.8 |
|
|
|
0.37 |
|
|
|
0.13 |
|
|
|
0.13 |
|
|
-45µm Fraction (81.4% of total)
|
|
|
3.26 |
|
|
|
19.5 |
|
|
|
30.4 |
|
|
|
33.5 |
|
|
|
0.29 |
|
|
|
0.08 |
|
|
|
0.06 |
|
|
Proportion of element in -45µm fraction
|
|
|
32% |
|
|
|
60% |
|
|
|
100% |
|
|
|
95% |
|
|
|
64% |
|
|
|
50% |
|
|
|
38% |
|
TiO2 in groundmass discussion
The previous sections show that a significant portion of the TiO2 in the mineralization at Alto Paraná is finer than 45µm and, with current processing technology, effectively unrecoverable. The available results show that, in general:
|
●
|
At low to medium grades, with whole rock TiO2 4-6%, most of the TiO2 is found in the groundmass and only a minor fraction, 25 to 50%, of the total is recoverable;
|
|
●
|
At higher whole rock TiO2 grades, such as about 8% TiO2, the proportion of recoverable TiO2 increases and about 50-70% of the whole rock TiO2 is contained in particles coarser than 45µm;
|
|
●
|
When the available Recoverable TiO2 values are plotted against whole rock TiO2, there are apparent differences in ‘recoveries’ between areas Block A vs Blocks E1/E2 that may be due to differences in the mineralization in the two regions Figure 6‑21.
|
Figure 6‑21: Plot showing recoverable TiO2 versus whole rock TiO2
Given the complications caused by the variable percentage of TiO2 present in the groundmass, additional work has been conducted on drill samples acquired recently to quantify recoverable titanium, ilmenite and titanomagnetite grades.
|
6.5
|
Block A mineralization
|
Block A mineralization has been tested in detail in an area approximately 5km north of Minga Pora, extending for about 3km east-west and 4km north-south. Mineralization is hosted in the near-surface soil horizon and the underlying laterite horizon (see Section 6.2 - Local geology).
Figure 6‑22: Drillholes on Block A showing average whole-rock TiO2 of the laterite layer
Mineralization is apparently controlled by two different source rocks in the tested area:
|
●
|
A lower grade, probably basaltic source under the main hill in the test area. The laterite in this area is relatively thick (8–10 meters), but the TiO2 content is generally low (below 6.4%) and gives a low yield of ilmenite when processed.
|
|
●
|
At least one type of higher grade source, probably a high-TiO2 gabbro or gabbro-diorite, that, at least in the detailed tested area and nearby areas, lies under some of the drainage channels and the nearby lower and middle flanks of some of the hills. Laterite in these areas is generally thinner than lower-grade zone, averaging about 7 meters thickness. Most of the laterite in the channel areas (bosques) has been eroded, leaving little or no potentially mineable material in these zones.
|
|
6.6
|
Block E1 mineralization
|
Drilling in 2022 targeted a zone of mineralization towards the north of Block E1. The mineralized laterite horizon lies around a low hill forming a zone 3.3km long (east-west), and 1.4km wide (north-south) and averaging 7.5 meters of depth. In this area it is likely that the underlying source rock is a gabbro or gabbro-diorite with high TiO2. The mineralized laterite consists of red-brown iron-stained kaolinite with sand-sized ilmenite and titanomagnetite. There are rare iron-cemented zones near the base of the laterite profile and minor quartz grains.
Figure 6‑23: Block E1, average laterite drill hole and pit sample TiO2 assays
|
6.7
|
Block E2 mineralization
|
Drilling and bulk sampling were conducted on Block E2 in 2021 and 2022. The mineralization in this area proved to be variable in thickness and grade due to the nearby drainage channels. More prospective areas within Block E2 will be drilled in the future to the west and southwest of the 2022 drilling.
Figure 6‑24: Block E2, average laterite TiO2% in drillholes and pit samples
|
6.8
|
Deposit type - Lateritic titanium accumulation
|
During chemical weathering and leaching of rocks, constituent elements are dissolved and transported away in approximate order of their solubility. The alkali (Na2O, K2O) and alkaline earth elements (MgO, CaO) are lost early in the process. Silica is also relatively soluble, but due to its abundance, tends to remain longer in the weathering profile. Aluminum and iron are relatively insoluble, remaining in the profile as the weathering products kaolinite clay and goethite, although kaolinite breaks down slowly as the silica is lost. Least soluble among the common elements is titanium, which gradually increases in relative abundance as the other elements are lost.
At Alto Paraná the lateritic weathering products consist of kaolinite, goethite (hydrated iron oxide), ilmenite and titanomagnetite. The original volcanic glass, plagioclase, pyroxenes, and amphiboles have completely weathered and, in the laterite layer at least, no traces of the original rock textures remain. In places there are some quartz fragments in the laterite, probably originating from quartz in diorite intrusions or silicious vesicle-fill in the basalts.
Within the saprolite layer underlying the laterite, weathering is incomplete and some of the original rock textures remain. This horizon may contain other, less weathered clay minerals (chlorite, smectite, sericite) as well as elevated MgO and CaO.
Figure 6‑25 shows the mass loss in lateritic chemical weathering, starting with high-Ti basalt (left) and finishing with laterite (right). The approximate 60% mass loss due to chemical leaching causes the TiO2 content of the original rock (3%) to rise to about 7.5%.
Figure 6‑25: Mass loss in lateritic chemical weathering
The most common primary titanium mineral is ilmenite, which contains a high percentage of iron in the ferrous state (primary ilmenite contains approximately 50% TiO2 and 50% FeO). During weathering, ilmenite undergoes oxidation, and the iron is progressively converted to the ferric state, requiring changes to the crystal structure and the loss of some of the Fe to maintain a neutral covalent state. Weathered ilmenite often contains complex interior crystal structures such as alternating lamellae or ‘blebs’ of iron-rich and Ti-rich crystal forms, however as noted in Section 6.4, such structures appear to be mostly absent at Alto Paraná with ilmenite grains showing little internal structure.
In basalts with high TiO2 levels such as parts of the Alto Paraná Formation, it is common for some of the TiO2 to be bound up with magnetite, forming titanomagnetite. This mineral also undergoes changes during cooling and weathering, where the magnetite progressively becomes titaniferous hematite (titanomaghemite - see chart below).
Figure 6‑26 is the ternary diagram Fe2+, Fe3+, Ti4+, showing original compositions of Alto Paraná ilmenites (blue squares), titanomagnetites (blue triangles), and the general trends (brown arrows) as the Fe2+ in these minerals is oxidized to Fe3+.
Figure 6‑26: Ternary diagram for weathered mineral compositions at Alto Paraná
Underlying diagram source: Akimoto, Katsura 1959
At Alto Paraná, the grainsize of the source rock is important in determining the amount of recoverable TiO2 in the laterite. The ilmenite and to a lesser extent titanomagnetite particles need to be large enough to be separated, concentrated and processed. The lower grainsize limit for processing is between 38 and 63µm, as grains smaller than this are difficult to separate from the slimes, difficult to clean and are subject to loss during processing and smelting.
Figure 6‑27 shows a thin-section grainsize comparison of gabbro (left) and basalt (right) at the same scale. The gabbro shows black opaque minerals, probably magnetite or ilmenite with grainsizes of 100 to 300µm. For comparison, the basalt is finer grained and is unlikely to contain ilmenite or magnetite coarser than 50µm.
Figure 6‑27: Thin-section grainsize comparison of gabbro (left) and basalt (right)
Figure 6‑28 shows a thin-section photomicrograph of partly weathered Alto Paraná gabbro-diorite from near the Project area. Some plagioclase and pyroxene or amphibole crystals are weathered to chlorite and limonite (labelled clo+lm). Magnetite and ilmenite are black opaques (labelled op). With further weathering the chlorite, plagioclase and any other remaining silicate minerals weather to kaolinite and goethite, occupying only a fraction of the original volume. Other than minor internal changes, the oxides (ilmenite and titanomagnetite) will persist into the final stages of lateritic weathering.
Figure 6‑28: Thin section photomicrograph of partly weathered Alto Paraná gabbro-diorite
Mineralization Deposit/Exploration Model
Titanium-enriched magmas that appeared late in the eruptive cycle of the Alto Paraná Formation in the Paraná Basin were largely deposited in high-titanium basalt flows in the northern portion of the basin (Bacha et al, 2022). In the southern portion of the Paraná Basin, in eastern Paraguay, the older low-titanium basalts predominate. However, the late-stage titanium-rich magmas forced their way through these older basalts forming dikes and sills, which cooled more slowly and therefore have coarser grainsize than the surrounding basalts.
Lateritic weathering then obliterated the earlier rock structures and textures near the surface, removing much of the original volume of the rock. Where the source rock was low-titanium basalt, the resulting barren laterite is red/brown kaolinitic silt/clay with little or no sand-sized particles. Siliceous vesicles are present in the basalt flows and are also preserved in the laterite as silica-cemented lumps and coarse quartz. Ilmenite and titanomagnetite are present in small amounts, but with very fine grainsizes. Whole rock TiO2 values of these basalt-derived laterites are typically less than 6%.
For the laterites developed over high-titanium dikes and sills, however, the lateritic silt/clay contains abundant residual sand-sized ilmenite and titanomagnetite, being the minerals from the original intrusions most resistant to chemical weathering. These accumulations of ilmenite are the primary target of the work in this project. The exploration model is shown schematically in Figure 6‑29.
Under this model of mineralization the following characteristics are expected:
|
●
|
Within the project area, areas with high whole-rock titanium grades are also likely to contain residual ilmenite accumulations. The same cannot be said of areas further north in the Paraná Basin, where high-titanium basalts predominate at the surface, and where dikes and sills are possibly less common. To date, every zone within the Project area with high grade whole-rock titanium that has been tested with the new sample processing procedures has also contained significant residual ilmenite, but this might not prove true everywhere.
|
|
●
|
The quantity of erupted and intruded material associated with the Alto Paraná Formation probably exceeds 1 million km3 (Lindsay et al, 2021). With such large volumes of magma, dikes and sills are likely to extend for long distances and to have significant surface areas, now weathered. The dikes and sills are therefore likely to be extensive of the scale of hundreds of meters to kilometers wide and long.
|
|
●
|
Mineralization will probably be consistent over large areas, reflecting chemical uniformity within individual intrusions. However, some key elements, such as aluminum, magnesium, manganese and vanadium may differ between zones because of differing melt chemistry in the original gabbroic intrusions. It is likely there will be regional variability in some of these elements, even if locally they are consistent. Levels of radioactive elements uranium and thorium are likely to be very low throughout the region.
|
|
●
|
Boundaries between mineralized areas and surrounding basalt-derived laterites are likely to be sharp. However, there are also likely to be boundaries between different generations of dikes and sills, with slightly different chemistry in the source rocks.
|
|
●
|
Although the ratio of ilmenite and titanomagnetite in the melts in the intrusive is likely to have been roughly constant originally, the titanomagnetite grains are typically coarse and euhedral, with well defined crystal forms, indicating they crystallized early in the melt history of the intrusion. The crystals are also relatively dense and if the intrusive bodies were large enough, may have settled in the relatively low-viscosity mafic melt, forming zones enriched with titanomagnetite as well as zones that are depleted. Ilmenite is generally finer grained and less likely to settle. Therefore, the ratio between ilmenite and titanomagnetite might vary locally and regionally.
|
Figure 6‑29: Geological model for the Alto Paraná ilmenite mineralization
[Remainder of page intentionally left blank]
|
7.1
|
Summary of sampling programs
|
The previous owner of the Project, CIC, began reconnaissance sampling for bauxite on the properties in 2008. Anomalous TiO2 in these samples led to the focus of exploration changing to titanium. Systematic exploration began in 2009 with widely spaced, up to 4km apart, shallow and deep pit sampling to delineate the limits of TiO2 anomalies and test for higher grade zones. Shallow pit samples were collected at a depth of one meter and deep pit samples were collected over each meter interval from the surface to the pit bottom, which in most cases was the laterite/saprolite interface.
The early sampling was successful in defining a wide area of anomalous TiO2 and high-grade areas (Figure 7‑1). The grade contours shown on this map were determined from the assays of 555 deep pits and 485 shallow pits excavated up to 2011. Refer to Table 7‑1.
Table 7‑1: Early exploration sampling at Alto Paraná
|
Zone
|
|
Deep Samples
|
|
|
Shallow Samples
|
|
|
Year
|
|
Deep Pits
|
|
|
No. Samples
|
|
|
Gasoline
auger
|
|
|
No. Samples
|
|
|
S Series 1m
Pits
|
|
|
T Series 1m
Hand Auger
|
|
|
2009
|
|
|
186 |
|
|
|
1,486 |
|
|
|
|
|
|
|
|
|
|
|
466 |
|
|
|
|
|
|
2010
|
|
|
332 |
|
|
|
2,664 |
|
|
|
|
|
|
|
|
|
|
|
|
|
|
|
|
|
|
2011
|
|
|
37 |
|
|
|
281 |
|
|
|
|
|
|
|
|
|
|
|
19 |
|
|
|
2,262 |
|
|
2012
|
|
|
|
|
|
|
|
|
|
|
132 |
|
|
|
1,107 |
|
|
|
|
|
|
|
|
|
|
2013
|
|
|
3 |
|
|
|
30 |
|
|
|
|
|
|
|
|
|
|
|
|
|
|
|
|
|
|
Total
|
|
|
558 |
|
|
|
4,461 |
|
|
|
132 |
|
|
|
1,107 |
|
|
|
485 |
|
|
|
2,262 |
|
Exploration work in 2011 was focused on in-fill shallow auger sampling in higher grade zones, especially within the primary 30,000ha area of the MYNM tenements. The MYNM concession was selected for closer spaced sampling based on wide-spaced shallow sampling results in 2009 and 2010, but also because of favorable terms with farmers adjacent to the pilot plant site. Portable XRF readings of samples using a Niton XL3p instrument were taken in the field as a check against the laboratory assays.
Exploration work in 2012 and 2013 consisted of gasoline powered deep auger drilling of 132 holes (2012) and 3 deep pits (2013), with the work concentrated in the MYNM block area closest to the plot plant. All samples were analyzed at ALS Chemex (ALS) in Lima, Peru, using XRF.
In the years since 2013 work has focused on drilling rather than exploration sampling.
Figure 7‑1: TiO2 contours derived from 2008 - 2011 pit and drill sampling
|
7.2
|
Exploration sampling methods
|
Auger sampling was done using either a hand auger or a two-person hand-held power auger. This type of auger allows the collection of high-quality samples of about 30cm in length (the length of the collection cup). All deep auger samples were sampled vertically and extend to the laterite/saprolite interface, typically a 7-8 meter depth. Figure 7‑2 illustrates the hand auger used for the shallow, one meter, sampling and Figure 7‑3 shows the mechanical auger.
For shallow auger holes, material from the last 30cm of the hole is collected and placed in a plastic bag which is sealed and labelled. To avoid contamination, the upper vegetation and organic rich soil zone is first cleared off with a shovel before the hole is started. A Niton spectrometer reading is taken from the bagged material before the sample is sent to ALS Chemex for analysis by multi-element XRF. For the deep auger holes, the same procedure is followed, with a 30cm sample collected at the end of each one meter run.
Figure 7‑2: Auger sampling at one meter
Figure 7‑3: Mechanized auger for drilling deeper auger samples
For the hand dug pits, channel samples are carved from one side of the pit over one meter depth intervals, starting from the bottom and working to the top in order to avoid contamination. At the surface the material hauled up from each one meter channel is mixed and quartered. A quarter of the laterite material is placed in a plastic bag and a Niton hand-held XRF reading is recorded as a back-up analysis.
|
7.3
|
Discussion of exploration results
|
The soil horizon above the laterite commonly contains anomalously high TiO2 values. This is especially evident in soil near the drainage channels, where TiO2 values above 10% are not uncommon. High values in the soil layer generally indicate the presence of nearby or adjacent high-TiO2 laterite layers, but from the available drilling data, it is rare for the underlying or nearby laterite layers themselves to have TiO2 values this high. Of course, shallow sampling is more likely to include soil horizon material than deeper pit, auger or drill samples.
This potentially misleading ‘upgrading’ of TiO2 values in shallow samples taken near the drainage channels needs to be considered when assessing the regional distribution of high-TiO2 laterites. The areas where these anomalous high-TiO2 samples are taken generally have only thin underlying laterite layers and little potential for large Resources.
Conversely, high-grade samples from higher areas such as hill-tops or upper slopes, such as the northern-most sample on Figure 7‑4, take on increased significance. In this figure, the shallow pit samples on Block A shows samples with greater than 10% TiO2 in the whole-rock analyses colored red. All the high-grade samples except the northern-most two, are located within or immediately next to drainage channels (bosques), where secondary concentration of TiO2 is likely. The lateral extent and tonnage potential of these high-grade samples is therefore limited.
Figure 7‑4: Shallow pit samples on Block A. Red points are >10% TiO2 in the whole-rock analyses
To date, there is a general lack of suitable drilling equipment in Paraguay to complete systematic drill testing of exploration targets at Alto Paraná. Auger drilling has been conducted using hand augers and mechanically assisted augers (see Exploration), however, with relatively shallow drillholes and small drilling programs it has been difficult to find drilling contractors who can conduct appropriate Resource assessment drilling.
In 2019/2020 a diamond rig was used to complete systematic drilling over part of the Block A mineralization. The rig gave excellent quality samples, but was relatively slow and expensive. Additionally, the rig caused moderate damage to crops by disturbing large areas near the drill sites, with relatively long stays at each drill site and numerous trips to and from the drill site by the support vehicles.
Figure 7‑5: 2019/2020 Drilling on Block A, showing drilling rig and samples
The following is summarized from Haines (2021). The drill program comprised 49 holes drilled to a target depth of 10 meters. In total, 460.26 meters was drilled vertically using a Longyear 38 drill rig equipped with HQ drill rods and using a split tube system. The drilling contractor was Kimi Perforaciones, a local drilling contractor. Drilling was undertaken in two campaigns in November to December of 2019 and then again in January 2020. Core recovery was excellent, averaging 96%. All drill core was photographed.
Core was placed in covered wood core boxes and removed to secure covered storage at the pilot plant each evening. Core was photographed using a standard jig and camera set-up and geologically logged prior to sampling.
Table 7‑2: Drillhole Details for 2019 and 2020 drilling on Block A
|
No.
|
Hole ID
|
Easting
|
Northing
|
Elev.
|
Start Date
|
Finish Date
|
Final
Depth (m)
|
Core
Recovery
|
| 1 |
AP024C
|
708632 |
7252786 |
281 |
12/11/2019
|
13/11/2019
|
10.09 |
|
91 |
|
| 2 |
AP017D
|
708603 |
7252405 |
279 |
13/11/2019
|
14/11/2019
|
10.5 |
|
97 |
|
| 3 |
AP018
|
708992 |
7252402 |
290 |
15/11/2019
|
15/11/2019
|
10.08 |
|
94 |
|
| 4 |
AP010
|
708599 |
7252000 |
247 |
16/11/2019
|
16/11/2019
|
8.91 |
|
98 |
|
| 5 |
AP011A
|
708998 |
7252000 |
291 |
17/11/2019
|
17/11/2019
|
10.05 |
|
99 |
|
| 6 |
AP020
|
709798 |
7252393 |
280 |
18/11/2019
|
18/11/2019
|
10 |
|
98 |
|
| 7 |
AP027
|
709804 |
7252797 |
319 |
19/11/2019
|
19/11/2019
|
10 |
|
99 |
|
| 8 |
AP026
|
709400 |
7252798 |
286 |
20/11/2019
|
25/11/2019
|
10 |
|
97 |
|
| 9 |
AP036
|
709847 |
7254386 |
263 |
19/12/2019
|
20/12/2019
|
10 |
|
93 |
|
| 10 |
AP09
|
710245 |
7254044 |
269 |
20/12/2019
|
22/12/2019
|
10 |
|
100 |
|
| 11 |
AP03
|
710144 |
7254356 |
270 |
20/12/2019
|
22/12/2019
|
9.16 |
|
85 |
|
| 12 |
AP033
|
709400 |
7253199 |
293 |
25/12/2019
|
28/12/2019
|
10.15 |
|
98 |
|
| 13 |
AP016
|
710161 |
7253568 |
258 |
27/12/2019
|
27/12/2019
|
10 |
|
99 |
|
| 14 |
AP041
|
709800 |
7253603 |
282 |
27/12/2019
|
28/12/2019
|
5.77 |
|
91 |
|
| 15 |
AP023
|
710202 |
7253198 |
267 |
27/12/2019
|
28/12/2019
|
10 |
|
99 |
|
| 16 |
AP034
|
709800 |
7253193 |
291 |
28/12/2019
|
3/01/2020
|
9.4 |
|
98 |
|
| 17 |
AP019
|
709401 |
7252400 |
293 |
4/01/2020
|
4/01/2020
|
10 |
|
95 |
|
| 18 |
AP048
|
709800 |
7254000 |
266 |
4/01/2020
|
4/01/2020
|
10 |
|
98 |
|
| 19 |
AP040
|
709403 |
7253598 |
297 |
5/01/2020
|
5/01/2020
|
10 |
|
95 |
|
| 20 |
AP044
|
710198 |
7252002 |
272 |
5/01/2020
|
5/01/2020
|
9.7 |
|
98 |
|
| 21 |
AP025
|
708999 |
7252799 |
294 |
6/01/2020
|
6/01/2020
|
10 |
|
97 |
|
| 22 |
AP043
|
710198 |
7252398 |
263 |
6/01/2020
|
6/01/2020
|
9.7 |
|
97 |
|
| 23 |
AP046
|
709000 |
7254000 |
264 |
9/01/2020
|
9/01/2020
|
10.2 |
|
98 |
|
| 24 |
AP049
|
710199 |
7252799 |
270 |
9/01/2020
|
9/01/2020
|
10.05 |
|
99 |
|
| 25 |
AP030
|
709001 |
7254397 |
283 |
10/01/2020
|
10/01/2020
|
10 |
|
98 |
|
| 26 |
AP012
|
709402 |
7252001 |
296 |
10/01/2020
|
10/01/2020
|
10 |
|
95 |
|
| 27 |
AP05
|
709378 |
7251628 |
286 |
11/01/2020
|
11/01/2020
|
10 |
|
98 |
|
| 28 |
AP037
|
709399 |
7254408 |
291 |
11/01/2020
|
11/01/2020
|
10 |
|
96 |
|
| 29 |
AP04
|
709000 |
7251601 |
276 |
12/01/2020
|
13/01/2020
|
10.1 |
|
98 |
|
| 30 |
AP047
|
709356 |
7254023 |
282 |
12/01/2020
|
13/01/2020
|
7.2 |
|
98 |
|
| 31 |
AP013
|
709812 |
7251991 |
272 |
18/01/2020
|
18/01/2020
|
10.05 |
|
95 |
|
| 32 |
AP039
|
708966 |
7251218 |
262 |
18/01/2020
|
18/01/2020
|
10 |
|
98 |
|
| 33 |
AP031
|
709401 |
7251201 |
267 |
18/01/2020
|
18/01/2020
|
3.03 |
|
93 |
|
| 34 |
AP06
|
709798 |
7251597 |
270 |
18/01/2020
|
18/01/2020
|
5.2 |
|
98 |
|
| 35 |
AP045
|
707802 |
7251206 |
250 |
19/01/2020
|
19/01/2020
|
10 |
|
90 |
|
| 36 |
AP07
|
707398 |
7251600 |
297 |
19/01/2020
|
19/01/2020
|
10 |
|
89 |
|
| 37 |
AP08
|
707800 |
7251999 |
280 |
20/01/2020
|
20/01/2020
|
10.35 |
|
98 |
|
| 38 |
AP01
|
707800 |
7251597 |
299 |
20/01/2020
|
20/01/2020
|
10 |
|
95 |
|
| 39 |
AP038
|
708198 |
7251198 |
264 |
20/01/2020
|
20/01/2020
|
10 |
|
97 |
|
| 40 |
AP02
|
708197 |
7251598 |
266 |
20/01/2020
|
20/01/2020
|
6 |
|
97 |
|
| 41 |
AP014
|
707402 |
7252002 |
339 |
21/01/2020
|
21/01/2020
|
10.1 |
|
92 |
|
| 42 |
AP015
|
707800 |
7252399 |
271 |
21/01/2020
|
21/01/2020
|
10.1 |
|
97 |
|
| 43 |
AP021
|
707440 |
7252361 |
331 |
21/01/2020
|
21/01/2020
|
10 |
|
99 |
|
| 44 |
AP022
|
707855 |
7252757 |
270 |
21/01/2020
|
21/01/2020
|
10 |
|
98 |
|
| 45 |
AP035
|
707397 |
7253201 |
272 |
1/23/2020
|
1/23/2020
|
9.65 |
|
86 |
|
| 46 |
AP042
|
707400 |
7253599 |
260 |
1/23/2020
|
1/23/2020
|
4.72 |
|
95 |
|
| 47 |
AP028
|
707403 |
7252803 |
307 |
1/23/2020
|
1/23/2020
|
10 |
|
98 |
|
| 48 |
AP029
|
707803 |
7253200 |
263 |
1/23/2020
|
1/23/2020
|
10 |
|
96 |
|
| 49 |
AP032
|
708869 |
7253179 |
298 |
1/24/2020
|
1/24/2020
|
10 |
|
95 |
|
Figure 7‑6: Drillhole plan from 2019/2020 drilling on Block A (from Haines, 2021)
|
7.4.2
|
Block E1 & E2 Drilling 2021/22
|
Direct push-coring equipment was acquired from GeoProbe in 2021 to improve drilling rates and potentially cause less damage in the cropping areas. The direct-push drilling and sampling equipment requires a drilling rig with a hammer to push the coring tool down into the soil, and then core is retrieved from within the outer drill pipes using a split-pipe system that sits behind the cutting tool/bit. The principal advantage of this equipment is that it can be utilized on a wide range of drilling rigs, including small water drilling rigs that are relatively common throughout the region.
Figure 7‑7: Geoprobe direct-push coring and sampling tool used in 2021/22 drilling (left) and schematic diagram showing the operation of the tool (right)
Figure 7‑8: 2022 drilling: Geoprobe sampling tool being pushed down with an air-hammer (left) and the recovered sample tubes containing core (right)
The direct-push system uses 3.25 inch (83mm) outer piping and cuts an inner core of about 50mm diameter. When drilling starts there is some edge resistance as the central core is pushed into the system, leading to some recovery loss. At depth, the opposite problem can occur where the downward pressure of the cutting tool and the increased constraining pressure and plasticity of the surrounding ground formation causes more material to be squeezed up into the sampling tool, generating greater than 100% recovery.
While the sample recovery is not as high as the diamond drilling rig, the drilling process is much faster, the rig causes less damage to crops and compared to percussion or auger drilling, there is no possibility of the sample being contaminated with material from further up the drillhole.
Forty two drillholes were completed in 2021/22 for a total of 283.7 meters. Thirty drillholes were completed on Block E1 and twelve on Block E2. A map of the drillholes on Block E1 is shown in Figure 7‑9 below. Figure 7‑10 shows drilling on Block E2.
Figure 7‑9: Block E1 drillhole location plan: 2022 drillholes
Figure 7‑10: 2021/22 drilling on Block E2, also showing bulk sample locations BSE201, BSE202 & BSE204
[Remainder of page intentionally left blank]
|
8.0
|
Sample preparation, analyses and security
|
|
8.1
|
Block A Drilling 2019 and 2020 sample preparation
|
Sampling for the 2019-2020 drill program consisted of splitting the core in half and sampling at one meter intervals for the full length of the core. Duplicate and check samples were taken as ¼ core samples from the half core. All samples were placed in plastic sample bags with the sample number recorded on the bag. A sample tag was stapled to the inside of the sample bag and the bag was folded over and stapled to ensure the sample tag remained clean and visible.
The main samples and duplicate samples were shipped to ALS Peru for analysis. Check samples were shipped to ALS Vancouver for analysis. Both ALS Peru and ALS Vancouver are ISO17025 certified laboratories.
|
8.2
|
Block A 2023 sample preparation
|
In 2023 recoverable TiO2, ilmenite and titanomagnetite grades were measured in samples from the 2020 drilling program. Samples were taken from 47 of the ‘AP’ drillholes completed on Block A (see Section 7.4.1). A single sample was taken from each drillhole from a depth of 0.5 meters below surface to the laterite/saprolite interface, where the split was made by cutting the available sample material in half. Generally, this was the equivalent of ¼ core as most sample intervals had half-core taken for whole rock analyses in 2020.
The samples were further prepared at the pilot plant site in Alto Paraná to reduce shipping volumes using the procedure in Figure 8‑1 and described in the steps below:
Figure 8‑1: Feed Preparation procedure in Paraguay
|
●
|
Samples were oven-dried to determine moisture content.
|
|
●
|
Samples were scrubbed using a two-stage scrubbing process:
|
| |
♦ |
The dried sample was mixed with water and small basalt stones, approximately 5mm, before being mixed in a cement mixer for 10 minutes.
|
| |
♦ |
After screening out the rocks, the sample was scrubbed a second time with coarse quartz river sand, approximately 2mm, for 20 minutes.
|
| |
♦ |
The resulting slurry was then screened at 2mm to remove the sand scrubbing media, 1mm to remove the oversize fraction in the sample, and 45µm to remove the slimes. During screening approximately 80% of the sample volume was reduced, being the slimes fraction and the +1mm oversize fraction.
|
|
●
|
The scrubbed ‘concentrate’ sand was then dried and air-freighted to LDE in South Africa for further analyses.
|
|
8.3
|
Block E1 & E2 Drilling 2021 & 2022 sample preparation
|
Drill samples were retrieved from the sampling tool at the drilling rig inside plastic sleeves (see Figure 7‑8), sealed and stored in wooden boxes. After being moved back to the pilot plant, the core was logged and samples taken by cutting segments using a blade or chisel. Samples were taken nominally at 1 meter intervals, but with the first sample at the top of the drillhole split at 0.5 meter and sample breaks at any changes of geology. Samples were packed in plastic sample bags with sample tags as per the methods used for Block A samples.
At ALS Peru samples were dried and split using their rotary splitter and 200 gram nominal sub-samples were prepared for analysis at IHC Mining in (IHC) Australia, with the remainder of the material being analyzed with XRF at ALS.
The diamond drilling rig used in 2019/2020 achieved excellent sample recoveries, averaging 96%. The Geoprobe push-sampling tool used in 2021/22 averaged 75%, with average recoveries increasing with depth (Figure 8‑2). It is possible that the air voids discussed in Section 11.3 also play a role in sample recovery. Air voids encountered in diamond drilling will generally be preserved as voids in the core, whereas the push-sampling tool is more likely to compress them down during the sampling process.
Although the push-sampling tool recoveries were lower than previous diamond drilling, in the opinion of the QP, the samples are sufficiently representative of the mineralization for Resource modelling. There is relatively little variability down-hole, as observed with the sample results and the variography Section 11.4, and with samples retrieved every 1 meter or 1.5 meters, the mineralized interval is being sampled many times with each drillhole.
Figure 8‑2: 2022 Drill sample recovery vs depth
|
8.5
|
Block A 2020 analyses
|
The sample preparation and assay methods used by both ALS Peru and ALS Vancouver for drill samples collected in 2019/2020 is illustrated in Figure 8‑3.
Figure 8‑3: Sample preparation at ALS laboratories, 2020 drilling
It is noteworthy that the +2mm and -53µm (-270 mesh) fractions were not included in the ALS XRF analyses. Also, being fractions derived by dry sieving, the different size fractions are highly variable. The coarse +2mm fraction averages 16% across the samples, whereas equivalent wet-sieved samples from the 2022 drilling averaged 1.8% weight percent greater than 1mm. For the fine fraction (ALS screened at 53µm) the dry sieved samples averaged only 9.4%, whereas the wet sieved 2022 samples (IHC screened at 45µm) averaged 82% by weight.
|
8.6
|
Block A 2023 analyses
|
Scrubbed sand fractions taken from the 2020 Block A drilling program were processed at LDE using the procedure shown in Figure 8‑4 and the steps described below:
Figure 8‑4: LDE Sample preparation process 2023
|
●
|
Drying of sample to measure moisture (a repeat of the drying in Paraguay);
|
|
●
|
Attritioning and then wet screening at 1mm and 45µm to produce ‘clean sand’;
|
|
●
|
Heavy liquid separation of the sand to produce a heavy mineral fraction;
|
|
●
|
Magnetic separation of the heavy mineral into four fractions using a 2-pass (non-mag retreat) process:
|
| |
♦ |
Mag1, the most magnetic material separated using 0.05A current on the Carpco magnetic separator;
|
| |
♦ |
Mag2, weakly magnetic material separated using 0.5A combined with the Mag3, very weakly magnetic material separated at 1.0A; and
|
|
●
|
The Mag2 and Mag3 fractions, once weighed, were recombined to make a single Mag2 fraction; and
|
|
●
|
The Mag1 and Mag2 fractions were then analyzed with XRF.
|
|
8.7
|
Block E1/E2 2022 analyses
|
Whole rock XRF analyses were conducted on samples collected on Blocks E1 and E2 in 2021/22 at ALS Peru to maintain ‘continuity’ with previous work, although the sample preparation at ALS was simplified to exclude dry screening and screening steps applied in 2020. Samples were dried, crushed to -2mm (minimum 70% of the sample passing 2mm screen) and split using their rotary splitter. A nominal sub-sample of 200g was forwarded to IHC for further processing and a split from the remainder of the sample was pulverized and analyzed with XRF, following previous programs at ALS.
Samples were forwarded to IHC because wet screening was not possible at ALS Peru, or any commercial laboratory UEC contacted in South America. Numerous Australian and South African laboratories are set up to analyze heavy mineral samples, including IHC and LDE. Both laboratories were used to process and analyze Alto Paraná drill samples and bulk samples in 2022.
Figure 8‑5: Drill sample process flowsheet at ALS Peru, 2022
The drill sample splits forwarded to IHC were processed according to the flowsheet below to generate Heavy Mineral (HM) concentrate, as well as determining oversize (+1mm) and slimes (minus 45µm). Figure 8‑6 shows the sample preparation, screening and heavy liquid separation at IHC. Samples were screened at 45µm to match processing results from other work.
Figure 8‑6: Sample preparation process at IHC
Once the HM fractions were obtained, they were composited together by geology units, mostly within single drillholes. The exception was saprolite composites from ‘basement’ under the mineralized laterite layer, which were generally composited using two adjacent drillholes. These HM composites were then magnetically separated into three fractions with the magnetic fractions weighed and analyzed by XRF, according to the flowsheet in Figure 8‑7.
Figure 8‑7: Stage 2 of IHC drill sample processing
The XRF values of the magnetic fractions can be used to estimate product quality directly, as well as estimate the mineralogy of the fractions. Magnetic separation was conducted with a Carpco magnetic separator which varies the magnetic strength of the magnet by changing the current in an electro-magnet. The Mag1 fraction was separated by setting the magnet to a low strength using a current of 0.05A. The Mag2 fraction was then separated from the Non-mag using a current of 1.0A. In processing some samples, the Mag2 was further fractionated by using 0.5A first and then 1.0A to create ‘Mag2A’ and ‘Mag2B’ fractions. For the XRF analyses however, the Mag2A and Mag2B fractions were generally re-combined to produce a single Mag2 fraction. For all magnetic separations, the concentrate is processed twice, with the non-magnetic fraction passed through a second time to maximize recovery of the magnetic grains.
|
8.8
|
Discussion of laboratory methods for drill samples
|
The sample process testwork conducted as part of this study has allowed the development of a laboratory process for Alto Paraná drill samples that:
|
●
|
provides the necessary grade data for Resource modelling and subsequent production scheduling;
|
|
●
|
gives credible results that are repeatable by any sufficiently equipped and skilled laboratory.
|
Key components of the revised drill sample process are:
|
●
|
Careful measurement of moisture content of the sample, using ‘gentle’ drying at 60–80°C, typically overnight or until the dry weight of the sample stabilizes. Wet screening of the sample at 45µm and 1mm, discarding the –45µm fraction but drying and retaining any +1mm fraction. Photographs of the +1mm are useful for geological logging. The process to attrition wet sand without drying is described below.
|
|
●
|
Attritioning of the sand fraction until it is predominantly black in color removes clay coatings. This typically takes 10 to 20 minutes in a benchtop ‘attritioning unit’. Continue attritioning, washing and screening at 45µm until the wash water stops being red/brown in color and the sand fraction is predominantly black.
|
|
●
|
Dry and weigh the attritioned sand.
|
|
●
|
Heavy liquid separation of the sand to remove quartz and clay-cemented lumps, concentrating ilmenite and titanomagnetite as ‘heavy mineral’. TBE and LST are acceptable heavy liquids to use.
|
|
●
|
Magnetic separation of the heavy mineral into three fractions: strongly magnetic Mag1, weakly to moderately magnetic Mag2, and non-magnetic ‘Non-Mag’. A Carpco magnetic separator is normally used for this, with electromagnet current settings at 0.05A and 1.0A to separate the three fractions.
|
|
●
|
XRF analyses of the HM, Mag1 and Mag2 fractions. The Non-Mag fraction is typically too small to generate a sample for XRF.
|
Using the weight percent and XRF analyses of the Mag1 and Mag2 fractions it is possible to estimate the ilmenite and titanomagnetite content of the mineralization.
Assuming the combined SiO2 and Al2O3 analysis is less than 3%, then the resulting Alto Paraná HM concentrate will consist of a mixture of the minerals ilmenite, titanomagnetite and possibly some other iron oxide minerals (magnetite, hematite, goethite). The TiO2 grade can be used to estimate the ilmenite percentage of the mixture, using the formula:
Ilmenite% of the fraction = (4 x TiO2%) - 1
‘Ilmenite’ in this case is the ‘pure’ mineral with a TiO2 content of 50%.
For example, if a Mag1 concentrate has TiO2 value of 29.5%, then the ilmenite percentage in that fraction is (4 x 29.5%) - 1 = 18% with the remaining 82% being titanomagnetite.
XRF results for the Mag1 and Mag2 fractions should be checked to ensure that the combined SiO2 and Al2O3 values are less than about 3%. Higher values are typically observed in samples that were insufficiently attritioned or samples not subjected to heavy mineral separation.
If other low titanium dioxide minerals are present in the concentrate then the formula above will under-state the ilmenite content. Generally, however, these other iron oxide minerals are found in the Mag1 fractions, where ilmenite content is expected to be low in any case.
Drill core samples obtained in the 2019/20 and 2021/22 drill programs were securely stored at the pilot plant until shipped by courier to ALS Peru in Lima or ALS in Vancouver. Samples were transported to Asunción by UEC staff and shipped by international courier to Lima or Vancouver. Similarly, the samples transported from ALS Peru to IHC were shipped by international courier with parcel weights carefully recorded and checked.
[Remainder of page intentionally left blank]
|
9.1
|
QA/QC sampling overview
|
Three types of QA/QC sampling were employed in the 2021/22 drilling program:
|
●
|
blind duplicates (blind to the target laboratory)
|
|
●
|
laboratory duplicates and standards
|
The results of the QA/QC sampling are generally good and show no systematic errors or biases in the sample results.
There were only two drillholes on the area tested on Block E1 prior to the most recent 2021/22 drilling. Drillholes PH287 and PH288 were drilled in 2010 and have TiO2 values for the entire drillhole. Both drillholes were redrilled in 2021/22, although there are slight differences in the depth intervals sampled. Also, for some intervals in the new drilling there was insufficient material remaining after IHC sample splits were extracted to allow whole rock XRF analyses. IHC sample splits were given priority when sample weights were low.
From the original 18 drill samples taken from 2010 in this area, nine have close equivalent samples with similar depth intervals and TiO2 XRF analyses. Block E1 Redrill comparison between 2010 results and 2021/22 results are tabulated in Table 9‑1 below. Comparable depth intervals are highlighted.
Table 9‑1: Block E1 Redrill comparison between 2010 results and 2021/22 results
Figure 9‑1: Scatter plot showing comparison of whole-rock TiO2 grades of redrilled Block E1 samples
Although the low number of earlier drill samples means there were only limited opportunities to collect twinned drill samples, the new sample results show a strong (96%) correlation with the earlier results, and no apparent bias.
|
9.3
|
Blind duplicate samples
|
The availability of a rotary splitter at ALS Peru meant that good quality blind duplicate samples for IHC could be easily generated. Three drillholes were chosen to be presented to IHC as new drillholes, whereas they were in fact duplicate splits of earlier drillholes. The blind duplicates were analyzed for HM, slimes and oversize at IHC. However, for the second stage of IHC’s analysis, the HM derived from these intervals was added to the original mineral concentrate composites to give greater volumes and better results for the magnetic separation and XRF analyses.
Figure 9‑2: Scatter plot of blind duplicate results for the -45µm ‘slimes’ fraction
In the scatter plot for the blind duplicate results for the -45µm slimes, the most voluminous fraction as can be seen in Figure 9‑2, correlation is generally good, However, two points A and B are highlighted and warrant further discussion.
|
●
|
The original analysis for Point A (sample 170502) gave a slimes analysis of 92%, whereas the duplicate (170784) was 84%. Sample 170502 was the first sample of the main Block E1 sample batch and the spurious result almost certainly reflects too much material getting past the sieve, possibly due to it being worn or perhaps having small holes. Another possibility is that some of the +45µm material spilled out of the fine sieve during screening, as can happen if the operator slips and there is no container to catch spillage.
|
|
●
|
Very few of the main dataset samples have greater than 90% slimes and those that do are all from low-grade zones. Therefore, for this particular sample, the original sample has been ignored and replaced by the duplicate sample result, which correlates well with adjacent samples. If a re-assay was not already to hand, the spurious initial results for this sample would have justified re-analysis.
|
|
●
|
In sample B the difference between the original and repeat result is caused by a high proportion of oversize (+1mm) (see Figure 9‑3). Due to the grainsize of this coarse material it is inherently more variable at the volumes being analyzed (200g nominal sample size). The sample also has a relatively high HM grade, so in combination, the remaining slimes volume has been significantly affected by variations in the oversize and HM.
|
Figure 9‑3: Scatter plot showing +1mm ‘oversize’ results for blind duplicates
Figure 9‑4: Scatter plot showing HM grades of blind duplicate samples
The Figure 9‑4 scatter plot shows the HM percent weight results for blind duplicate samples, with marked points A and B as per previous plots.
As explained above, variability in points A and B can be explained by the differences in the slimes fraction for sample A and the oversize fraction in sample B. Overall the correlation coefficient between the original sample and the duplicate for HM is 84%. If the two samples with readily explainable variations are excluded, the correlation coefficient rises to 97%.
Of the 335 samples submitted to IHC, 24 were blind duplicates, representing 7.7% of the total. One of these 24 samples (A in plots above) showed that for the first sample treated in the main E1 sample batch the fine screening was not done properly. However, it is apparent the problem was resolved quickly (although the sample should probably have been re-analyzed). Only one other sample showed significant differences between the primary and repeat analyses (B) and this is readily explainable by the high quantity of oversize present in that sample. Overall, the blind duplicates gave good correlations and there is no apparent bias evident between samples treated early in the batch and those treated at the end.
|
9.4
|
Laboratory duplicates and standards
|
IHC conducted 15 routine laboratory duplicates on the 335 samples received. The results are plotted below and show good correlations. As discussed above, the relatively coarse grainsize of the +1mm ‘oversize’ fraction means that a moderate amount of scatter can be expected with this analysis. The correlation coefficient between original and repeat HM analyses is 99% and no bias is evident. Comparisons are shown in Figure 9‑5, Figure 9‑6 and Figure 9‑7.
Figure 9‑5: -45µm slimes analyses for IHC internal laboratory repeats
Figure 9‑6: -+1mm oversize analyses for IHC internal laboratory repeats
Figure 9‑7: Heavy mineral grade for IHC internal laboratory repeats
Repeat sampling of the drillholes, including sample processing at different laboratories, show that the sampling methods and the analysis techniques applied give consistent results. Whole rock TiO2 measured in the new repeat drillholes gave excellent correlation with earlier results. The most important new analysis, however, is the determination of HM, being the percentage of the sample that is coarser than 45µm and is denser than 2.85 specific gravity (SG). Blind duplicates and systematic laboratory duplicates show that the HM analyses are very consistent with excellent correlation coefficients and no apparent bias.
|
9.6
|
Verification of data sources
|
Spatial data
Drillhole locations have been acquired using GPS technology. The X and Y positions in these instances are reliable, perhaps +/- 10 meters, but the recorded GPS elevation values are much more variable. As will be discussed in Section 11.2, the elevation value is relatively unimportant in this style of mineralization because the laterite layer is ‘draped’ over undulating terrain. In order to have consistent elevations across the Project area, drillhole collars were positioned with satellite radar elevations (DEM) derived from the Copernicus GLO-30 dataset based on approximately 30 meters spaced spot heights. The GLO-30 DEM elevation values are generally smooth across cleared agricultural areas of the Project, but can be variable or erratic in vegetated areas, where some elevation values are apparently from the tops of trees and others are from the natural ground surface. This variability does not affect the Resource areas, however, which are entirely located within cleared agricultural areas.
GPS coordinates for early drillholes were recorded using the Chua Astro datum, presumably to match the coordinates on the topographic maps of the time. More recently, the WGS84 datum has been used, being a more widely used international standard. Drillhole and sample coordinates that were originally recorded with the Chua Astro datum were translated into WGS84 (UTM zone 21S, EPSG: 32721) coordinates so that all coordinates are in the same system.
Sample analyses
Most of the important sample analyses for the Indicated Resources have been received directly as Excel spreadsheets from the laboratories who conducted the analyses. Approximately half of the results used for the Block A Indicated Resource estimation were sourced from an Exxaro report ‘Alto Parana: PFS Drill Samples’ (February 2014). The results were presented as a table in the report which, for the current study, was scanned and the information extracted using optical character recognition software (OCR). The results were carefully checked against the original document and all OCR errors corrected. Although it is possible some errors were missed, in general OCR errors were very obvious (for example: ‘O’ instead of ‘0’ – causing the associated number to be treated as text). Additionally, any apparently anomalous values were immediately checked against the original document.
The sample analyses used in the Inferred Resource estimations are largely whole rock titanium analyses obtained between 2009 and 2014. The samples were subject to QA/QC processes at the time, giving good results. Some of the original laboratory reports have been preserved and these were checked against the values stored in spreadsheets, with no inconsistencies. For the current study all early sample results were merged into an Access database with data integrity constraints applied. In the process of this database merger a few minor errors were detected in previous work, but these have now been superseded with new estimates using the S-K 1300 framework.
Geology interpretation
The geology of the Project area is generally very simple, however there have been some differences between the interpretations of different geologists, especially regarding the lower boundary of the laterite horizon. Because the core material has been stored and only partially sampled during the initial drilling programs, it is generally straight-forward to re-interpret the laterite boundaries from the remaining core material. The main exception to this is the older samples in Block A, where Tronox took all the available core material for analysis in 2012.
For all recent sampling work, including all the new analyses for the Indicated Resources, the same geological staff have been involved and the interpretations are consistent. The older Tronox data for Block A is consistent with the latest interpretations (see for instance, Table 9‑2).
|
9.7
|
Visual data verification: Block E1 mineralization
|
Key information regarding the mineralization at Block E1 has been compiled and is presented in the graphs and cross sections below. If any anomalies exist in the data, they will be evident in these plots.
Each drillhole contains a number of sampled intervals, typically 6 to 8, through the laterite layer where the most important grades analyzed are ‘whole rock titanium’ and ‘heavy mineral’. The graphs below show downhole averages, minima and maxima for drillholes across the northern-most section line of E1.
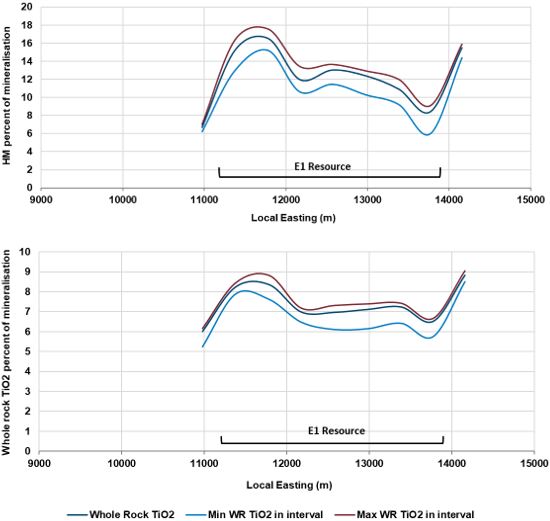
Figure 9‑8: Comparison of average values of whole rock TiO2 and heavy mineral (HM) with minimum and maximum values from individual samples within the same intervals, northern-most drill traverse on E1
The graphs show that results for the individual sample intervals do not deviate far from the average values for each of the laterite intersections. The minimum values for the intervals often lie at the top of the profile, directly under the topsoil, and these typically show the greatest difference to the interval average values.
The results are consistent with the variography, as discussed Section 11.4, where a low nugget effect is evident (for example a low amount of localized ‘scatter’ in the results), a relatively high vertical range of about 40 meters is interpreted, for example grades do not change much in the vertical direction, and a horizontal range of 1,100 meters is interpreted, for example 1,100 meters horizontal ‘zone of influence’ around each sample – well beyond the drill hole spacing of 400 meters.
Having noted the relative consistency of the individual analyses down through the laterite intervals, the following graphs and sections show average values for the laterite intervals through the three most important sections across the E1 Resource. A plan view of the drillholes, showing local grid coordinates and the E1 Resource boundary is shown in Figure 9‑9.
Figure 9‑9: Plan view of E1 drillholes and Resource, showing the local grid section lines 28400N, 28000N and 27600N used for visual verification
Figure 9‑10: Block E1 Local grid 27600N: visual verification of key drilling data: elevation, thickness and grade values
Figure 9‑11: Block E1 Local grid 28000N visual verification of key drilling data
Figure 9‑12: Block E1 Local Grid 28400N visual verification of key drilling data
Discussion regarding Block E1 visual verification plots
The plots show three sections across the main Resource zone for Block E1. The first plot for each group shows the relative elevation of the laterite zones. The second plot shows the thickness of the laterite layer. The third plot shows the average percentage of sand, heavy mineral and ilmenite and smelter feed for each laterite interval across the sections. The fourth plot show the average titanium grades for the laterite layer: the whole rock TiO2 grade, the recoverable titanium (the TiO2 in the HM) and the titanium contained in ilmenite.
The E1 Resource zone has relatively high levels of titanomagnetite compared to ilmenite. This is evident on the HM grade plots, where the gap between ilmenite and HM values on the plot is predominantly titanomagnetite.
Within the boundaries of the Resource, the grades are very consistent, especially the ilmenite grade, which corresponds most closely to the grade of smelter feed in the mineralization.
Drillhole APE1003 in the middle section (13000E on the 28000N section) shows interesting results. The whole rock titanium grade (7.2% TiO2) is lower than the surrounding drillholes (8.2% and 8.3% TiO2). Early surface sampling results indicated the likely presence of a low to medium grade zone in this area, so this result was expected. The heavy mineral analyses confirmed that the laterite horizon at APE1003 had significantly lower HM grades (9.0% HM) compared to the adjacent drillholes (15.7% and 17% HM). However, when the TiO2 grade of the HM was determined, it became evident that the ilmenite grade was much the same as in the adjacent drillholes with an ilmenite grade of 4.0% compared to the adjacent drillholes with 3.7% and 4.7%. The reason APE1003 contains more than expected ilmenite is the proportion of titanomagnetite in the laterite is much lower than in the surrounding drillholes. Generally, within the E1 Resource zone, the ratio of titanomagnetite to ilmenite is 1.7 to 1. However, in APE1003 the titanomagnetite ratio to ilmenite is close to 1:1.
Given the coarse grainsize of the titanomagnetite, it is likely to have crystallized early in the melt history of the source intrusions. If the igneous melts continued moving after it crystallized, or if the titanomagnetite settled in the melt chamber, there would be zones within these intrusions that are enriched in titanomagnetite and other zones where it is depleted. The laterite intersected in APE1003 appears to overlay a zone that is relatively depleted in titanomagnetite. Therefore, despite the relatively low whole-rock titanium and HM grades at this location, the relatively ‘normal’ ilmenite grade makes it equally as valuable as the surrounding zones.
Similar characteristics can be seen in APE1023 (the second eastern most drillhole of the 28400N section), where the titanomagnetite ratio to ilmenite is lower than the surrounding zones. In APE1019 (the eastern most drillhole on the 27600N section and outside the Resource boundary), the low whole rock titanium grade of 5.4% and low HM grade of 5.0% do not reflect the ilmenite grade of 3.0% - which is surprisingly high.
In general, however, grades are consistent across the Resource zone, despite being drilled at 400 meter spacings. The assay grades are consistent within individual drillhole intercepts through the mineralized zone, as well as between adjacent drillholes. In infrequent instances where some assay results are different to those of adjacent drillholes, the most important grades (ilmenite% of mineralization) remain relatively constant.
| 9.8 |
Visual data verification: Block A mineralization
|
In the same manner as the last section, key information for the mineralization on Block A has been collated and plotted for selected N-S sections. The Figure 9‑13 shows the five sections plotted on the following figures.
Figure 9‑13: Block A drillholes and Indicated Resource boundary, showing the N-S section lines used for visual data verification 707400E – 710100E
Figure 9‑14: Block A Section 707400E visual verification of key drilling data (looking west)
Figure 9‑15: Block A Section 707800E visual verification of key drilling data (looking west)
Figure 9‑16: Block A Section 708600E visual verification of key drilling data
Figure 9‑17: Block A Section 709400E visual verification of key drilling data
Figure 9‑18: Block A Section 710100E visual verification of key drilling data
Discussion regarding Block A visual verification plots
Approximately half of the data in at Block A was derived by Tronox in their studies of 2011-2013. Their methods are very similar, but not identical to those applied with more recent drilling samples. The best direct comparison is with two drillholes sited nine meters apart on Section 7252800N: PH612 and AP027. PH612 was drilled in January 2012 and analyzed by Tronox later that year. AP027 was drilled in November 2019 and then resampled and assayed using the current sample processing techniques in 2022. Although the drill results for the two drillholes were compiled approximately a decade apart, the results are very similar.
Table 9‑2: Comparison of key drilling results for two adjacent drillholes: PH612 (from 2012) and AP027 (drilled 2019, analyzed in 2022)
|
Hole ID
|
PH612
|
AP027
|
|
Easting
|
709796
|
709804
|
|
Laterite thickness (m)
|
10
|
10
|
|
Average recoverable TiO2%
|
1.81
|
1.64
|
|
Average whole rock TiO2%
|
5.55
|
5.49
|
|
Average sand%
|
5.8
|
5.6
|
|
Average HM%
|
4.7
|
4.3
|
|
TiO2% of HM
|
38.2%
|
38.0%
|
|
Estimated ilmenite % of HM
|
54%
|
53%
|
|
Estimated ilmenite% of ROM
|
2.6
|
2.6
|
|
Estimated ilmenite TiO2% of ROM
|
1.3
|
1.3
|
The visual verification plots show that where the low-grade section is intersected on 7252400N and then again on 7252800N, the ilmenite grades are close to the 2% Resource cut-off value. Interestingly, these zones have a higher ilmenite to titanomagnetite ratio, as seen by HM TiO2 values of 37-39%, resulting in ilmenite concentrations in the ore that are only marginally lower than the neighboring Resource zones.
Compared to the Block E1 mineralization, there is more variability at Block A. This is partly due to the presence of low-grade mineralization in and around the zones that have been tested to date. However, within the Resource boundaries, the results are moderately consistent.
The ‘Sawtooth’ patterns in some of the Block A sections above are due to alternating drillholes from different sampling programs, where different geologists have interpreted the base of laterite horizon using slightly different standards, affecting the laterite thickness, see the laterite thickness plot in Figure 9-17, or different laboratory processes have been applied to the drill samples. These patterns are also present in areas where there is apparently above average variability in the grades. Refer to the grades in Figure 9-16, possibly linked to variable basement types in this area.
A major controlling factor of the mineralization at Block A is the erosion channels or ‘bosques’. It is likely that the mineralization was continuous across these zones in the past, but erosion has stripped the laterite, effectively removing a significant portion of the good mineralization in this area.
Within the Indicated Resource boundary there are ‘very well mineralized’ drillholes where grades are significantly higher than the surrounding drillholes. In the main Resource area, these drillholes are apparently scattered however the western-most drillholes within the Resource area (AP007, AP014, AP021 and AP028) have consistently high grades. Each of these drillholes intersected moderately thick laterite containing about 6% ilmenite. The terrain continues to rise to the west without significant erosion channels and so high-grade, moderate thicknesses of laterite are expected in that direction. Exploration sampling to the west indicates potential for good grades extending for at least 2km from the current drilling, with further zones beyond that in Block C.
|
9.9
|
Discussion on the adequacy of data for the purposes of estimating Resources
|
Early exploration of the Alto Paraná area used bauxite-style XRF analyses to measure the whole rock titanium grades of the mineralization. While this method is adequate for delineating potentially mineralized areas, more detailed information is needed to determine the potential smelter feed grade and quality. For this reason, whole rock sample analyses are only used to define Inferred Resources within the Project.
Indicated Resources have been defined using more detailed sample analyses, including recoverable TiO2, heavy mineral and ilmenite grades. There have been minor changes in the sample analysis methods applied in recent years, although all the results collected to date are valid and applicable to the Resource estimates. The ilmenite analyses used as the primary measure of smelter feed grade can be obtained from any suitably equipped laboratory using industry standard techniques.
The previous section shows that in general, both the thickness and grade of mineralization varies smoothly across the Resource zones. Although there is only limited ‘historical’ data where repeat sampling has been possible, repeated sampling shows very similar results to earlier work. QA/QC sampling similarly shows strong correlations between repeat samples without any apparent bias.
In the opinion of the Qualified Person, the data collected to date for the Resource estimations is robust, consistent and suitable for the purposes of estimating the size and grade of the Resources.
[Remainder of page intentionally left blank]
|
10.0
|
Mineral processing and metallurgical testing
|
|
10.1
|
Background and historical testwork
|
From 2009 to 2013 the previous Project owners, CIC, undertook an extensive program of mineral processing and metallurgical testwork designed to produce an ilmenite and magnetite concentrate to be used as smelter feed ultimately producing high titania slag and pig iron. This work program involved both laboratory and pilot plant scale trials to define a process flowsheet and produce an ilmenite and magnetite concentrate. The concentrate production was then followed by process modelling along with laboratory and pilot plant scale smelting tests to demonstrate the production of titanium dioxide slag and high-quality pig iron. By the end of 2011, approximately 108 tonnes of concentrate was produced by the pilot plant in Paraguay. The concentrate was then used as feed for pilot plant smelting tests at the South African Council for Mineral Technology (MINTEK) during the first quarter of 2012.
Complete details on the previous metallurgical testwork programs are to be found in the PEA Reports by Hains (2012) and Kuhn and Brown (2017).
|
10.2
|
2022 metallurgical testing and analytical procedures
|
The HM particles at the Alto Paraná deposits are dispersed through a kaolinitic clay gangue matrix so liberating the mineral grains from this clay gangue is one of the principal success factors to the development of the Project. Previous pilot-scale processing on site used blunger machines that were moderately effective, but are energy intensive and require a large number of blunging and attritioning stages to sufficiently break up the clay matrix and liberate the valuable minerals. While this equipment is typical for clay processing where the liberation of the clay is important there are other alternative processes better suited to mineral sand recovery. This includes scrubbing, gravity separation and high energy attritioning, which was the focus of this testwork.
In 2022 a bulk sample was extracted from the Block E2 area for the purposes of testing alternative flowsheets to optimize the liberation of valuable minerals from the clay matrix. The on-site testing conducted at Alto Paraná in 2022, and subsequently confirmed at LDE, has shown that rotary scrubbing with rock media is a viable method of liberation by which the target minerals can be efficiently liberated from the Alto Paraná host clay.
The testing at LDE included extended scrubbing, gravity separation by shaking table, size-by-size analysis of the concentrates, high density attritioning, magnetic characterization, screening and dry magnetic separation. Final products of ilmenite and titanomagnetite were produced in the testwork program confirming the complicated and expensive processes of intensive attritioning, leaching, roasting and electromagnetic separation proved not to be required. Sample analysis used XRF to determine the chemical composition of the products and QEMScan for mineralogical characterization.
Additional sighter testing including acid and caustic leaching, rod milling, roasting, ultrasonic cleaning and selective fragmentation were completed at LDE. However, as these did not improve product quality these processes have not been included in the process flowsheet.
TiO2 lost to the slimes (minus 45µm) fraction in the scrubbing and desliming stages is not considered to be recoverable and is not included in the metallurgical process recovery calculation. This is in line with the methodology used to arrive at the 2022 Mineral Resource estimate.
|
10.3
|
2022 bulk sample selection and collection
|
Drilling was conducted on a prospective area within Block E2 in late 2021 and early 2022 and approximately 25 tonnes of bulk sample material were taken from this zone. A total of 30 bags of sample were collected from Block E2 with an additional two bags of sample material collected from the Minga Pora quarry to provide crushed basalt for the scrubber trials. A standard excavator was used to extract the bulk samples. The topsoil was stripped and then the excavated samples loaded onto 1-tonne bulk bags.
A total of 20 of the bulk sample bags and two bulk bags of crushed basalt aggregate were sent to LDE and the remaining 10 were sent to the pilot plant on Block A for initial scrubber testing. The UEC Exploration Permit areas and the Block E2 bulk sample locations are shown graphically in Figure 10‑1 while the sample details are shown in Table 10‑1.
Figure 10‑1: UEC exploration permit areas and a zoom-in of the Block E2 bulk sample locations
Table 10‑1: 2022 bulk samples dispatched to LDE
|
Sample name
|
REF
|
Coordinates
|
Sample depth (m BGL)
|
Description
|
|
BSE201 01
|
A1
|
7254481 N , 697139 E
|
1.30
|
Red laterite
|
|
BSE201 02
|
A2
|
7254481 N , 697139 E
|
2.00
|
Red laterite
|
|
BSE201 03
|
A3
|
7254481 N , 697139 E
|
2.70
|
Reddish brown laterite
|
|
BSE201 04
|
A4
|
7254481 N , 697139 E
|
3.00
|
Reddish brown laterite
|
|
BSE201 05
|
A5
|
7254481 N , 697139 E
|
3.50
|
Reddish brown laterite
|
|
BSE202 01
|
B1
|
7254096 N , 697448 E
|
1.00
|
Reddish brown laterite
|
|
BSE202 02
|
B2
|
7254096 N , 697448 E
|
1.20
|
Reddish brown laterite
|
|
BSE202 03
|
B3
|
7254096 N , 697448 E
|
2.00
|
Dark red laterite
|
|
BSE202 04
|
B4
|
7254096 N , 697448 E
|
2.50
|
Dark red laterite
|
|
BSE202 05
|
B5
|
7254096 N , 697448 E
|
3.50
|
Red laterite with saprolite fragments
|
|
BSE204 01
|
C1
|
7253984 N , 697804 E
|
1.50
|
Reddish brown laterite
|
|
BSE204 02
|
C2
|
7253984 N , 697804 E
|
1.80
|
Red laterite
|
|
BSE204 03
|
C3
|
7253984 N , 697804 E
|
2.30
|
Dark red laterite
|
|
BSE204 04
|
C4
|
7253984 N , 697804 E
|
2.70
|
Dark red laterite
|
|
BSE204 05
|
C5
|
7253984 N , 697804 E
|
3.80
|
Dark brown laterite
|
|
BSE204 06
|
C6
|
7253984 N , 697804 E
|
4.20
|
Dark brown laterite
|
|
BSE204 07
|
C7
|
7253984 N , 697804 E
|
4.80
|
Dark brown laterite
|
|
BSE204 08
|
C8
|
7253984 N , 697804 E
|
5.20
|
Dark brown laterite
|
|
BSE204 09
|
C9
|
7253984 N , 697804 E
|
5.80
|
Reddish brown laterite
|
|
BSE204 10
|
C10
|
7253984 N , 697804 E
|
6.20
|
Reddish brown laterite
|
|
10.4
|
Metallurgical testwork laboratories
|
Scrubber testing was initially conducted on site at the Alto Paraná pilot plant to determine a reasonable scrubbing regime and define the parameters for the testwork to be completed at LDE. The Alto Paraná pilot plant is not an accredited laboratory and is unable to perform chemical analysis.
All testwork that has been used to inform the process design was undertaken at LDE. As LDE does not have any laboratory certifications select final product samples were submitted to UIS Analytical Services(Pty) Ltd (UIS) for verification.
XRF analysis and QEMScan analysis was conducted in-house by LDE with select samples sent to UIS in Centurion, Gauteng, South Africa for independent verification of sample analysis. UIS Analytical Services is an ISO/IEC 17025 accredited laboratory.
Both laboratories are independent of TZMI and UEC.
|
10.5
|
Metallurgical testwork results
|
The testing conducted at Alto Paraná in 2022, and subsequently confirmed at LDE, has shown that rotary scrubbing with rock media is a viable method of liberation by which the target minerals can be efficiently liberated from the Alto Paraná host clay.
The testing at LDE included extended scrubbing, gravity separation by shaking table, size-by-size analysis of the concentrates, high density attritioning, magnetic characterization, screening and dry magnetic separation. Final products of RED magnetics (ilmenite-rich) and LIMS Magnetics (titanomagnetite-rich) were produced in the testwork program. Sample analysis used XRF to determine the chemical composition of the products and QEMScan for mineralogical identification. The testwork program confirming the complicated and expensive processes of intensive attritioning, leaching, roasting and electromagnetic separation proved not to be required.
In-country scrubbing testwork
Preliminary testing conducted at Alto Paraná by UEC site staff has shown that scrubbing with basalt media is practicable and that the target minerals can be efficiently liberated from the clay:
|
●
|
in a continuous process;
|
|
●
|
with standard equipment; and
|
|
●
|
utilizing local scrubbing ‘media’ (stones and sand from the local basalt quarries).
|
Scrubber testing was conducted initially on site at the Alto Paraná pilot plant using bulk sample materials obtained from Block E2. Trials with various sizes of screened media were conducted using cement mixers loaded with a range of ore, media and water compositions to optimize the scrubbing conditions.
The testing found that weight ratios of 3-ore : 2-media : 9-water gave rapid scrubbing results without adding excessive water to the process. Scrubbing is most rapidly achieved using two stages, both in closed circuit.
LDE metallurgical testwork
Further scrubbing and metallurgical testwork was undertaken at LDE under supervision from UEC representatives. Approximately 20 tonnes of sample contained in 20 bulk sample bags was sent to LDE along with two bulk bags of crushed basalt aggregate from the Minga Pora basalt quarry for additional scrubbing trials. Refer to Table 10‑1 for the bulk sample details.
The metallurgical testwork program is described in the following sections:
Sample characterization (UE22-01)
The initial work on the samples included characterization by desliming, screening, heavy liquid separation (HLS) magnetic fractionation and XRF analysis by size for each of the 20 bags. The characterization work indicated that across the 20 samples, the slimes fraction ranges from 74.4% to 84.4%, the ROM TiO2 analysis (whole of rock) ranges from 6.0% to 8.4% and the TiO2 in the deslimed sand fraction ranges from 18.7% to 30.9%.
The TiO2 analysis in the slimes (-45µm) ranged from 2.4% to 4.8%, indicating 40-57% of the whole rock TiO2 is unrecoverable and will be lost to the slimes fraction.
Mineralogical Characterization of 8 samples by QEMSCAN (UE22-02)
Two samples composited from 15 of the 20 bulk samples extracted from the Block E2 were processed and magnetically fractionated prior to being imaged by QEMScan.
In total eight samples were analyzed by scanning electron microscope (SEM) to provide data on the magnetic fractionation of two composite samples.
The particle size distributions (PSD) indicated a difference in the PSDs of the magnetic and non-magnetic fractions with the latter being significantly coarser. The non-magnetic fraction PSD was found to have a p90 of 500 to 550µm whereas the magnetic fractions had p90 in the 200µm to 400µm range.
Scrubber testing at LDE (UE22-03)
Ore samples from Block E2, taken from the same location as the samples used for the Alto Paraná site scrubber testing, were used for scrubber testing for testwork program UE22-03. The program produced a 250kg composite sample by extracting and blending 25kg from each of the bulk samples BSE204 01 to BSE204 10 shown in Table 10‑1. Batches of 50kg of sample along with 17.5kg (5 to 10mm basalt stone), 17.5kg (10 to 20mm basalt stone) and 150kg of water were used to match the optimum conditions determined from the site work.
From the results of this testwork the optimum coarse scrubbing retention time of three minutes followed by primary desliming of the separated clays followed by a further fine scrubbing period of 10 minutes with finer rock and sand media has been established. This combination of retention times has been used in the process design criteria. However, further optimization work may reduce the Stage 2 scrubbing to less than 10 minutes. When using this scrubbing procedure approximately 72% of the total TiO2 and 40% of the Fe2O3 is recovered to the sand fraction while rejecting 80% of the mass to the -45µm fraction.
Shaking table, attritioning and magnetic separation testing (UE22-04)
Standard mineral sand separation techniques involving gravity and dry magnetic separation were used to produce the concentrate suitable for use as the smelter feed.
Approximately 33kg of the de-slimed (-500µm + 45µm) sand produced during the UE22-03 scrubbing trials was recombined and used as the feed for the shaking table testwork program UE22-04. During the trial 30kg was passed over a shaking table with the middlings retreated in a second stage of shaking table processing. Concentrate products were screened and assayed. The concentrate was then subjected to attritioning and magnetic separation with the objective of producing a smelter feed.
While concentrates with acceptable TiO2 recoveries were produced from a range of trials the concentrates exceeded the maximum limits for Al2O3, MgO and V2O5 required for chloride slag production. Further investigation showed that this was predominantly due to excessive surface contamination.
Investigations had determined that the likely cause of persistent surface contamination was due to extended sample drying between processing stages. As the drying stages are not representative of the flowsheet, and are only included in the testwork program to allow accurate weighing of material, there was additional emphasis on minimizing the drying of samples in subsequent testwork programs.
Process Development UE22-11
As the concentrates produced in the UE22-04 program exceeded the maximum limits of Al2O3, MgO and V2O5 needed for chloride slag production, alternative processes were investigated. Subsequent processing of the bulk sample over a range of conditions resulted in the production of concentrates with reduced levels of impurities apart from MgO. The resulting assays of the RED Magnetics (ilmenite-rich) and LIMS Magnetics (titanomagnetite-rich) products are shown in Table 10‑2.
Table 10‑2: UE22-11 Products and smelter feed blend
| |
Al2O3
%
|
SiO2
%
|
TiO2
%
|
Fe2O3
%
|
FeO
%
|
CaO
%
|
MgO
%
|
MnO
%
|
V2O5
%
|
Cr2O3
%
|
|
RED Magnetics (ilmenite)
|
0.83
|
0.75
|
48.7
|
21.7
|
27.1
|
0.01
|
0.93
|
0.57
|
0.22
|
0.01
|
|
LIMS Magnetics (Titanomagnetite)
|
1.72
|
0.63
|
28.6
|
46.2
|
20.7
|
0.01
|
0.57
|
0.48
|
0.65
|
0.02
|
|
Smelter feed blend
(90% RED mag +
10% LIMS mag.)
|
0.92
|
0.74
|
46.7
|
24.2
|
26.5
|
0.01
|
0.89
|
0.56
|
0.26
|
0.01
|
The final smelter feed is a blend comprising 90% RED Magnetics (ilmenite-rich) and 10% LIMS Magnetics (titanomagnetite-rich). The addition of LIMS magnetics is limited to ensure the Al2O and V2O5 levels of the blend are below the maximum limits of the smelter feed. The MgO is contained within the ilmenite and titanomagnetite grains and cannot be further reduced.
The final smelter feed concentrate developed through LDE testwork program UE22-11 showed a recoverable TiO2 recovery of 58% relative to the gravity feed. TiO2 lost to the slimes fraction in the scrubbing stages is considered to be unrecoverable and is not included in the testwork recovery calculation.
LDE testwork summary
Overall the on-site scrubbing trials and testwork at LDE yielded positive results that have been used to develop a new process flowsheet for the Project. The separate testwork stages have demonstrated an efficient and effective process for liberating the sand fraction from the clays and generating a heavy mineral concentrate that will require fewer processing stages, less equipment and less energy than previously proposed flowsheets. The testwork has demonstrated that the contained minerals can be liberated from the clay matrix through a series of scrubbing, desliming, screening and washing processing stages using conventional processing equipment. Standard mineral sands processing equipment can then be used to separate the valuable minerals from the sand by exploiting differences in their physical properties.
The final smelter feed blend yielded Al2O and V2O5 levels that are below the maximum limits of the smelter feed. The MgO levels remain elevated as the MgO is contained within the ilmenite and titanomagnetite grains and so cannot be reduced with further physical processing.
|
10.6
|
Process design basis
|
A concentration process utilizing rotary scrubbers, screening, deslime cyclones, spiral separation and magnetic separation was selected to process up to 6.5 million tonnes per annum of feed and recover the ilmenite and titanomagnetite minerals from the clay matrix at Alto Paraná. The testwork has demonstrated that the wet concentration stage will have an ilmenite recovery of over 95% and a titanomagnetite recovery of 71.0% from the deslimed feed. The deslimed feed consists of the sand particles with grainsize between 45µm and 1mm in line with the Resource definition.
Dry magnetic separation produces a LIMS magnetic concentrate (titanomagnetite-rich) at approximately 28% TiO2, RED magnetic concentrate (ilmenite-rich) at approximately 48.7% TiO2, and RED non-magnetic concentrate with approximately 18% TiO2. All of the RED magnetic concentrate and a small proportion of the LIMS magnetic concentrate is blended to produce a smelter feed. Reject streams produced by the process are returned to the mine. The majority of the recoverable TiO2 losses, approximately 12%, are associated with the unused portion of the LIMS magnetic concentrate.
The base case will produce ilmenite and titanomagnetite which are blended to produce approximately 286,000tpa of smelter feed with a grade of 46.7% TiO2 which will be smelted in a single furnace sized to deliver a nominal 150,000tpa of high titania slag and approximately 96,000tpa of HPPI.
A stretch case has also been investigated which will deliver a nominal 500,000tpa of high titania slag and approximately 320,000tpa of HPPI.
The deposits will be mined using hydraulic mining methods with the resulting slurry pumped to the concentrator where sand is liberated from the clay matrix through a series of scrubbing, desliming, screening and washing steps. The deslimed sand is then pumped as a slurry into the wet concentrator plant where conventional mineral sands processing equipment is used to separate the valuable minerals from the gangue minerals by exploiting differences in their densities to produce a heavy mineral concentrate (HMC). The HMC will be further processed using wet LIMS and screening stages with the LIMS non-magnetic fraction (ilmenite-rich) and 25% of the LIMS magnetic fraction undersize (titanomagnetite-rich) dewatered and transported to the mineral separation plant (MSP) for further processing.
Reject streams generated in the wet concentration and mineral separation processes are transported back to the mining area and deposited in the off-path tailings storage facility or back into the mining void. Tailings are dewatered to recycle process water reducing the make-up water requirements.
The concentrates will be trucked from the concentrator to the MSP which is located adjacent to the smelter in the Hernandarias Industrial District. The concentrates will be dried and then separated using dry magnetic separators to produce the titanomagnetite and ilmenite streams. Ilmenite and some of the finer titanomagnetite will be blended to produce the required purity smelter feed. Reject material from the MSP will be backhauled in the HMC trucks to be included in mine backfill. The ability to stockpile and blend at the MSP increases the flexibility to control the smelter feed chemistry.
The smelter process is designed around a traditional ilmenite smelting technology producing high titania slag and HPPI by smelting ilmenite with a grade of 46.7% TiO2 utilizing a reductant with an 85% fixed carbon content. The TiO2-rich slag from the furnace is cooled and crushed to produce chloride grade slag and chloride fines. In chloride slag manufacture, a proportion of the final slag product (approximately 15%) will be produced as a sulfate grade TiO₂ feedstock due to sizing and will need to be sold as a feedstock for sulfate pigment production. This product is generally referred to as chloride fines.
The tapped iron is treated at the iron treatment plant producing HPPI. The slag and iron products are stored at the smelter site before being transported to barge loading facilities for further storage prior to barge transport and shipping to customers.
|
10.8
|
QP opinion of the data adequacy
|
In the QP’s opinion, the physical and metallurgical tests carried out to date by UEC have been adequate to establish a conceptual process to produce a smelter feed which is processed to produce high titania slag and by-product pig iron.
The individual stages of the testwork carried out, as described above and the resulting flowsheet as described in Section 14.0, comprise of industry standard processes that are commonly used in the mineral sands industry. The flowsheet uses well proven technology for the processing of mineral sands. The metallurgical testwork program explored a number of alternative processing options to improve the recovery of heavy minerals that were proven to be unsuitable. This indicates that the final flowsheet, while not fully optimized, is well developed.
Extensive scrubbing and clay liberation testwork has been carried out with a robust scrubbing process developed. These will need further evaluation at a pilot scale in future testwork programs where desliming of the sand by hydrocyclone will also be evaluated.
Standard gravity separation using shaking tables as an analogue for spiral separation has been tested under a range of conditions to determine the possible products. Due to the masses of samples available during this testwork program, a pilot scale trail using spirals was not feasible. The flowsheet using full scale spirals will need to be tested at pilot scale in future testwork programs.
Magnetic separation has been undertaken using induced roll magnets and small-scale rare-earth magnets producing the ilmenite and titanomagnetite products. Final equipment settings and specific capacities will need to be tested at pilot scale in future testwork programs.
Ilmenite smelting was conducted at Mintek in 2012 using concentrates produced from the on-site pilot plant. The on-site pilot plant used an alternative flowsheet to produce concentrates that were of a lower quality than the ilmenite and titanomagnetite produced in the 2022/2023 testwork. The results from the smelting testwork have been used to inform the smelter model used in this study.
No pilot plant, or mini-plant continuous testing has been carried out on the current flowsheet.
TZMI notes that the metallurgical testwork completed to date is conceptual in nature and as such needs to be substantively advanced to support future PFS level studies.
|
10.9
|
QP opinion on sample representation of mineralization
|
Prior to 2022 the processing test work focused on the pilot plant location on Block A. While the test mining and processing program in 2010-2012 was successful, for recent testing there was a desire to test material from elsewhere in the Project area. The area on Block E2 became available for drilling and bulk sample testing in late 2021 and bulk samples were taken from three separate locations within the lease. Access was later granted to Block E1 to the north where drilling showed the mineralization was of greater thickness and extent.
The processing test work with different bulk samples and the drilling data shows the following properties of the mineralization regionally:
|
●
|
All recoverable TiO2 is hosted by ilmenite and titanomagnetite particles.
|
|
●
|
Ilmenite is the preferred smelter feed mineral and is finer grained and ‘cleaner’ than titanomagnetite, which has variable size and composition, and commonly contains clay and iron-rich inclusions.
|
|
●
|
Important impurity elements in the ilmenite and titanomagnetite are apparently affected by the original source rock geochemistry. Background levels of aluminum, magnesium, manganese and vanadium vary across the different project areas.
|
The degree to which the bulk samples taken from Block E2 are representative of the Project areas more generally may be assessed with scatter plots of the important impurity elements for the available bulk samples, from Block E2 and Block A, as well as the magnetic fractions from drill samples from different areas across the Project area. Magnetic fractions from drill samples typically contain a mixture of ilmenite and titanomagnetite, so while the absolute values of the impurity elements do not generally correspond to the ‘pure’ ilmenite or titanomagnetite values, they will lie on trendlines such that the end-member ilmenite compositions can be readily estimated. The following scatter plots show TiO2 analyses on the X axis, with ilmenite-rich concentrates plotted to the right and titanomagnetite-rich concentrates towards the left.
Figure 10‑2: Geochemistry trends showing Al2O3 vs TiO2 of bulk sample products and HM from regional drill samples
In the scatter plot in Figure 10‑2, the Al2O3 of the relatively highly processed sample products ‘RED Mag’ and ‘LIMs Mag’ from Block E2 are compared with similarly processed samples from Tronox testwork on Block A (‘IR’, ‘FMR’ and ‘CM’) and less processed magnetic fractions from drill samples from across the Project area. Results for aluminum are complicated by clay-rich grain coatings, with many of the drill samples containing elevated levels of Al2O3 due to adhered clay on the grains. The most highly processed samples have the lowest Al2O3 values, as expected. The ilmenite-rich product from Block A has about half the Al2O3 of that in the Block E2 sample, suggesting that the Block E2 bulk samples may have higher ‘background’ Al2O3 in the ilmenite fractions than found elsewhere.
Figure 10‑3: MgO content of bulk sample products versus regional samples
In the scatterplot for MgO, Figure 10‑3, the ilmenite-rich product derived from the Block E2 bulk samples has lower levels than generally seen in the drill samples regionally. The 2012 Tronox samples from Block A sit within the main regional trend, whereas the ‘RED Mag’ product sits below the trend. Given the spread of the regional values, it is likely that ilmenite from Blocks A and E1 will have higher MgO values than those from E2, probably about 1.1%.
Scatter plots for manganese and vanadium show that the bulk samples from E2 contain typical values for these elements.
In summary, the geochemistry suggests that the bulk samples taken from Block E2 to generate smelter feed products may contain lower levels of MgO and possibly higher levels of Al2O3 than are typically found elsewhere in the Project area. Other important impurity elements (manganese and vanadium) are likely to be very close to regional averages.
[Remainder of page intentionally left blank]
|
11.0
|
Mineral Resources estimates
|
|
11.1
|
Indicated Resources estimation, summary of key assumptions, parameters and methodology
|
The current study uses ilmenite grade to determine the potential value of mineralization, focusing on mineral grains with particle size greater than 45µm.
Recoverable TiO2 is measured by determining the TiO2 grade of the heavy mineral fraction which is characterized as sand particles with grainsize between 45µm and 1mm, and denser than 2.8SG. The grades of ilmenite and titanomagnetite, the two minerals containing recoverable TiO2, are determined by magnetically separating the HM and analyzing the chemistry of the different magnetic fractions.
Wireframes of the mineralized geological horizons, of soil and laterite, were created along with associated block models to estimate volumes and average grades from drill samples using an anisotropic inverse distance algorithm, with ellipsoid dimensions guided by geostatistical semi-variance measurements. The block models were then trimmed of low-grade peripheral material to determine the new Resource estimates.
|
11.2
|
Block modelling methodology
|
In alluvial titanium deposits, the elevation of the samples is one of the most important attributes affecting grade. At Alto Paraná, however, the mineralized laterite layer is generally ‘draped’ over an undulating topography and equivalent samples may be 40 meters apart vertically. The important geological processes relate to the chemical weathering of the profile and are therefore largely independent of the elevation of the sample, being more dependent on the position within the profile close to the surface or close to the saprolite interface, for instance.
To model the soil and laterite layers the effects of topography were removed by choosing the laterite/saprolite geological horizon as a datum and projecting drillholes so that the horizon lay at a constant elevation, at 340 m ASL for Block E1, as shown in Figure 11‑1. The block model was then created at the false elevation before being re-projected back onto the topography.
Figure 11‑1: Block modelling steps to remove the effect of topography on the block model
Background
The mineralization at Alto Paraná consists predominantly of iron-stained kaolinite, ilmenite and titano-magnetite. The specific gravity and dry bulk densities (assuming 40% air space) of these minerals are shown below in Table 11‑1:
Table 11‑1: Bulk Density and Specific Gravity
|
Mineral
|
Specific Gravity
(t/m3)
|
Dry Bulk Density at 40%
air space (t/m3)
|
|
Kaolinite
|
2.2- 2.6
|
1.32- 1.56
|
|
Ilmenite
|
4.7
|
2.82
|
|
Magnetite
|
4.8- 5.2
|
2.88- 3.12
|
|
Mix of 86% Kaolinite, 8% Ilmenite and 6% Magnetite
|
2.56- 2.92
|
1.53- 1.75
|
Published dry bulk densities for similar lateritic materials range from 0.8 tonne/m3 , which are widely used for shipping bulk kaolin clay, to over 2.0 tonne/m3. For the Alto Paraná mineralization, dry bulk densities anywhere in the range from 1.0 to 2.0 are theoretically possible.
The chemical leaching process that concentrated the minerals in the laterite also causes small voids as the original minerals are leached away, potentially leaving behind material with a fine ‘sponge-like’ texture and a relatively low dry bulk density.
In sandy soils, such voids would typically be filled as the sand collapsed, but at Alto Paraná the clay-rich and coherent nature of the material means that voids caused by leaching, vegetation and perhaps insects and other animals are more stable and long-lasting. In the sampling programs described below, vertical and even overhanging slopes were observed to be stable, so the in-situ material shows high levels of cohesion.
Air voids
The main determinant of the bulk density for the mineralization at Alto Paraná is the degree of grain packing and the presence of air voids. Importantly, until relatively recently, the region was covered with forest and voids from tree roots and perhaps animals, especially termites and ants, are a major control on the present bulk density. Figure 11‑2 shows exposed tree roots in a forested area at Alto Paraná (left) and a road cutting showing the subsoil profile and air voids in the laterite after the forest has been removed for agriculture (right).
Figure 11‑2: Tree roots (left) and a road cutting (right) at Alto Paraná
Given this background, the following factors probably apply:
|
●
|
Air void volumes are likely to decrease with depth as the size and percentage of the root matter in the pre-clearing forest soil profile decreases.
|
|
●
|
Large volumes or many samples are needed to obtain a reliable estimate of the bulk density near the surface.
|
Laboratory determinations of specific gravity and bulk density
Early in the development of the Project mineralized samples were submitted to three laboratories for bulk density or specific gravity determinations. The SG measurements ranged from 2.38 g/cm3 to 2.9 g/cm3, corresponding with the theoretical range of SGs given in Table 11‑1.
Dry bulk density measurements were taken on two of the samples, giving results of 1.56 and 1.69 tonnes/m3, although laboratories typically reconstitute the soil for this test, and so the results may not reflect in-situ conditions.
Table 11‑2: Dry bulk density samples
|
Sample
|
Easting
|
Northing
|
Method
|
SG
|
Method 2
|
Dry BD
|
Moisture %
|
Lab
|
Date
sampled
|
|
PH-100
|
711111
|
7260030
|
D854
|
2.9
|
Archi.
|
1.56
|
|
SENICO
|
17/12/2009
|
|
PH-202
|
711096
|
7250252
|
D854
|
2.87
|
Archi.
|
1.69
|
|
SENICO
|
17/12/2009
|
|
PH-164
|
718267
|
7255266
|
D854
|
2.38
|
Grav.
|
|
20.9
|
Minilab
|
17/12/2009
|
|
PH-157
|
708508
|
7243382
|
D854
|
2.44
|
Grav.
|
|
21.1
|
Minilab
|
17/12/2009
|
|
PH-44
|
713740
|
7248769
|
OA- GRAO8b
|
2.69
|
|
|
|
ALS
|
17/12/2009
|
2011 Field measurements of bulk density
CIC, former owners of the Project, conducted a number of field tests in 2011. Sand replacement tests on 10 samples from 5 sites gave wet bulk density values of 1.65 to 2.08 tonne/m3, averaging 1.86 tonne/m3. Moisture levels were not measured for these samples, but assuming typical moisture levels of 25%, these samples had dry bulk densities of about 1.4 tonne/m3.
Table 11‑3: Dry bulk density samples
|
Sample
|
Easting
|
Northing
|
Method
|
Wet bulk density
|
|
T-2253
|
708921
|
7252649
|
Sand Rep
|
1.75
|
|
T-2253
|
708921
|
7252649
|
Sand Rep
|
1.89
|
|
T-2173
|
708668
|
7254445
|
Sand Rep
|
2.08
|
|
T-2173
|
708668
|
7254445
|
Sand Rep
|
1.85
|
|
T-2250
|
707947
|
7251350
|
Sand Rep
|
1.99
|
|
T-2250
|
707947
|
7251350
|
Sand Rep
|
1.67
|
|
T-2194
|
710223
|
7253367
|
Sand Rep
|
2.04
|
|
T-2194
|
710223
|
7253367
|
Sand Rep
|
1.81
|
|
T-2254
|
709932
|
7251509
|
Sand Rep
|
1.91
|
|
T-2254
|
709932
|
7251509
|
Sand Rep
|
1.65
|
|
T-2253
|
708921
|
7252649
|
Sand Rep
|
1.75
|
|
T-2253
|
708921
|
7252649
|
Sand Rep
|
1.89
|
|
T-2173
|
708668
|
7254445
|
Sand Rep
|
2.08
|
In 2011 a test was conducted at the pilot plant site where a template square frame of steel measuring 1 meter x 1 meter was used to carefully dig a 7 meter deep pit. Material removed for every meter of depth was weighed and moisture levels determined. Until 2023 this was the only large-scale testing of bulk density in the Project area.
Figure 11‑3: Bulk density determination by pit excavation (2011)
Table 11‑4: Bulk density and moisture percentages derived from 2011 pit excavation at the pilot plant site
|
Depth
From
|
Depth
To
|
Volume
|
Wet
Weight
|
Moisture
|
Dry
Weight
|
Wet Bulk
Density
|
Dry Bulk
Density
|
|
m
|
m
|
m3
|
T
|
%
|
t
|
t/m3
|
t/m3
|
|
0
|
1
|
1
|
1.87
|
33.83
|
1.24
|
1.87
|
1.24
|
|
1
|
2
|
1
|
1.75
|
25.19
|
1.31
|
1.75
|
1.31
|
|
2
|
3
|
1
|
1.90
|
34.95
|
1.24
|
1.90
|
1.24
|
|
3
|
4
|
1
|
2.24
|
25.27
|
1.67
|
2.24
|
1.67
|
|
4
|
5
|
1
|
2.93
|
25.12
|
2.19
|
2.93
|
2.19
|
|
5
|
6
|
1
|
2.43
|
25.50
|
1.81
|
2.43
|
1.81
|
|
6
|
7
|
1
|
2.71
|
26.62
|
1.99
|
2.71
|
1.99
|
| |
|
7
|
15.83
|
28.33
|
11.45
|
2.26
|
1.64
|
2023 Bulk density testing: large diameter auger drilling with corn grain replacement
In 2023 an auger pile drill was employed to drill 13 holes, 1.26 meter in diameter, through the laterite layer. The weight of material removed from the holes was measured with a lifting scale and the moisture content measured by taking multiple representative 10kg samples and drying them at 70 degrees Celsius. Although the holes were smooth sided and the hole volumes were expected to be proportional with depth, volumes were confirmed by measuring the weight of corn grain required to refill the void.
Auger holes were sited near the pilot plant on Block A and spread widely on Block C2. There was an attempt to separate deep and shallow materials by drilling two holes at each site, 1-5 meters of depth and a second one down to the saprolite layer. Generally though, the deeper holes did not penetrate much farther than the 5 meter holes, so few conclusions can be drawn on the variability of density with depth.
There is less than 2.2% of variance between the individual cylindrical volumes and the corn replacement volumes, based on a dry bulk density of 0.77 tonne/m3 for corn grain, providing confidence in the volume measurements. The lifting scale was checked with known volumes of water and found to be accurate at the weights being tested.
Moisture percentages varied between 22.7% and 28.8%, averaging 25.4%. All the moisture samples were duplicated and there was less than 2.2% variation between repeat analyses. The results of the auger drilling dry bulk density testing are shown in the following tables. The average dry bulk density measured was 1.20 tonne/m3 and all tests were within 5% of the average.
Table 11‑5: Auger drill testing of bulk density: Location and volume calculations
|
Auger Hole
ID
|
Block
|
Easting
|
Northing
|
Depth
|
Calculated
Cylindrical
Vol (m3)
|
Weight
of Corn
(kg)
|
Corn Bulk
Density
(t/m3)
|
‘Corn
Volume’
(m3)
|
Difference
to Cyl Vol
(%)
|
|
APBD004-1
|
A
|
711021
|
7250806
|
5.17
|
6.45
|
4,911
|
0.77
|
6.38
|
-1.1
|
|
APBD004-2
|
A
|
711022
|
7250809
|
7.10
|
8.85
|
6,742
|
0.77
|
8.76
|
-1.1
|
|
APBD005-1
|
A
|
710929
|
7250719
|
5.00
|
6.23
|
4,878
|
0.77
|
6.34
|
1.6
|
|
APBD005-2
|
A
|
710929
|
7250719
|
7.00
|
8.73
|
6,829
|
0.77
|
8.87
|
1.6
|
|
APBD006
|
A
|
711250
|
7250925
|
5.00
|
6.23
|
4,857
|
0.77
|
6.31
|
1.2
|
|
APC2BD005-1
|
C2
|
702749
|
7254635
|
5.00
|
6.23
|
4,819
|
0.77
|
6.26
|
0.4
|
|
APC2BD005-2
|
C2
|
702752
|
7254627
|
6.90
|
8.60
|
6,756
|
0.77
|
8.77
|
2.0
|
|
APC2BD006-1
|
C2
|
700371
|
7256568
|
5.00
|
6.23
|
4,795
|
0.77
|
6.23
|
-0.1
|
|
APC2BD006-2
|
C2
|
700379
|
7256561
|
5.80
|
7.23
|
5,554
|
0.77
|
7.21
|
-0.3
|
|
APC2BD007-1
|
C2
|
704044
|
7252633
|
5.00
|
6.23
|
4,833
|
0.77
|
6.28
|
0.7
|
|
APC2BD007-2
|
C2
|
704047
|
7252626
|
6.00
|
7.48
|
5,680
|
0.77
|
7.38
|
-1.4
|
|
APC2BD008-1
|
C4
|
702127
|
7265773
|
5.00
|
6.23
|
4,696
|
0.77
|
6.10
|
-2.2
|
|
APC2BD008-2
|
C5
|
702126
|
7265760
|
4.90
|
6.11
|
4,737
|
0.77
|
6.15
|
0.7
|
|
Total of Auger Holes
|
|
|
|
72.87
|
90.86
|
|
|
91.02
|
0.2
|
Table 11‑6: Auger drill testing of bulk density: Weights and density results
|
Auger Holes
|
Average
Volume
(m3)
|
Weight of
Material
Extracted (kg)
|
Moisture
(%)
|
Weight of
Dry Material
(kg)
|
Dry Bulk
Density
(t/m3)
|
Difference to
Average DBD (%)
|
|
APBD004-1
|
6.41
|
10,280
|
25.1
|
7,699
|
1.20
|
0.3
|
|
APBD004-2
|
8.80
|
14,296
|
26.0
|
10,574
|
1.20
|
0.3
|
|
APBD005-1
|
6.28
|
9,749
|
25.9
|
7,228
|
1.15
|
-4.0
|
|
APBD005-2
|
8.80
|
14,107
|
26.9
|
10,307
|
1.17
|
-2.2
|
|
APBD006
|
6.27
|
9,719
|
24.1
|
7,372
|
1.18
|
-1.8
|
|
APC2BD005-1
|
6.25
|
9,923
|
26.4
|
7,299
|
1.17
|
-2.4
|
|
APC2BD005-2
|
8.69
|
14,076
|
26.5
|
10,346
|
1.19
|
-0.6
|
|
APC2BD006-1
|
6.23
|
10,262
|
23.9
|
7,811
|
1.25
|
4.7
|
|
APC2BD006-2
|
7.22
|
11,804
|
24.1
|
8,965
|
1.24
|
3.7
|
|
APC2BD007-1
|
6.26
|
10,043
|
26.1
|
7,424
|
1.19
|
-0.9
|
|
APC2BD007-2
|
7.43
|
12,162
|
27.9
|
8,766
|
1.18
|
-1.5
|
|
APC2BD008-1
|
6.17
|
9,689
|
22.7
|
7,487
|
1.21
|
1.4
|
|
APC2BD008-2
|
6.13
|
9,917
|
23.1
|
7,623
|
1.24
|
3.8
|
|
Total
|
90.94
|
146,027
|
25.4
|
108,900
|
1.20
|
|
Figure 11‑4: Large diameter auger drilling bulk density test
Figure 11‑5: Corn grain being poured into one auger hole to measure volume. The lifting scale used to measure the weight of extracted material and replacement corn is visible on the loader
2023 Bulk density testing: Excavations with LIDAR survey
Prior to the auger drill testing described above, a program of digging pits with a backhoe and by hand was undertaken. The pits generally started with a 3 meter x 2 meter x 0.5 meter deep ‘pre-strip’ pit removing soil and topsoil. After that, material was removed in one meter intervals to the base of the pit – generally at the saprolite horizon.
All material extracted from the pits was weighed and representative samples weighing 10kg were taken to determine moisture content.
When excavations were completed at each level, the pits were scanned with Light Detection and Ranging technology (LIDAR). The resulting point clouds were georeferenced with control points at the surface surveyed with differential GPS. The point clouds were subsequently used to create 3D models and the volumes calculated.
Figure 11‑6: Pit excavations for 2023 bulk density tests and samples taken for analyzing moisture
Figure 11‑7: LIDAR scanning of pits and a cut-away example of the resulting LIDAR point cloud data
Figure 11‑8: Examples of the 3D models made from the LIDAR scans of the excavations (from left APBD001, APBD002 and APBD003, all on Block A near the pilot plant)
Five pits were excavated on Block A near the pilot plant site and five on Block C2. There was a total of 50 individual samples where volume and weight were measured, totaling 273 tonnes of moist material. Details of the totals are shown in Table 11‑7.
Table 11‑7: Overall totals from the 2023 LIDAR excavations
|
Moist Weight
Removed (t)
|
Average
moisture%
|
Dry weight
removed (t)
|
Volume
(m3)
|
Average overall dry bulk
density (t/m3)
|
|
273.6
|
25.1%
|
204.9
|
176.5
|
1.16
|
Some samples from near the bases of the excavations contained saprolitic material and had lower than average bulk density. If these saprolitic samples are removed, the averages by depth are shown in the Table 11‑8 and Figure 11‑9.
Table 11‑8: Total of excavated laterite only material by depth
|
Average
depth (m)
|
Moist
weight
removed (t)
|
Average
moisture%
|
Dry weight
removed
|
Volume
(m3)
|
Average overall
dry bulk density
|
Percent of
total weight
|
|
1.0
|
95.6
|
25.0%
|
71.7
|
62.4
|
1.15
|
38%
|
|
2.1
|
59.4
|
24.8%
|
44.7
|
39.2
|
1.14
|
24%
|
|
3.0
|
39.1
|
24.9%
|
29.4
|
24.2
|
1.21
|
16%
|
|
4.0
|
23.1
|
25.3%
|
17.2
|
14.7
|
1.17
|
9%
|
|
5.0
|
20.3
|
26.5%
|
14.9
|
12.5
|
1.20
|
8%
|
|
5.9
|
12.2
|
27.0%
|
8.9
|
7.2
|
1.23
|
5%
|
|
Total
|
249.7
|
25.2%
|
186.8
|
160.3
|
1.17
|
|
Figure 11‑9: Scatter plot showing dry bulk density of LIDAR excavation laterite samples by depth
Bulk density: Discussion
Prior to the 2023 field bulk density test work being undertaken, there was considerable uncertainty regarding the average dry bulk density at Alto Paraná. The single 7 meter deep pit test in 2011 gave an average dry bulk density of 1.64 tonne/m3 which, in hindsight, is an anomalous result; some 37% above the recently established average value. Two LIDAR excavations were completed about 35 meters from the 2011 pit location in 2023, and two large diameter auger drillholes were completed about 70 meters from the location. Both LIDAR excavations averaged 1.19 tonne/m3 and both auger drillholes averaged 1.20 tonne/m3. The highest densities were encountered at the base of the two LIDAR excavations, 1.27 tonne/m3 and 1.28 tonne/m3; still 22% lower than the 2011 estimate.
It is possible that the earlier estimation somehow got the moisture calculation wrong, as the difference is of similar magnitude. In all the other field testing in 2023, including sites up to 18km away, there was at most 5% of variation encountered in the auger drilling results. Within the more detailed and more variable LIDAR excavations, the minimum density encountered was 1.05 (13% less than the average), and the maximum was 1.31 (9% more than the average). It should also be noted that the 2023 field tests excavated and weighed a total of nearly 400 tonnes of moist material (300 tonnes of dry material) from measured volumes totaling over 250 cubic meters. The 2011 bulk density test measured less than 3% of this total.
Considerable time and effort was put into the LIDAR excavations in 2023. Two different LIDAR scanners were used during the program, a tripod mounted Trimble instrument commonly used for surveying construction sites and stockpiles, and a hand-held scanner (an iPhone 14). The Trimble unit could not scan the deeper sections of the pit and so the iPhone was used for these, mounted on a gimbal and a pole. Marks were painted on the walls to facilitate merging, aligning and georeferencing of the scanned points. Control points were also placed around the edge of the pit and included with each new pit scan.
However, with workers accessing the pits on ladders, the painted marks on the walls were sometimes disturbed or removed. With movement of people and sample material in and out of the pits there is also the possibility that material from the walls higher up can be knocked down into the pit, thereby increasing the apparent bulk density of the deeper sections. The sheer quantity of data generated by the LIDAR scanners can also be challenging with typically more than 20 million points per excavation.
Given the potential uncertainties in the LIDAR excavations, and especially given the step change in the bulk density factor to that previously accepted, the auger drilling program was initiated to confirm the new results. As evidenced, the auger drilling program was a better technique to use as it was faster, simpler and less prone to potential problems.
With the auger drilling the same techniques were applied for weighing and testing the moisture of the extracted material as in the LIDAR excavations. The calibration of the weighing scale was re-checked. The repeat moisture results were all close to the primary analyses and the overall consistency of the moisture analyses gives high confidence in these results.
The ‘theoretical’ cylindrical volumes from the auger drilling were checked by weighing the quantity of dry corn grain required to fill the holes. The volumes derived using a corn density of 0.77 t/m3 corresponded well with the ‘theoretical’ cylindrical volumes of the hole. The auger drill had a horizontal cutter at the base, so volumes were not complicated by a conical end section.
There is a possibility that the corn compresses slightly under its own weight when stacked in thicknesses of 5 meter or more. Grain storage experts apply a ‘packing factor’ for different sized and shaped silos. However, in the auger drilling tests at Alto Paraná in 2023, there was little evidence of increased density of corn at depth. It is likely the relatively tall and narrow stacking shape limits the effects of the weight of the stacked material at depth. The volumes derived from filling the voids with corn were consistently very close to the ‘theoretical’ cylindrical volumes, without having to consider additional ‘packing factors’.
Variability of bulk density values
The relatively high number of samples taken in the LIDAR excavations allows some conclusions to be drawn regarding the variability of bulk density in the Project area. Of the 45 zones of laterite sampled, 41 of the zones (91% of the zones) had dry bulk densities within 5% of the median average value (1.164). Of the 13 auger holes completed, 9 of the holes (70%) had dry bulk densities in the range of -3% and +1% of the median average (1.19).
There is a small possibility that some untested zones in the Project area have undergone different geological conditions that affect the dry bulk density. However, given the consistency of the mineralization across the Project and the consistency of the bulk density sampling results obtained 2023, it is unlikely any large areas of mineralization exist within the Project with significantly different bulk densities to those reported above.
Further bulk density sampling is still required across Resource areas as access becomes available. It is recommended that the large diameter auger drill is used again for future programs as the drilling and sampling process is efficient and not prone to errors.
|
11.4
|
Block E1 mineralization variography
|
The HM analyses from the false-elevation drill data were modelled with variography as this ‘element’ was analyzed at 1 meter intervals and is closely correlated with recoverable titanium and ilmenite grades.
In the Z direction, none of the laterite layer intercepts were thick enough to fully model the sill on the variograms, however the firm estimate of the nugget of just 7% (nugget value of 1.1 and total sill of 15.5) shows there is a high level of consistency between samples taken close to each other. The Z direction range is indicated to be approximately 40 meters – much thicker than any laterite layers intercepted to date.
In the horizontal direction, a moderately reliable range of 1,100 meters is indicated in Figure 11‑10 in the variograms below. There was little variation in the horizontal range with direction. For selecting samples for estimating block model grades, a flat, circular ellipsoid is therefore appropriate with a vertical diameter of 80 meters and a horizontal diameter of 2,200 meters.
Figure 11‑10: Semi-variograms (vertical and horizontal) for HM at Block E1 mineralization
Source (UEC 2023)
|
11.5
|
Mineralogy determination
|
As discussed in Section 6.4, the recoverable titanium mineralization at Alto Paraná consists of the minerals ilmenite and titanomagnetite. Provided the content of other minerals is low, the mineralogy of concentrates, such as heavy minerals, or process concentrates, may be reliably estimated from chemical analyses of the samples.
QEMScan calibration samples
QEMScan analyses of samples rich in ilmenite or titanomagnetite have been used to determine the chemistry of these two end-member minerals. In 2014, Tronox conducted QEMscan analyses and XRF/ICP chemical analyses on three processing ‘products’ generated in large scale separation testwork from samples derived from Block A.
The QEMScan process on the Tronox samples classified the mineral phases into 27 categories depending on chemistry. With numerous inclusions and variable compositions in the titanomagnetite grains, these were split into seven different titanium bearing iron oxide ‘phases’. Ilmenite, by contrast, was classified as ‘ilmenite’ or very infrequently ‘altered ilmenite’. Other mineral phases, such as silicates, comprise less than 1% of the total in these samples, so they are effectively mixtures of ilmenite and titanomagnetite.
Table 11‑9: QEMScan mineralogy of Tronox 2014 processing products
|
Tronox processing product
|
Ilmenite%
|
Titanomagnetite%
|
Others%
|
|
IR ‘ilmenite-rich’
|
90.3
|
9.5
|
0.2
|
|
CM ‘coarse magnetite’
|
9.1
|
90.3
|
0.6
|
|
FMR ‘fine magnetite-rich’
|
63.8
|
35.7
|
0.5
|
The chemistry of the three products is shown in Table 11‑10.
Table 11‑10: Chemistry of Tronox's 2014 processing products
|
Assay (%)
|
IR ‘Ilmenite-rich’
|
FMR ‘Fine
Magnetite-rich’
|
CM ‘Coarse
magnetite’
|
|
Wt% of Feed
|
24.1
|
|
37.8
|
|
30.3
|
|
|
TiO2
|
47.7
|
|
41.84
|
|
27.62
|
|
|
Fe2O3 (tot)
|
53.1
|
|
57.17
|
|
69.64
|
|
|
FeO
|
32.6
|
|
24.8
|
|
19.15
|
|
|
Al2O3
|
0.46
|
|
0.85
|
|
1.53
|
|
|
SiO2
|
0.24
|
|
0.36
|
|
0.55
|
|
|
MgO
|
1.12
|
|
0.86
|
|
0.55
|
|
|
MnO
|
0.54
|
|
0.54
|
|
0.48
|
|
|
CaO
|
0.025
|
|
0.008
|
|
0.117
|
|
|
V2O5
|
0.31
|
|
0.40
|
|
0.71
|
|
|
Cr2O5
|
0.013
|
|
0.011
|
|
0.022
|
|
|
P2O5
|
0.027
|
|
0.038
|
|
0.047
|
|
|
Nb2O5
|
0.046
|
|
0.054
|
|
0.067
|
|
|
ZrO2
|
0.128
|
|
0.110
|
|
0.063
|
|
|
Th (ppm)
|
2.45
|
|
4.65
|
|
3.29
|
|
|
U (ppm)
|
0.25
|
|
0.53
|
|
0.68
|
|
|
LOI
|
-3.42
|
|
-2.33
|
|
-1.75
|
|
Balancing the mineralogy results with the chemistry gives the following average mineral compositions for ‘ilmenite’ and ‘titanomagnetite’ in the Tronox products.
Table 11‑11: Mineral compositions from Tronox 2014 testwork (Block A sample material)
|
Assay (%)
|
Ilmenite
|
Titanomagnetite
|
|
TiO2
|
50.2
|
|
25.5
|
|
|
Fe2O3 (tot)
|
51.4
|
|
71.8
|
|
|
FeO
|
35.0
|
|
18.0
|
|
|
Al2O3
|
0.34
|
|
1.46
|
|
|
SiO2
|
0.2
|
|
0.4
|
|
|
MgO
|
1.19
|
|
0.50
|
|
|
MnO
|
0.55
|
|
0.48
|
|
|
CaO
|
0.014
|
|
0.126
|
|
|
V2O5
|
0.27
|
|
0.76
|
|
|
Cr2O5
|
0.012
|
|
0.024
|
|
|
P2O5
|
0.025
|
|
0.05
|
|
|
Nb2O5
|
0.045
|
|
0.07
|
|
|
ZrO2
|
0.14
|
|
0.056
|
|
|
Th (ppm)
|
2.35
|
|
3.41
|
|
|
U (ppm)
|
0.2
|
|
0.73
|
|
|
LOI
|
-3.6
|
|
-1.64
|
|
A very similar exercise was completed by UEC in 2023. Two products generated from process testwork on Block E2 bulk samples (RED Mag, LIMs Mag) were analyzed with both QEMScan and XRF. The summary QEMScan mineralogy and chemistry are shown in Table 11‑12.
Table 11‑12: Summary QEMScan mineralogy of major UE23-02 products
|
UE23-02 Processing Product
|
Ilmenite%
|
Titanomagnetite%
|
Others%
|
|
RED Mag
|
92
|
7
|
1
|
|
LIMs Mag1
|
36
|
63
|
1
|
|
LIMs Mag2
|
14
|
86
|
0
|
|
1.
|
The initial QEMScan estimate of ilmenite in the LIMS Mags is too high – there is insufficient TiO2 in the product to account for this amount of ilmenite in the LIMs Mag.
|
|
2.
|
Revised mineralogy giving correct chemistry.
|
The initial QEMScan result for the LIMs Mag product gave an estimate of 36% ilmenite in that sample. However, the TiO2 grade of that fraction was too low to support this estimate. It is noted that titanomagnetite grains contain abundant ilmenite inclusions. QEMScan, being a point-scanning method, may have classified ilmenite inclusions in the titanomagnetite as discrete ‘ilmenite particles’ in this material, thereby overstating the ilmenite grade. If the titanium grade is used to ‘balance’ the ilmenite/titanomagnetite ratio in the LIMs Mag (for example ilmenite is 14% of the LIMs Mag, not 36%), then all the other elements balance as well.
Table 11‑13: Chemistry of the UE23-02 products
|
Assay (%)
|
RED Mag
|
LIMs Mag
|
|
TiO2
|
48.7
|
|
28.62
|
|
|
Fe2O3 (tot)
|
51.8
|
|
69.2
|
|
|
Al2O3
|
0.83
|
|
1.72
|
|
|
SiO2
|
0.75
|
|
0.63
|
|
|
MgO
|
0.93
|
|
0.57
|
|
|
MnO
|
0.59
|
|
0.49
|
|
|
V2O5
|
0.22
|
|
0.65
|
|
|
Cr2O5
|
0.01
|
|
0.02
|
|
|
P2O5
|
0.02
|
|
0.03
|
|
|
ZrO2
|
0.09
|
|
0.01
|
|
|
LOI
|
-3.14
|
|
-1.73
|
|
Table 11‑14: End-member mineral compositions derived from UE23-02 testwork
| |
Ilmenite
|
Titanomagnetite
|
|
TiO2
|
51.3
|
|
25.5
|
|
|
Fe2O3 (tot)
|
50.0
|
|
73.0
|
|
|
Al2O3
|
0.4
|
|
1.5
|
|
|
SiO2
|
0.4
|
|
0.5
|
|
|
MgO
|
1.0
|
|
0.52
|
|
|
MnO
|
0.6
|
|
0.48
|
|
|
V2O5
|
0.18
|
|
0.72
|
|
|
LOI
|
-3.5
|
|
-1.6
|
|
The mineral compositions in Table 11‑11 and Table 11‑14 are very similar and the small differences that exist may be due to regional variations or small differences in analysis techniques. For this reason, the TiO2 grade of ilmenite and titanomagnetite have been ‘rounded’ to 50% and 25% respectively for estimating mineralogy.
HM or magnetic fraction TiO2-based mineralogy determination
For Alto Paraná mineral concentrates with low levels of SiO2 and Al2O3 (less than 3% combined), the percentage of ilmenite present in the fraction may be estimated by applying the following formula:
|
●
|
Ilmenite% = 4 x TiO2% -1
|
|
●
|
Titanomagnetite% of the fraction = 1- ilmenite%
|
For example, an Alto Paraná mineral concentrate with TiO2 of 44% (and combined SiO2 and Al2O3 of less than 3%) is estimated to contain 4 x 0.44 – 1 = 0.76 (i.e. 76% ilmenite, and 24% titanomagnetite).
In rare instances where samples contain more than 50% TiO2, then the ilmenite content is ‘capped’ at 100% and similarly for rare samples with less than 25% TiO2, the titanomagnetite content is capped at 100%.
Recently tested drill samples were subject to heavy liquid separation and the HM was magnetically fractionated. The formula above may be applied to the Mag1 and Mag2 fractions as well as the HM fraction. Generally, the non-magnetic fraction contains elevated SiO2 and Al2O3 (if measured) and generally represents only a small fraction of the total ‘heavy mineral’ in any case. Estimating mineralogy on the magnetic fractions also gives an initial appraisal of the likely behavior of the material in the processing plants.
For samples with elevated levels of SiO2 and Al2O3, between 3% and 10% combined, it is possible to recalculate the TiO2 grade as if the SiO2 and Al2O3 were 3% total, estimate the ilmenite and titanomagnetite in the resulting ilmenite/titanomagnetite ‘mix’, and then re-dilute them with the SiO2 and Al2O3 -rich ‘Other Minerals’ to estimate overall mineralogy.
Whole rock TiO2-based mineralogy determination
For areas where only whole rock titanium analyses are available, there is a moderately strong relationship between whole rock TiO2 and ilmenite grade that can be used to estimate ilmenite grade. The formula is:
|
●
|
Ilmenite grade = whole rock TiO2% x 129.3 – 5.431
|
For example a sample with whole rock TiO2 of 8%, the estimated ilmenite grade is:
|
●
|
Ilmenite grade = 0.08 x 129.3 – 5.431 = 4.9%
|
In the Block A Indicated Resource model there are 569 cells with ilmenite determined using the HM TiO2-based method described in the previous section and where ilmenite can also be estimated using the whole rock TiO2 grade. The scatter plot comparison is shown below (correlation coefficient 61%).
This method of determining ilmenite grade has been applied to some Inferred Resource zones to determine the likely contained smelter feed grade, but it is not used for any of the Indicated Resources.
Figure 11‑11: Comparison of ilmenite grades with ilmenite grade estimated from whole rock TiO2
Ilmenite is the main component of the proposed smelter feed and is used for cut-off grade determinations. Titanomagnetite, the other potential source of recoverable titanium, contains less titanium and only comprises a minor portion of the smelter feed, with the bulk planned to be returned to the mining void.
The standard method for determining cut-off grade is applied in the first instance. Average mining, processing and transport costs are taken from the economic analysis described in Section 19.0.
The unit costs shown in Table 11‑15 reflect the operating cost of each stage from mining to product transport divided by the input tonnes for that stage. The only costs relevant to the economic cut-off grade estimation, however, are the costs of mining and wet concentration. Once ilmenite is concentrated at the wet concentrator, all subsequent costs remain the same.
Table 11‑15: Unit costs used for the cut-off grade determination
|
Operating stage
|
Unit
cost
|
Unit
|
Nominal
units/year
|
Opex US$
million pa
|
Source
|
|
Mining & Rehabilitation
|
1.3
|
$/t mined
|
6,200,000
|
8.2
|
Table 18-2
|
|
Processing at the Wet Concentrator
|
2.5
|
$/t mined
|
6,200,000
|
15.2
|
Table 18-2
|
|
HMC Transport to MSP
|
5.9
|
$/t HMC
|
340,000
|
2.0
|
Table 18-2
|
|
Processing at MSP
|
8.8
|
$/t HMC
|
340,000
|
3.0
|
Table 18-2
|
|
Smelting Cost
|
146.5
|
$/t Smelter Feed
|
286,000
|
41.9
|
Table 18-2 LOM Avg/286kt
|
|
Product Transport & Handling
|
73.2
|
$/t Smelter products
|
246,000
|
18.0
|
Table 18-2 LOM Avg/246kt
|
|
Admin & Marketing
|
14.6
|
$/t Smelter products
|
246,000
|
3.6
|
Table 18-2 LOM Avg/246kt
|
|
NSR Royalties
|
5.3
|
$/t Smelter products
|
246,000
|
1.3
|
Table 18-2 LOM Avg/246kt
|
|
Sustaining Capital
|
24.0
|
$/t Smelter products
|
246,000
|
5.9
|
Table 18-2 LOM Avg/246kt
|
| |
|
|
All-in sustaining costs
|
99.1
|
|
Product prices shown in Table 11‑16 are taken from the marketing information disclosed in Section 16.0.
Table 11‑16: Product revenues used for cut-off grade determination
|
Product
|
Value US$ per tonne
|
Average annual
production tonnes
|
Average annual
revenue US$ million
|
|
Chloride slag
|
1,025
|
118,500
|
120
|
|
Chloride slag fines
|
720
|
19,300
|
14
|
|
High purity pig iron
|
747
|
88,500
|
66
|
|
Total
|
|
226,300
|
200
|
| * Production figures are rounded. Rounding errors may occur. |
Average annual operating plus sustaining capital costs for the base case Project is estimated to be US$99 million. The average annual revenue for the same period is US$200 million. The average annual operating costs to mine and process the ore to produce HMC and rehabilitate the mine site are US$23.4 million (US$81.8 per tonne of smelter feed).
For the costs of the operation to be the same as the revenues, the average cost of mining and processing the ore must rise from US$23 million to US$124 million (US$200million - (US$99 million - US$23 million)), a factor of 5.4 times greater than ‘normal’ operating costs.
Small increases in the cost of tailings treatment are expected as grade drops, but for the sake of this exercise, the cost of mining and wet processing the mineralization are regarded as directly proportional to the ilmenite grade. The average ilmenite grade of the Indicated Resources, prior to losses and dilution, is 4.86%. Dividing this value by 5.4, the resulting economic cut-off grade is 0.9% ilmenite in the Resource (for example prior to losses and dilution).
Therefore, according to the S-K 1300 definition, material with greater than 0.9% ilmenite is profitable to mine and process. Material with a grade less than 0.9% ilmenite is waste.
However, a more practical cut-off has been applied using the potential replacement cost of smelter feed. Under this scenario ilmenite is purchased from elsewhere and transported to the smelter location as smelter feed at an estimated cost of $275 per tonne. Smelter feed acquired like this does not require MSP treatment or transport from the mine site which is estimated at $13 and $17 per tonne respectively. Therefore, the equivalent cost of production at the mine site is $245. Of course, long term contracts are required to acquire ilmenite in this manner and logistics and supply routes established, but theoretically if smelter feed costs more than $245 per tonne to produce (measured at the WCP), then it is cheaper to acquire it from external sources.
The current average cost of production of smelter feed at the wet concentrator plant (WCP) is $81.8 per tonne, using the average Resource grade of 4.86% ilmenite. The scaling factor to lift the mining and processing costs up to $245 is 3.0.
The ‘equivalent replacement cost’ cut-off grade for ilmenite in the Resource is therefore 1.6% (4.86%/3.0).
In summary:
|
●
|
The ‘strict’ economic cut-off grade (required by S-K 1300) is 0.9% ilmenite in the Resource.
|
|
●
|
The cut-off grade used in practice is 1.6% ilmenite (often rounded to 2%), because mining and processing material at a lesser grade produces smelter feed at a higher cost than can theoretically be sourced from the open market.
|
|
11.7
|
Block E1 Block Model and Resource Estimate
|
Block modelling parameters for the Resource model for Block E1 (E1E) are listed in Table 11‑17.
Table 11‑17: Block modelling parameters for the Resource model for Block E1
|
Parameter
|
Value
|
Comments
|
|
Block Model Cell Size
|
100 x 100 x 0.5
|
A ‘flat’ model aligned with UTM coordinates.
|
|
Inverse Distance Factor
|
Distance cubed
|
Distance cubed to give close correlation with nearby drill samples.
|
|
Ellipsoid Size (diameter)
|
2,200m x 2,200m x 80m
|
As per variogram ranges.
|
|
Average number of drill samples used to estimate HM values for each block; minimum, average, maximum.
|
61, 154, 247
|
One result of the large ellipsoid is a high number of samples used to estimate the blocks.
|
|
Bulk Density (t/m3)
|
1.2
|
See discussion in text.
|
|
Drill Samples HM% Minimum, Average, Maximum
|
2.7, 12.9, 20.4
|
|
|
Block Model HM% Minimum, Average, Maximum
|
2.9, 12.9, 20.3
|
Good fit with drill samples, not too smoothed.
|
Peripheral low-grade blocks and blocks within ‘bosque’ areas were trimmed from the model. The total estimated material in the Resource model for Block E1 is presented in Table 11‑18.
Table 11‑18: Block E1 Indicated Resource estimate
|
Zone
(Model)
|
Resource
Category
|
Volume
(Mm3)
|
Tonnes
(Mt)
|
HM1,2
|
Slime
|
Ilmenite
|
Titano-
magnetite
|
Whole
Rock
TiO2
|
Recoverable
TiO23
|
|
Block E1 (E1E)
|
Indicated
|
28
|
34
|
14%
|
83%
|
4.9%
|
8.4%
|
7.5%
|
4.5%
|
Notes:
|
1.
|
HM is the ‘Heavy Mineral’ fraction of the Resource, particles between 45µm and 1mm, denser than 2.8g/cm3.
|
|
2.
|
All grades are expressed as in-situ grades.
|
|
3.
|
Recoverable TiO2 is that contained in the HM.
|
|
4.
|
An ilmenite cut-off of 2% has been applied.
|
Figure 11‑12: Estimated ilmenite grades for Block E1 Resource (block model and drillhole values)
|
11.8
|
Block A Block Model and Resource Estimate
|
The analyses completed in 2023 using the 2020 drillholes on Block A were combined with previous test results from Tronox’s 2013 analyses of earlier CIC drill samples to create a block model for the Block A Resource. Modelling parameters are shown in Table 11‑9.
Table 11‑19: Block modelling parameters for the Block A Resource model
|
Parameter
|
Value
|
Comments
|
|
Block Model Cell Size
|
100 x 100 x 0.5
|
A ‘flat’ model aligned with UTM coordinates.
|
|
Inverse Distance Factor
|
Distance to the power of 2.5
|
The less regular spacing of drill samples at Block A compared to E1 means an algorithm that gives a ‘smoother’ model is more appropriate.
|
|
Ellipsoid Size (diameter)
|
2,200m x 2,200m x 80m
|
As per variogram ranges.
|
|
Bulk Density (t/m3)
|
1.2
|
See discussion in text.
|
Table 11‑20: Block A Indicated Resource estimation
|
Zone (Model)
|
Resource
Category
|
Volume
(Mm3)
|
Tonnes
(Mt)
|
HM1,2
|
Ilmenite
|
Titano-
magnetite
|
Whole Rock
TiO2
|
Recoverable
TiO23,4
|
|
Block A (A5C)
|
Indicated
|
30
|
36
|
11%
|
4.8%
|
5.2%
|
7.7%
|
3.7%
|
|
Block A (A5C)
|
Inferred
|
67
|
80
|
|
4.9%
|
|
7.7%
|
|
Notes:
|
1.
|
HM is the ‘Heavy Mineral’ fraction of the Resource, particles between 45um and 1mm, denser than 2.8g/cm3.
|
|
2.
|
All grades are expressed as in-situ grades.
|
|
3.
|
Recoverable TiO2 is that contained in the HM.
|
|
4.
|
A cut-off of 2% ilmenite has been applied for the Indicated Resource. For the Inferred Resource the cut-off is 5.75% whole rock TiO2, equating approximately to 2.0% ilmenite.
|
The Figure 11‑13 shows the modelled ilmenite grade in the Block A Indicated Resource as well as the source drillhole data. Although there are no direct measurements of the ilmenite grade in the Inferred Resource zones, grades have been estimated using the relationship with whole rock TiO2 according to the method described in Section 11.5. The ilmenite grades estimated using this method in the Inferred Resource areas are shown with faded colors and drillhole values shown with italic font.
Figure 11‑13: Ilmenite grade. Inferred Resource ilmenite grade is calculated using whole rock TiO2
|
11.9
|
Regional Resource Estimate
|
Drillhole intervals that intersected laterite from all leases were composited to give thickness and average whole rock TiO2 grades. Voronoi polygons constructed around the drillholes were trimmed with lease areas, bosque areas updated with 2022 satellite imagery, townsite areas and highway land. Other Indicated and Inferred Resources for Block E1 and Block A as described above were excluded and remnant polygons with very small areas deleted. The resulting polygons are shown in Figure 11‑14.
As there is no direct measurement of ilmenite grade in most of these zones, the method described in Section 11.5 has been used to determine that 5.75% whole rock TiO2 is approximately equal to 2% ilmenite (for example 0.0575 x 129.3 – 5.431 = 2.0%). Therefore, 5.75% whole rock TiO2 is used as the low grade cut-off for determining the regional Inferred Resource. In the map below, polygons below the cut-off are colored green and blue, while those above are colored yellow, orange and red.
Figure 11‑14: Regional Inferred Resource polygons, colored by whole rock TiO2
Table 11‑21: 2023 Estimate of Inferred Resource on currently held mineral leases
|
Zone (Model)
|
Resource
Category
|
Vol
(m3 x 106)
|
Tonnes
(106)
|
Whole
Rock TiO2
|
Average Thickness
(meters)
|
|
2023 Estimate MYNM Leases (5.75% TiO2 Cut-off grade)
|
Inferred
|
2,900
|
3,500
|
7.3%
|
6.3
|
It is important to note that at this time the percentage of recoverable TiO2, ilmenite or ‘smelter feed’ cannot be determined with confidence for most of the regional Inferred Resource zones. Further testwork is required to quantify the ilmenite grade in these zones so that the smelter feed grade can be reliably estimated.
That being noted, however, there are a growing number of drillholes from across the leases, from areas away from the detailed sampling of the Indicated Resources, where ilmenite grades have been measured using the current sampling and analysis methodology (see the scatter plot in Figure 11‑15 below). To date, of the 63 samples where ilmenite has been measured, only 1 gave a ‘false positive’ where the ilmenite grade was below 2% but the whole rock TiO2 grade was above the 5.75% cut-off (PH374 analyzed by Tronox in 2012, ilmenite grade 1.4%, whole rock TiO2 6.4%).
Figure 11‑15: Comparison of measured ilmenite grade compared to whole rock TiO2 grade for 63 drillholes away from the Indicated Resources
While these results are encouraging, it is still possible that zones of the regional Inferred Resource, yet to be tested using the new ilmenite-based methodology, will not contain the expected levels of ilmenite. Work is ongoing to collect and analyze samples from all areas so that this uncertainty is addressed.
|
11.10
|
Summary of Resource estimates
|
Table 11‑22 summarizes all the Resource estimates for the Project.
Table 11‑22: Compilation of Resource estimations
|
Zone (Model)
|
Resource
category
|
Volume
(m3x 106)
|
Tonnes
(106)
|
HM1,2
|
Ilmenite
|
Titano-
magnetite
|
Whole
rock TiO2
|
Recoverable
TiO23
|
|
MYNM Regional
|
Inferred4,5
|
2,900
|
3,500
|
|
|
|
7.3%
|
|
|
Block A (A5C)
|
Indicated
|
30
|
36
|
11%
|
4.8%
|
5.2%
|
7.7%
|
3.7%
|
|
Block E1 (E1E)
|
Indicated
|
28
|
34
|
14%
|
4.9%
|
8.4%
|
7.5%
|
4.5%
|
|
Block A (A5C)
|
Inferred5
|
67
|
80
|
|
|
|
7.7%
|
|
|
Total4
|
Inferred & Indicated
|
3,000
|
3,600
|
|
|
|
7.3%
|
|
Notes:
|
1.
|
HM is the ‘Heavy Mineral’ fraction of the Resource, particles between 45µm and 1mm, denser than 2.8g/cm3.
|
|
2.
|
All grades are expressed as in-situ grades.
|
|
3.
|
Recoverable TiO2 is that contained in the HM.
|
|
4.
|
The MYNM Regional Inferred estimate and the Total are rounded to two significant figures, as appropriate for Inferred Resources.
|
|
5.
|
On the basis of sampling and comparison assays done to date it is estimated the Inferred resources contain between 4 and 5% ilmenite.
|
|
6.
|
A cut-off grade of 2% ilmenite has been applied where the ilmenite grade is known, otherwise whole rock TiO₂ of 5.75%
|
|
11.11
|
Resource Estimates Conclusions and Recommendations
|
QP opinion on MRE
The Qualified Person has prepared the Mineral Resource estimates in this study using newly acquired data, supplemented with a limited quantity of historically acquired data. By its nature, the Alto Paraná mineralization style is consistent across large areas. In the opinion of the QP, the drill samples obtained are representative of the mineralization, and the laboratory processes applied to the drill samples emulate the likely processing steps for the minerals in future processing plants. Estimates for the Indicated Resources therefore have a high level of confidence for all aspects of volume, tonnage, mineralogy and grade.
For the much larger Inferred Resource zones, most areas depend on whole rock titanium analyses rather than direct measurements of ilmenite grade. While there is a moderately strong correlation between whole rock titanium and ilmenite grades in all areas tested to date, in the view of the QP, Resources defined using whole rock TiO2 grades can only be classified as Inferred. The QP notes that work is on-going to conduct in-fill sampling and obtain new analyses for these regional zones.
The QP has reviewed the data upon which the MRE are based and is of the opinion that the procedures and systems employed to collect and manage this information meet industry best practice. The QP is of the opinion that the supporting data are representative and adequately support the geological interpretations and estimates to the level of classification assigned.
Levels of uncertainty
Within the Indicated Resources zones, grades and thickness of mineralization vary smoothly, and little variation is expected with either grades or volumes when future in-fill drilling is completed. The bulk density factor is based on thorough testing completed in 2023, and while bulk density samples still need to be taken across the Indicated Resource zones, sampling to date shows only minor variability across large areas of the Project.
In the view of the QP, the two areas of greatest uncertainty regarding the Resources within the Project are: the ilmenite grades within Inferred Resources with moderate- to high- grade whole rock titanium values, and the minor-element chemistry of the ilmenite in both the Indicated and Inferred Resources. Both of these unknowns are being addressed with on-going in-fill drilling and new laboratory analyses.
On consideration, the QP believes that the levels of uncertainty with the Resource estimations are adequately reflected in the classification of Mineral Resources for the Project.
Recommendations for further work
Approximately 200 drillholes are required to upgrade sufficient Inferred Resources to Indicated category and confirm at least 20 years of smelter feed for the base case option. Drilling should generally continue at the current 400 meter x 400 meter spacing, although with minor infill drilling to confirm geostatistical variability at smaller scale.
New bulk density samples will be taken from across the Indicated Resource areas using large diameter auger drilling. Approximately 18 of these drillholes will also be used to generate representative bulk samples for processing testwork. Exploration drilling should continue across the Project area to define other ilmenite deposits, with careful attention to the relative levels of the important impurity elements including aluminum, magnesium, manganese and vanadium.
[Remainder of page intentionally left blank]
|
12.0
|
Mineral Reserves Estimates
|
No Mineral Reserves have been generated.
The proposed mine will be developed by open pit hydraulic mining methods using a retreating panel mining concept, with progressive rehabilitation of mined-out areas. Production schedules have been produced for the base case option with Block A being mined first with the mining and concentrator relocated to Block E1 in year 18. The schedules target the production of 286,000tpa of smelter feed and a maximum annual mining rate of 6.5 million tonnes per annum.
The stretch case mine production schedule assumes two mining and concentrator operations working in parallel producing HMC that is processed at a common MSP located adjacent the slagging plant. The stretch case production schedule targets 950,000tpa of smelter feed. The eastern mining operation and concentrator will be located on Block A and have a nominal mining rate of 12.0 million tonnes per annum. The western mining operation and concentrator will be located on Block E1 and will begin operations one year after eastern operations have commenced. The western operation will also have a nominal mining rate of 12.0 million tonnes per annum. Additional slurry and water pumping capacity is added to each operation as the active mining areas move further from the concentrator.
|
13.1
|
Geotechnical analysis
|
Hatch (2014) conducted a geotechnical assessment of slope stability for open pit mining methods using the following assumptions:
|
●
|
A conservative undrained shear strength of 60kPa for the undrained laterite layer;
|
|
●
|
No slip surfaces are expected to penetrate the lower (‘bedrock’, saprolite and weathered basalt) units beneath the mining pit;
|
|
●
|
The phreatic surface is likely to be near the laterite/saprolite interface; and
|
|
●
|
For seismic conditions, a Peak Ground Acceleration of 0.02g was assumed for the site.
|
Under all proposed mining methods, the minimum factor of safety was 1.3 for drained conditions in a single-pass mining configuration, with all of the other conditions having better factor of safety estimations. Hatch’s conclusion (2014) for slope stability was as follows: “Results of the stability analysis indicated that for the planned mining configurations, cut slopes of 45° will satisfy the stability requirements.”
The geotechnical investigations will be included in a later phase of the Project to better inform the final site selection and inform the pit designs. As mining pits are relatively shallow and wide, the impact of adjusting the pit wall angles will have minimal impact on the mine inventory.
|
13.2
|
Mining method selection
|
The key attributes of the Alto Paraná deposits that were taken into account when selecting the mining method included:
|
●
|
Continuity of the viable mineralized zones identified for mining;
|
|
●
|
Depth of the water table;
|
|
●
|
Slimes (<45µm particles) composition of the ore;
|
|
●
|
Average thickness of the mineralized zones;
|
|
●
|
Soft ground conditions;
|
|
●
|
Low cost electrical power;
|
|
●
|
Sloped nature of the deposits; and
|
Given the clay-rich ore and the moderately high levels of rainfall throughout the year, it is likely that the driving conditions across the mining bench will be difficult. It is proposed for this study to minimize vehicle movements in the active mining area and take advantage of the high slimes and sloping nature of the deposit by using hydraulic mining.
High clay deposit mineral sand mining operations such as Base Kwale and Tronox KZN Sands employ hydraulic mining methods with great success. Hydraulic mining makes use of water cannons and slurry pumps to mobilize and extract the material in the deposit. This method is a cost effective option for extracting ore when the deposit has a high slimes content, contains little oversize and indurated material and where water is readily available. A further advantage for the application of hydraulic mining is access to low-cost power.
Given these contributing factors, hydraulic mining is considered to be more appropriate than the other mining method alternatives including dredging, truck and shovel, dozer trap, surface miner, bucket wheel excavator, dragline and front end loaders.
Hydraulic mining makes use of water cannons and slurry pumps to mobilize the material in the deposit producing a slurry which then flows along a channel to a sump from which it is pumped to the processing plant. This method is a cost-effective option for extracting ore when the deposit has a high slimes content, has access to low cost power and where water is readily available. The deposit must also have an elevation profile suitable to allow the slurry to be channeled to the slurry pumps.
Heavy mobile equipment is still required to some extent as operations are required for activities such as topsoil removal, pit floor clearing, slurry channel formation, equipment relocation, road formations, tailings contouring and rehabilitation.
|
13.3
|
Base case mine design, mining method
|
The mining design for Block A and E1 uses the following guiding principles:
|
●
|
Topsoil is removed and stockpiled for rehabilitation;
|
|
●
|
Mining will advance in approximately 200 meter wide strips;
|
|
●
|
100 meter wide exclusion zones to be left beside vegetated bosque areas. These buffers can be used for roads, power lines and piping as required;
|
|
●
|
Strips to advance uphill, with the liquified ore slurry flowing downhill to the feed collection sites in well-defined and maintained flow channels;
|
|
●
|
Pit walls to be cut at 45 degrees slope angle; and
|
|
●
|
Pit access roads and pipe corridors to be 13 meters wide with side windrows of 0.7 meter high, 2 meter wide bases, to be located along the inter-strip pillars.
|
Infrastructure and access roads are only required on every second inter-strip pillar. Half of them will have narrow tops, and are only required to keep the mining and tailings areas separate. The resulting pillar losses equate to 7% of the Resource.
The planned WCP site for Block A is located in a barren area east of the center of the Block A Indicated Resource. This site it allows reasonable pumping distances and elevations from the proposed pump-pit locations.
The planned WCP site for Block E1 is located on a low spur on the northern side of the Block E1 Resource. In this location there is minimal runoff from up-slope and although it is not central to the deposit overall, it allows reasonable pumping distances and elevations from the proposed pump-pit locations.
Topsoil
Topsoil is currently planned to be stripped to a depth of 0.5 meters. Although this is greater than typical topsoil stripping requirement of 0.3 meters, the drilling has shown the organic-rich soil layer is generally deeper than 0.3 meters, extending past 0.5 meters. Also, with the emphasis on restoring the agricultural productivity of the land after mining, and the potential for ‘difficult’ substrate materials with the clay tailings, having a good thickness of replaced topsoil will help preserve its agricultural value.
Topsoil can be stripped with a bulldozer if the direct-push distances are not too great. Otherwise, scrapers or a front-end loader and articulated trucks can be used to relocate the topsoil to an area undergoing rehabilitation.
Description of mining
Hydraulic mining uses high-pressure jets of water to dislodge material from an active mining face and transport the material in a slurry form away from the mining face so that it can be pumped to the concentrator. Hydraulic monitors can be remote controlled from a safe distance or manually operated with appropriate safety protocols by personnel skilled at maintaining material flow rates and achieving optimum slurry densities.
The hydraulic mining operation will use three active hydraulic mining monitors and slurry pumps. Experience has shown that an optimum configuration that balances mobility, equipment selection and mining rate is for each gun to mine about 400 tonnes per hour. Drainage channels will be cut into the floor of the active mining area so the newly liberated material can be washed into sumps where the slurry screened and pumped to the concentrator for further processing. As with other in-pit mining and slurrying methods the hydraulic skids, booster pumps sumps, screens and piping need to be relocated to maintain an optimum distance between the water cannons and the mining face. The study assumes the pit floor will require clean-up and dozing to minimize material losses as hydraulic mining loses efficiency once the drainage slopes become too shallow. Smaller pockets of mineralized material may also be dozed into the active hydraulic mining face if this is more efficient than relocating the hydraulic monitors.
Hydraulic mining is a low capital cost option. However, the area to be mined must be amenable to hydraulic mining for the process to work effectively, have a slimes content exceeding 20% and have suitable ground conditions. Given the Project has access to low-cost power and water, is characterized by high slimes and gently sloping topography over the majority of the deposit hydraulic mining has been selected for the study. This will be further investigated in the next stage of Project development during a site hydraulic mining and tailing deposition trials.
The mine panel design has accommodated the hydraulic mining method in order to preserve adequate slopes for the slurry channels back to the collection sump.
Once the HMC has been extracted, the concentrator pumps the tailings and non-valuable sand back to the mining void or to off path storage ponds. Slimes will be deposited in open dams to settle and decant with the sand tailings dewatered and used for dressing walls and roads or mixed into the thickened slimes for co-disposal.
Dozers and front-end loaders and an excavator will be required to assist mining and backfilling operations while a grader, water cart and other ancillary equipment will be required to maintain suitable operating conditions.
Mine dilution
As mining pits are relatively shallow and wide the impact of dilution by waste material is considered very low, and an allowance of 5% has been included. Additionally, as the material outside of the pit shells that is below the economic cut-off grade are known to still contain TiO2, albeit of a lower grade. As the material adjacent to the selected pit shells are not considered to be completely barren, a factor of 75% of the HM grade has been applied to the HM grade of the diluting material.
Recovery factors
A factor of 10% for mining losses has been applied to the production schedule to accommodate for material that remains un-mined or inaccessible. This allows for pit floor waste, ramps, berms and batters required for efficient hydraulic mining.
Tailings handling and backfilling
Tailings handling and backfilling will be a combination of in-pit disposal within the void created by mining and off-path disposal in a standalone tailings storage facility.
Initially the tailings from the concentrator plant will be deposited in an off-path solar drying pond until such time as sufficient volume is available to allow direct deposition of tailings in the mined void as is standard practice in most mineral sand mining operations. This off-path storage time is nominally one year. However, additional time may be required due to the significant proportion of slimes in the Alto Paraná deposits. Returning the tailings directly to the mining void and progressively rehabilitating the ground for the majority of the mines operation significantly reduces the mine closure and rehabilitation costs compared to traditional open pit mining. Upon completion of mining in each block, the tailings stockpile will be contoured, and where required rehandled into the final void, to ultimately rehabilitate the final mining area. Detailed investigations into tailing placement will need to be progressed in the next stage of study.
Production schedules for the base case have been generated for Block A and Block E1. Block A will be mined first with the mining and concentrator relocated to Block E1 early in year 18. The production schedules for the stretch case uses the same guiding principles as the base case at just over three times the mining rate using two mining operations: the eastern mining operation on the Block A, and the western mining operation beginning in Block E1 one year after the eastern mining operation commences.
To convert the Resource model into scheduling blocks, the following steps were taken:
|
●
|
Block E1 model blocks were sub-celled to 20 x 20 x 0.5 meter, with all sub-cells inheriting the model values of the parent cell. For the Block A model 100 meters by 100 meters blocks are used;
|
|
●
|
The top 0.5 meter block was stripped off, representing topsoil; and
|
|
●
|
The blocks lying above the base of the laterite surface were then aggregated vertically to give the total volume and contained ‘ore’ tonnes as well as tonnes of contained elements.
|
No attempt was made to model different benches. For simplicity it is assumed that mining extracts the whole 20 meters x 20 meters block in a single pass for Block E1 and 100 meters by 100 meters for Block A.
Once the scheduling blocks were created they were sorted into a logical sequence that follows the hydraulic mining path described in the previous section with Block A shown in Figure 13‑1 and Block E1 shown in Figure 13‑3. The final mining area of Block A is shown in Figure 13‑3 and the final mining area of Block E1 is shown in Figure 13‑4. These figures use UTM coordinates for WGS 84, Zone 21 J.
Figure 13‑1: Proposed mining path at Block A Indicated Resource
Figure 13‑2: Final mining area outline at Block A
Figure 13‑3: Proposed hydraulic mining paths at Block E1
Figure 13‑4: Final mining area outline at Block E1
Using conservative assumptions for ramp up and smelter feed recovery from the mined material, the production schedule for Block A results in the annual production shown in Table 13‑1. The production schedule has allowed for a progressive ramp up of the mining rate over a one year period.
The production schedule has been calculated based on applying recovery factors to the titanomagnetite and ilmenite in the Resource models to achieve the target smelter feed production of 286,000tpa using a blend ratio of 90% ilmenite and 10% titanomagnetite. An overall recovery number of 87.6% of recoverable ilmenite to the smelter feed has been applied, using an average of 46.7% TiO2 in the smelter feed, to achieve the annual average mining rate required to meet the smelter feed requirement.
Table 13‑1: Block A production schedule
|
Year
|
Volume
Mm3
|
ROM Mt
|
HM%
|
Ilmenite %
of HM
|
Ave
thickness (m)
|
Resource
|
|
Year 1
|
4.24
|
4.82
|
11.8
|
39.1
|
5.3
|
Indicated
|
|
Year 2
|
5.73
|
6.50
|
10.1
|
43.3
|
5.8
|
Indicated
|
|
Year 3
|
5.62
|
6.37
|
11.9
|
39.9
|
5.2
|
Indicated
|
|
Year 4
|
5.65
|
6.40
|
11.0
|
42.8
|
5.5
|
Indicated
|
|
Year 5
|
5.71
|
6.48
|
9.8
|
46.1
|
5.8
|
Indicated
|
|
Year 6
|
5.72
|
6.48
|
10.1
|
46.5
|
6.0
|
Indicated +
Inferred
|
|
Year 7
|
5.29
|
6.34
|
11.9
|
45.9
|
7.7
|
Inferred
|
|
Year 8
|
5.29
|
6.34
|
11.9
|
43.7
|
7.7
|
Inferred
|
|
Year 9
|
4.97
|
6.26
|
11.9
|
41.0
|
7.7
|
Inferred
|
|
Year 10
|
5.12
|
6.46
|
11.8
|
41.0
|
7.0
|
Inferred
|
|
Year 11
|
5.11
|
6.44
|
11.6
|
41.0
|
6.2
|
Inferred
|
|
Year 12
|
5.07
|
6.39
|
11.6
|
40.9
|
6.2
|
Inferred
|
|
Year 13
|
5.07
|
6.38
|
9.7
|
40.7
|
7.2
|
Inferred
|
|
Year 14
|
5.07
|
6.38
|
9.7
|
40.8
|
7.2
|
Inferred
|
|
Year 15
|
5.15
|
6.49
|
9.3
|
50.0
|
6.8
|
Inferred
|
|
Year 16
|
5.16
|
6.50
|
9.1
|
50.0
|
6.6
|
Inferred
|
|
Year 17
|
5.11
|
6.43
|
9.1
|
50.0
|
6.6
|
Inferred
|
|
Year 18 *
|
2.80
|
3.53
|
9.1
|
50.0
|
6.6
|
Inferred
|
| * The concentrator and mining operation will be relocated to Block E1 at the beginning of Year 18. |
Table 13‑2: Block E1 production schedule
|
Year
|
Volume
Mm3
|
ROM Mt
|
HM%
|
Ilmenite %
of HM
|
Ave thickness
(m)
|
Resource
|
|
Year 18 *
|
0.83
|
1.00
|
9.8
|
46.8
|
7.3
|
Indicated
|
|
Year 19
|
4.98
|
5.50
|
15.4
|
36.0
|
7.1
|
Indicated
|
|
Year 20
|
5.46
|
6.55
|
13.8
|
47.0
|
7.2
|
Indicated
|
|
Year 21
|
5.38
|
6.45
|
12.2
|
35.8
|
6.6
|
Indicated
|
|
Year 22
|
5.32
|
6.38
|
12.5
|
34.8
|
7.2
|
Indicated
|
|
Year 23
|
4.50
|
5.40
|
13.6
|
40.1
|
6.7
|
Indicated
|
The combined production schedules and recoverable HM grades of Block E1 and A are shown in Figure 13‑5.
Figure 13‑5: Production profile and HM grade
|
13.5
|
Base case mining fleet, equipment and personnel
|
Heavy mobile equipment is required in the hydraulic mining operation for activities such as topsoil removal, pit floor clearing, slurry channel formation, equipment relocation, road formations, tailings contouring and rehabilitation. As with other in-pit mining and slurrying methods the hydraulic skids, booster pumps sumps, screens and piping need to be relocated frequently to maintain an optimum distance between the water cannons and the mining face.
The study assumes the pit floor will require clean-up and dozing to minimize material losses as hydraulic mining loses efficiency once the drainage slopes become too shallow. Smaller pockets of mineralized material may also be dozed into the active hydraulic mining face if this is more efficient than relocating the hydraulic monitors. The estimated mining fleet requirement is shown in Table 13‑3. The new mining equipment will be purchased during the construction phase, for use by the construction team and will be delivered to the mining department prior to the commencement of mining.
Table 13‑3: Base case mining fleet
|
Equipment
|
Quantity
|
|
Excavator ~75t
|
1
|
|
Dozer
|
1
|
|
Articulated haul truck ~41t
|
2
|
|
Grader
|
1
|
|
Water cart
|
1
|
|
Integrated tool carrier
|
1
|
|
Service truck
|
1
|
|
Light vehicles
|
1 lot
|
|
Lighting tower
|
1 lot
|
The study uses an owner operator model for hydraulic mining and mine support services. The labor requirement includes expatriate superintendents, planners and maintenance engineers for the first three years of operation and local site general and administrative labor, mine planning and engineering, supervisors, operators and trades for the life of the Project. Table 13‑4 shows the average labor requirement over the life of the Project.
Table 13‑4: Base case estimated mining labor requirement
|
Position
|
Quantity
|
|
Superintendent (Ex-pat Year 1 to 3)
|
1
|
|
Mine Planners (Ex-pat Year 1 to 3)
|
1
|
|
Maintenance Engineer (Ex-pat Year 1 to 3)
|
1
|
|
Superintendent
|
1
|
|
Mine Planners
|
1
|
|
Maintenance Engineer
|
1
|
|
Production Supervisors
|
4
|
|
Shift Supervisors
|
4
|
|
Operators
|
24
|
|
Tradesmen
|
12
|
|
Other
|
3
|
Background
To successfully rehabilitate the areas hosting mineralization in a timely and efficient manner, the tailings method applied at Alto Paraná needs to:
|
●
|
Restore the land topography with similar slopes and drainage as the pre-mining state;
|
|
●
|
Ensure the rehabilitated land is stable in the long term and has similar levels of agricultural productivity;
|
|
●
|
To achieve this the tailings fill should have a similar moisture content as when the ore was mined; and
|
|
●
|
Preferably avoid long periods or large areas of ‘open ground’.
|
Given the nature of the tailings, effort will be directed towards dewatering the silt/clay mix to a similar moisture level as the pre-mined ore. Bulk density sampling in 2023 measured moisture levels on 50 LIDAR surveyed excavations totaling 273 tonnes of moist material, extracted from depths between 0.5 meter to 6.5 meter from the natural surface. The average moisture content was 25.3%, with a minimum of 23.1% and maximum of 27.8%. Similar results were obtained from 13 large diameter auger drillholes completed as part of the same program, averaging 25.4% moisture with a minimum moisture content of 22.7% and maximum of 27.9%.
From 2011 to 2015, CIC conducted settling and compaction trials on the tailings slurries produced by the thickener at the pilot plant. Seven meter high concrete columns were established and filled with tailings slurry. By monitoring the settling rates for several years CIC determined that solids consolidation was following a linear trend and would take approximately 3.5 to 4 years to densify to 70–80% solids concentration by weight assuming that the linear trend observed to 775 days continued. However, tailings slurry deposited in a 1.5 meter thick layer in shallow drying cells achieved similar levels of dewatering in six months, or 50% faster than full depth deposition.
This testwork demonstrated that although a ‘traditional’ tailings storage facility (TSF) that allowed the tailings slurry to slowly consolidate over time would work over many years, faster dewatering can be achieved by air drying the tailings, provided they are not too thick. Given the requirement to rehabilitate the mining void quickly, preferably as mining proceeds, the conventional method of treating thickened silt/clay tailings slurry in a TSF may not work, being too slow to achieve the necessary levels of dewatering. Solar drying, by comparison, shows potential, but clearly requires a large and relatively level area.
Other methods for dewatering the tailings silt/clay have potential to increase the rate of dewatering and thereby reduce the area required for temporary tailings storage. The fastest of these methods is the use of decanting centrifuges, whereby the silt/clay slurry is initially dewatered to a target of 60% solids concentration by weight, then placed in low stacks for further air-drying (preferably in the mining void) until it can bulldozed flat and the next layer put on top. As this is a high capital and operating cost option that has not been tested at pilot scale the dewatering of tailings by centrifuges has not been included in this study.
Solar drying
Previous testing has shown that slimes slurries at Alto Paraná can be thickened to 35% solids concentration by weight in a thickener and still pumped with centrifugal pumps. When these slurries are deposited in a storage facility, clear ‘bleed water’ or supernatant water can be decanted as the slurry consolidates to approximately 45% solids concentration by weight after about two weeks, Figure 13‑6.
Figure 13‑6: Consolidating tailings showing bleed water
When the supernatant water has been decanted and the consolidated slurry is allowed to stand in the open drying and densification occurs relatively quickly as shown in Figure 13‑7, with the pilot plant solar drying/shrinkage testing on site showing about three months of drying. Shrinkage cracks develop in the slurry and when these reach the base of the drying cell, the clay tailings become ‘trafficable’ and can be pushed with a bulldozer, to be used either for lifting the drying walls for another round of drying, or to be pushed into the mining void as fill.
Figure 13‑7: Solar drying/shrinkage testing on site showing three months of drying
Figure 13‑8 shows a small silt/clay tailings drying cell at the pilot plant and detail of a clay ‘pillar’ in a drying cell. The depth of the cracks typically marks the depth of ‘firm’ or trafficable material. The numbers on the pilar indicate locations from which moisture samples were extracted in early tailings trials.
Figure 13‑8: 2012 silt/clay tailings drying cell and detail of a clay ‘pillar‘ indicating sample location
Figure 13‑9 shows the solar dried silt/clay tailings being returned to the mining void at the Alto Paraná pilot plant site.
Figure 13‑9: Solar dried pilot plant silt/clay tailings
Initial estimates show that an area of approximately 200ha is required to sustainably manage the direct deposition and solar drying of tailings in the mine void for the 6.5 million tpa mining operation. After a period of settling and consolidation, the tailings will be contoured and capped with the reclaimed topsoil so that agricultural cropping can recommence in the rehabilitated areas.
The beaching angles of the thickened slurries are not well understood yet but given the range of available natural slopes available near the mine and the possibility of changing the shape of the drying cells from square-shaped cells to elongate cells, a variety of beaching angles can be readily accommodated.
SRK Review of proposed solar drying and decanting centrifuges methodologies
SRK Consulting (SRK) of West Perth were engaged by UEC to provide feedback and advice on the tailings management strategy for the Project. Available information regarding the properties of the tailings materials was provided to SRK, along with details of the proposed management strategies including solar drying cells and decanting centrifuges. The SRK report (Moreno & Martin, 2022) comments and recommendations are summarized here:
Although apparently feasible, the tailings management approach proposed by UEC requires a detailed investigation of the properties of the tailings to allow for detailed planning. Future testing should include:
|
●
|
Potential and actual evaporation rates of the tailings to accurately estimate the size of the drying cells and the length of time required for drying cycles;
|
|
●
|
Beaching angles of the tailings slurry to determine the optimum shape and slope of drying cells;
|
|
●
|
Short to medium-term (days to weeks) consolidation behavior of typical tailings slurries, to allow planning of return water volumes;
|
|
●
|
Atterberg Limits testing to estimate the workable target moisture of the tailings for material handling; and
|
|
●
|
Saturated/unsaturated permeability of the tailings slurry.
|
Tailings conclusion and recommendation
The key to managing the silt and clay-rich tailings generated by the Project is to dewater the tailings as quickly as possible, reducing the moisture level to that of the un-mined ore. Previous pilot scale testing (2011-2013) showed the tailings materials can be significantly de-watered using thickeners, and that a short period of solar drying can then be used to dry the resulting tailings materials to the target moisture levels. Measuring the material handling properties of the slurries at different stages of dewatering is critical to developing an overall strategy, as the tailings slurries start as pumpable liquids and end as soft to hard ‘clay pillars’ / ‘clay lumps’ in the drying cells. Although testwork on the tailings materials was conducted during the pilot tests in 2011-2013, the tests were not configured to measure some of the important factors for solar drying. For the next phase of work the testing of tailings material will be conducted under the supervision of experienced consultants, such as SRK, to ensure all critical factors are measured under a range of conditions. Some tests require large volumes of tails slurry to be representative of the final mining process, and so tailings material testing will be planned in conjunction with trial mining and processing tests. The proposed tailings management strategy is flexible and carries minimal risk but requires large-scale testing to demonstrate its feasibility and to provide the necessary information for detailed planning.
[Remainder of page intentionally left blank]
|
14.0
|
Processing and recovery methods
|
The mining and recovery processes proposed are typical of high slimes mineral sands operations throughout the world and apply well known technology. The recovery of the valuable minerals follows the process of hydraulic mining, concentration and mineral separation which is then followed by smelting of the resulting concentrate to generate a high titania slag and HPPI products. Given the elevated slimes levels encountered in the Alto Paraná deposit, the feed preparation circuit at the front of the plant has been specifically designed to accommodate this.
The ore will be mined using hydraulic mining methods with the resulting slurry pumped to the concentrator, as described in Section 13.0, where the contained minerals are liberated from the clay matrix through a series of scrubbing, desliming, screening and washing processing stages. The deslimed sand will then be pumped into the wet concentrator plant where conventional mineral sands processing equipment is used to separate the valuable minerals from the gangue by exploiting differences in specific gravity producing HMC.
Tailings generated in these processes will be partially dewatered and transported back to the mining area and deposited into an off-path tailings storage facility or back into mining void. An overview of the mining and processing flowsheet for the Project is shown in Figure 14‑1.
The concentrate produced at the WCP containing predominantly ilmenite will be transported to the MSP where it is dried and further separated in the dry magnetic separation circuit to separate titanomagnetite, ilmenite and non-magnetic minerals. The ilmenite is blended to produce a smelter feed which is then smelted in an arc furnace to produce a high titania chloride slag and a high-quality pig iron product.
Reject streams generated in the wet concentration and mineral separation processes are transported back to the mining area and deposited in the off-path tailings storage facility or back into the mining void. Tailings are dewatered to recycle process water reducing the make-up water requirements.
[Remainder of page intentionally left blank]
Figure 14‑1: Alto Paraná Titanium Project flow diagram
Preparation of the plant feed to recover the heavy mineral concentrate involves the following steps:
|
●
|
Direct feeding of the feed preparation plant with hydraulically mined material;
|
|
●
|
Scrubbing of the feed slurry with gravel and sand media to liberate the valuable minerals from the clay;
|
|
●
|
Removal of slimes using hydrocyclones;
|
|
●
|
Screening the scrubber discharge to remove oversize material and recycle the scrubbing media;
|
|
●
|
Gravity separation of the resulting sand to reject low density minerals;
|
|
●
|
LIMS and screening to reject most of the non-ilmenite minerals;
|
|
●
|
Dewatering and stockpiling of sand rejects;
|
|
●
|
Transport of the LIMS non-magnetic concentrate and a portion of the fine magnetic concentrate to the MSP; and
|
|
●
|
Thickening, dewatering and placement of tails.
|
The key assumptions used in development of the process flowsheet and estimation of capital and operating costs for mining and processing at Block E1 are detailed in Table 14‑1. Figure 14‑2 provides a simplified process flow diagram of the concentration process.
Table 14‑1: Concentrator process design criteria Block E1
|
Mass Balance specific items
|
Units
|
|
Base case
parameter
|
|
|
Stretch case
parameter
|
|
|
Dry solids nominal feed rate (nominal)
|
Million tpa
|
|
|
6.5 |
|
|
|
24.0 |
|
|
Plant Availability and utilization
|
%
|
|
|
85 |
|
|
|
85 |
|
|
Dry solids feed (nominal)
|
t/hr
|
|
|
873 |
|
|
|
3,220 |
|
|
Dry solids feed (design)
|
t/hr
|
|
|
900 |
|
|
|
3,400 |
|
|
Average slimes (<45µm ) in feed
|
%
|
|
|
86 |
|
|
|
86 |
|
|
HMC production
|
Million tpa
|
|
|
0.56 |
|
|
|
1.72 |
|
|
Coarse Scrubber retention time
|
minutes
|
|
|
3 |
|
|
|
3 |
|
|
Fine scrubber retention time
|
minutes
|
|
|
10 |
|
|
|
10 |
|
|
Scrubber media to ore ratio
|
%
|
|
|
41 |
|
|
|
41 |
|
|
RED Mags (Ilmenite) recovery to smelter feed
|
%
|
|
|
83 |
|
|
|
83 |
|
|
RED Mags (Ilmenite) TiO2 grade
|
%
|
|
|
48.7 |
|
|
|
48.7 |
|
|
LIMS Mags (Titanomagnetite) recovery to smelter feed
|
%
|
|
|
10 |
|
|
|
10 |
|
|
LIMS Mags (Titanomagnetite) TiO2 grade
|
%
|
|
|
28.6 |
|
|
|
28.6 |
|
|
Make-up water
|
m3/h
|
|
|
870 |
|
|
|
3,050 |
|
|
Thickener underflow solids concentration by weight
|
% w/w
|
|
|
30 |
|
|
|
30 |
|
|
Tailings consolidation concentration by weight
|
%
|
|
|
45 |
|
|
|
45 |
|
Figure 14‑2: Feed preparation plant and wet concentration plant process flow diagram
Feed preparation plant
The base case process flowsheets for the feed preparation plant and the WCP are based on the operating information gained from the original 2012 pilot plant trials updated with the outcome of the 2022/2023 bulk trials at the Alto Paraná site and LDE. For the base case the Block E1 hydraulic mining production schedule of 6.5 million tpa has been used to dictate the feed rate and the mass balance with the base case process described below.
To simplify the feed preparation process from previous project iterations, a pair of parallel coarse and three fine scrubbers are proposed to liberate the minerals from the clay matrix, an improvement from the eight parallel processing lines of blungers and classifiers described in the 2012 and subsequent study reports.
Figure 14‑3: Feed preparation plant
Hydraulic mining makes use of water cannons and slurry pumps to mobilize the material in the deposit which then flows along a channel to a sump from which it is pumped as a slurry to the processing plant. As the deposit may contain large or indurated clay lenses and root matter, a trash screen will be used in-pit to prevent oversize material from entering the pumping system and potentially blocking or damaging the pump or pipeline.
Two parallel scrubbers have been selected to achieve the target residence time of three minutes for the coarse scrubbing stage. The Coarse Scrubbers will contain basalt gravel between 5 and 20mm in size to assist with the liberation of the clay matrix and release of the coarse and heavy minerals. Once the slurry has passed through the scrubbers it will be discharged over a multi deck screen to remove oversize material and separate the scrubber media from the slurry. The scrubbing media will be washed with water while on the screen to assist with the liberation of clay and minerals and to prevent the build-up of fine material in the scrubber circuit. The washed scrubbing media, oversize clay balls and larger composite particles will be recirculated back into the coarse scrubber. Basalt gravel will be added periodically to maintain the correct ratio of media in the scrubbers.
The coarsely scrubbed ore slurry will be diluted with additional process water and partially deslimed by hydrocyclones between the coarse and fine scrubbing stages. The primary desliming stage will greatly reduce the water and fine solids loading on the downstream processing stages while minimizing the loss of ‘recoverable’ valuable heavy minerals. Removing the slimes at this point also reduces unnecessary production of finer material. The titanomagnetite and ilmenite lost at this stage that is finer than 45µm is considered to be unrecoverable, and has no value as this cannot be used in the smelter, as explained in Section 11.0.
The slurry is further scrubbed in the fine rotating scrubbers with 1 to 5mm silica sand or fine basalt to liberate smaller composite particles and remove some of the surface contaminants. Three parallel scrubbers are required to achieve the target residence time of 10 minutes. Slurry from each of the scrubbers will be discharged over a dedicated multi deck screen to remove oversize material and separate the scrubber media from the ore slurry. The scrubbing media will be washed and returned to the scrubber. Silica sand or basalt will be added or removed periodically to maintain the correct ratio of media in the scrubbers.
The finely scrubbed ore slurry is diluted and deslimed by hydrocyclones following the fine scrubbing stage to remove the silt and clay components and reduce the water loading on the downstream gravity separation stages. The cyclone overflow streams are directed to the tailings thickener where flocculant is added and the solids are separated from the process water. The cyclones will be operated such that the cut point is close to 45µm to optimize the clay separation and valuable mineral recovery.
Approximately 80% to 85% of the feed mass is rejected at the scrubbing and desliming stage which primarily comprises the non-valuable clay minerals and unrecoverable fine heavy minerals. The remaining 15% to 20% of the mass is processed in the gravity circuit to recover the heavy minerals.
Wet concentration plant
The deslimed slurry is pumped to a Constant Density (CD) tank from which the flowrate and density of the slurry being fed to the spirals in the gravity circuit can be carefully controlled. The spirals separate low density gangue from high density valuable minerals, rejecting the non-valuable lighter minerals and concentrating the heavier ilmenite and titanomagnetite minerals. Lighter minerals rejected at this stage are directed to the sand tailings stackers and dewatered.
The HMC will be further processed using wet LIMS and screen to separate a portion of the titanomagnetite-rich stream for blending at the smelter. The coarse titanomagnetite is rejected as the stream contains a higher level of impurities. The LIMS non-magnetic, ilmenite-rich stream, is dewatered and stacked with the titanomagnetite screen undersize in preparation for road transport to the mineral separation plant (MSP).
The tailings can either be returned to the mine void or used for building roads or embankments. The gravity concentration requires three stages.
Figure 14‑4: Wet concentration plant
The sand tailings streams from the wet concentrator circuit are pumped to the tails stacker cyclone where the solids are stacked and allowed to further dewater. The cyclone overflows are directed to the tailings thickener.
Front end loaders will reclaim the stacked HMC and load it onto covered transport trucks for the 67km journey from the Block A concentrator to the smelter site at Hernandarias, or the 100km journey from Block E1.
Tailings handling and water recovery
The deslime cyclone overflow will be directed to the tailings thickener where the solids are settled and separated from the process water. The recovered water overflows from the thickener into the process water pond to be reused in the scrubbing and desliming stages. Pumps at the edge of the process water dam will withdraw water and deliver it to the scrubbing and desliming cyclone stages of the process.
Thickener underflow is pumped directly to the tailings area. This is allowed to dry and then capped with topsoil reclaimed from the stockpiles. Stockpiled sand tailings are removed periodically to be used in building tailings dam embankments and in-pit roads.
Concentrator make-up water
The majority of the water used in the process will be recycled through the thickener and re-used in the scrubbing and deslime cyclone stages at the front end of the process. Process water that is mainly lost to the fine tailings will be replenished from bores and recovered from surface water collections outside of the plant. The general cycle of water and solids is shown in Figure 14‑5.
Fine tailings from the thickener will be pumped to the storage areas at 30% solids and stacked in layers 1.5 meters high. When these slurries are deposited in a storage facility, supernatant water can be decanted as the slurry consolidates to approximately 45% solids concentration by weight over a period of two weeks. It has been assumed that 80% of supernatant water is recovered and returned to the process plant for use in the scrubbing sections. Water released from the tailings after consolidating to 45% is assumed to be lost to evaporation or infiltration.
Figure 14‑5: Alto Paraná Project water cycle
|
14.2
|
Mineral separation plant
|
The HMC containing predominantly ilmenite will be trucked from the concentrator to the MSP which is located adjacent to the slagging plant. The HMC will be dried using an electrically heated dryer, supplemented with heating from combusting the smelter off-gas, to remove the remaining moisture in the HMC. A two-stage magnetic separation process will then separate the smelter feed from the gangue minerals unsuitable for smelter feed.
The ability to stockpile and blend increases the flexibility to control the smelter feed chemistry, and ultimately the slag chemistry, to meet market requirements. The unused proportion of minerals will be returned to the mine void. Smelter feed will be stockpiled in covered storage buildings.
Figure 14‑6: Mineral separation plant schematic
The basic assumptions used in development of the process flowsheet and estimation of capital and operating costs for the MSP are detailed in Table 14‑2.
Table 14‑2: MSP process design criteria
|
Mass Balance specific items
|
Units
|
|
Base case
parameter
|
|
|
Stretch case
parameter
|
|
|
HMC plant feed
|
tph
|
|
45 |
|
|
150 |
|
|
Feed moisture concentration by weight
|
%
|
|
6 |
|
|
6 |
|
|
TiO2 in Smelter Feed blend
|
%
|
|
46.7 |
|
|
46.7 |
|
|
Ilmenite recovery to smelter feed
|
%
|
|
88 |
|
|
88 |
|
|
Mass split to non-mag rejects
|
%
|
|
2 |
|
|
2 |
|
|
Smelter Feed production
|
tpa
|
|
286,000 |
|
|
952,000 |
|
|
Proportion of dryer energy from smelter off-gas
|
%
|
|
50 |
|
|
80 |
|
Overview
The base case ilmenite slagging plant comprising the feed preparation plant, smelter, slag processing plant and iron treatment plant has been designed around a single furnace sized to deliver 150,000tpa of 86% TiO2 slag from the expected smelter feed. The high titania slag from this furnace is cooled and crushed in the slag plant to produce chloride grade slag averaging 129,000tpa and chloride fines averaging 21,000tpa. The tapped iron is treated at the iron treatment plant producing HPPI. The slag and iron products are stored at the smelter site before being transported to the harbor for further storage before shipping to customers. This high-level process is displayed in Figure 14‑7.
The design criteria for the slagging process are presented in Table 14‑3.
Table 14‑3: Slagging plant process design criteria
|
Mass Balance specific items
|
Units
|
|
Base case
parameter
|
|
|
Stretch case
parameter
|
|
|
Smelter feed
|
tpa
|
|
|
286,000 |
|
|
|
952,000 |
|
|
Feed moisture concentration by weight
|
%
|
|
|
0 |
|
|
|
0 |
|
|
TiO2 in smelter feed
|
%
|
|
|
46.7 |
|
|
|
46.7 |
|
|
Slag production
|
tpa
|
|
|
150,000 |
|
|
|
500,000 |
|
|
TiO2 eq in slag
|
%
|
|
|
86.0 |
|
|
|
86.0 |
|
|
TiO2 recovery to slag
|
%
|
|
|
97 |
|
|
|
97 |
|
|
Reductant fixed carbon
|
%
|
|
|
85 |
|
|
|
85 |
|
|
Reductant (t/t of smelter feed)
|
t/t
|
|
|
0.128 |
|
|
|
0.128 |
|
|
Slag yield from smelter feed
|
%
|
|
|
52.5 |
|
|
|
52.5 |
|
|
Iron yield from smelter feed
|
%
|
|
|
33.7 |
|
|
|
33.7 |
|
|
Yield to Chloride slag
|
%
|
|
|
86.0 |
|
|
|
86.0 |
|
Figure 14‑7: Slagging plant process flow diagram
Furnace
The design for the furnace is based on both pilot-scale testwork conducted by Mintek in 2012 and TZMI modelling. The mass balance and process flow of the furnace from the base case model is shown in Figure 14‑8. Details on the smelter trials conducted at Mintek in 2012 are contained in the Hains (2012) Preliminary Economic Assessment. No additional smelting testwork has been conducted since then.
Figure 14‑8: Furnace process flow diagram
The furnace will be fed with the ilmenite-rich smelter feed and anthracite, a carbon source, to produce a metal and slag product according to the chemical formula:
FeTiO3 (s) + C(s)  M3O5 (l) + Fe (l) + CO(g) where M= Ti, Fe
Energy is introduced into the furnace via three electrodes to maintain a bath temperature of between 1,650 and 1,700°C.
Anthracite, the reductant, is first dried after it is recovered from the anthracite stockpile to remove any excess moisture. The drier is air heated with either electrical resistance heating or using cleaned furnace off-gas.
The off-gas is evacuated from the furnace, scrubbed, compressed and may be temporarily stored in a gas holder before being flared to atmosphere. A portion of this gas will be used as an energy source in the MSP for drying concentrate and in the smelter feed preparation for anthracite drying.
The slag and iron separate in the molten bath due to their different densities and are then removed from the furnace via separate tap holes. While the slag is tapped into rail mounted slag cars, the iron is tapped into a refractory lined ladle.
Based on the expected feed composition from the metallurgical testwork in Section 10.0, the energy requirements and product chemistry for both the slag and iron products were estimated using an ilmenite smelting model. The results of this simulation are presented in Table 14‑4.
Table 14‑4: Predicted smelter product chemistry
|
Slag Chemistry
|
|
Mass %
|
|
Iron Chemistry
|
|
Mass %
|
|
|
TiO2(eq)
|
|
|
86.0 |
|
Fe
|
|
|
97.6 |
|
|
TiO2
|
|
|
51.7 |
|
C
|
|
|
2.0 |
|
|
Ti2O3
|
|
|
30.9 |
|
Ti
|
|
|
0.08 |
|
|
FeO
|
|
|
10.5 |
|
Si
|
|
|
0.04 |
|
|
SiO2
|
|
|
1.73 |
|
Al
|
|
|
0.01 |
|
|
Al2O3
|
|
|
1.87 |
|
Ca
|
|
|
- |
|
|
CaO
|
|
|
0.09 |
|
Mg
|
|
|
- |
|
|
MgO
|
|
|
1.70 |
|
Mn
|
|
|
0.03 |
|
|
MnO
|
|
|
1.0 |
|
V
|
|
|
0.03 |
|
|
V2O5
|
|
|
0.46 |
|
Cr
|
|
|
- |
|
|
Cr2O3
|
|
|
0.02 |
|
P
|
|
|
0.03 |
|
|
P2O5
|
|
|
0.002 |
|
S
|
|
|
0.20 |
|
|
Na2O
|
|
|
0.02 |
|
|
|
|
|
|
|
K2O
|
|
|
0.05 |
|
|
|
|
|
|
|
Total
|
|
|
100.0 |
|
Total
|
|
|
100.0 |
|
Slag processing
The general flow of slag processing is shown in Figure 14‑9. The slag cars, with slag tapped from the furnace are moved to an initial cooling area. Here it is allowed to cool, which allows for the formation of an outer crust. When this crust is sufficiently formed, the slag can be tipped from the car in a secondary cooling area, where it is sprayed with water until the entire block is both solid and sufficiently cool for further handling.
Figure 14‑9: Slag plant process flow diagram
Once the slag is completely cooled, it is placed on the grid of a feed bin and broken with a rock-breaker until all the slag pieces pass through the grid. From the feed-bin the material is crushed in a jaw crusher and then fed to a mill that operates in closed circuit with a vibrating screen. The undersize of the screen (-1mm) is fed to the classifiers to separate the chloride slag and chloride fines product.
The chloride slag is transferred via a conveyor belt to a storage silo while the fines are transferred pneumatically to a separate chloride fines silo. From these silos, the products are transferred into trucks and transferred to the port for storage before shipping.
Iron treatment
The iron from the furnace is tapped into a refractory lined ladle and transferred to the iron treatment station. At the station, the chemistry of the iron is adjusted to specification by pneumatically injecting reagents such as silicon carbide into the iron via a lance. A refractory lined hood is placed over the ladle to prevent splashing. The iron treatment process is depicted schematically in Figure 14‑10.
Figure 14‑10: Iron treatment process flow diagram
Once the chemistry of the iron has been adjusted to meet specification, and before the iron is too cold, the ladle is transferred to the casting station where the molten iron is cast into iron ingots on a casting strand. The iron pigs fall from the end of the casting strand into a temporary bay where they are cooled before being moved by front-end loader to storage bays. From these bays, the pig iron is loaded into trucks and transferred to port for storage and shipping to customers.
Waste products from the smelting operation will be backloaded onto the concentrate transporters and disposed of in the mine void.
Storage, transport and shipping
The iron and slag products are stored temporarily onsite before being transported to the port facilities by road. The slag products will be transported in closed trucks to keep the products dry. The chloride fines will be conditioned with moisture (to approximately 5%) to prevent dust during handling. The trucks will be loaded directly from the silos and will off-load into sheds at the port. The pig-iron will be loaded into open-top trucks with a front-end loader at the smelter site and will off-load into open bays at the port.
The products will be hauled for 360km by a transport contractor from the slagging plant in Hernandarias to a storage facility in San Antonio, Asunción. The product storage and barge loading facility will be located in the City of San Antonio, adjacent to Asunción, with easy access from National Road Accesso Sur.
The base case transport solution proposed assumes river transport on the Paraguay River from Asunción to the Río de la Plata where the products will be unloaded at an ocean port or directly transhipped into the customer's vessel. Anthracite and other consumables will be brought in via the reverse journey. The barge journey from Asunción to the Río de la Plata is approximately 1,600km depending on the transhipping or ocean port location.
|
14.4
|
QP opinion of the process method selected
|
The unit processes of hydraulic mining, feed preparation, concentration, mineral separation and ilmenite smelting are found in a number of operations worldwide. While the individual parts of the mining and extraction process that have been proposed for the Alto Paraná are not unique the arrangement of these processes to adequately process the high slimes Alto Paraná deposit, extract the valuable minerals and produce high titania slag and HPPI is unlike any other current mineral sand operation worldwide.
The previous Project owners completed a pilot plant in 2012 which included a test mine and the construction of a pilot plant to demonstrate the feasibility of deagglomerating, desliming and concentrating of the Alto Paraná heavy minerals. This pilot program produced 108 tonnes of ilmenite-titanomagnetite-magnetite concentrate which was subsequently smelted in South Africa to produce a high titania slag and a pig iron product. This work is described in detail in the Alto Paraná 2012 PEA (Haines, 2012).
The 2022 and 2023 testwork has sought to improve the desliming and concentration stage of the previous flowsheet with additional testwork using processes and equipment more common to mineral sands. As the front end of the current process including the scrubbing and cyclone desliming is different to the previously proposed blungers and hydro separators the new process has been tested on bulk samples demonstrating a process flowsheet that is suitable for extracting the ilmenite and titanomagnetite minerals from the Alto Paraná feed.
The subsequent stages of project development will undertake additional laboratory scale and pilot plant trials to determine the optimum equipment selection for desliming the scrubber discharge slurry including cycloning and screening. Additionally, pilot scale tests on bulk samples from all established geometallurgical zones will provide additional design data to allow for a robust concentrator process flowsheet and design.
[Remainder of page intentionally left blank]
The Project will require substantial infrastructure in the form of water supply, upgraded local roads, electrical supply, maintenance workshops, export facilities and administrative and employee service facilities. The requirements for the base case are briefly discussed below. Capital and operating costs associated with these infrastructure requirements are detailed in Section 18.0 of this TRS.
UEC’s Alto Paraná Project is located in eastern Paraguay in the departments of Alto Paraná and Canindeyú and the center of the property is located approximately 100km northwest of Ciudad del Este. The proposed mining operation for the base case will begin in the center of Block A Indicated Resource. This study has included allowances to extend the powerline and access roads and relocate the mining operation, feed preparation plant and wet concentrator plant to the northern side of Block E1 where mining will continue in year 18.
Figure 15‑1: Site locations with roads and powerlines shown
Additional property is required for the slagging plant which is proposed to be located 15km northwest of Hernandarias and 25km northwest of Ciudad del Este. This location is close to existing high voltage powerlines and major transport corridors while having clear separation from populated areas. Figure 15‑1 shows the proximity of Block E1 to the smelter site, Hernandarias and Ciudad del Este.
|
15.2
|
Site access and logistics
|
The HMC will be transported in bulk by road by a haulage contractor to the MSP in Hernandarias. The distance by road from the WCP in Block A to the MSP, shown in Figure 15‑1, is approximately 67km. The distance from Block E1 to the MSP is an additional 33km.
Block E1 mine and wet concentrator plant
The study has initially allowed for the upgrading and sealing of 5km of existing property access roads from Minga Pora to the Block A Mine and Process Plant so that the road is suitable for heavy vehicles and all weather use. The remainder of the transport route to Hernandarias is along the Supercarretera Itaipu which is a two way highway of reasonable quality. Additional 25km of road is required to access the Block E1 concentrator in year 18 as shown by the amber dashed lines in Figure 15‑1.
The HMC will be hauled by a transport contractor from the wet concentrators to the MSP in Hernandarias.
Figure 15‑2: Supercarretera Itaipu between Hernandarias and Minga Pora
Provision will be made for bus transport of employees from Hernandarias to the mine site and smelter site.
The base case transport solution assumes final products are transported by road to a barge port near Asunción, then transported by barge down the Paraguay river to the Rio de la Plata where product barges will be unloaded at an ocean port or directly transhipped into the customers vessel. Anthracite and other consumables will be brought in by the reverse journey.
The shorter transport route through Tres Fronteras with barging along the ‘high section’ of the Paraná River from Tres Fronteras to the confluence of the Paraguay River has not been selected for the base case as this section of Paraná River waterway is subject to transport restrictions and introduces substantial risk to the Project economics if the products cannot be exported. However, this is an option to be re-evaluated in a later study as the Government of Paraguay considers the improvement of the country’s waterway infrastructure a top priority. Improvement projects along the Paraguay- Paraná waterway proposed by the government include dredging, constructing ports, improving navigability and safety, and increasing capacity in terms of vessels, maintenance and services.
Road transport
Road transport will be limited to 25.5 tonnes per truck with all transport of products managed by a third party in-country logistics provider. Due to the large volumes of materials to be moved and the relatively small payload of the road transport vehicles the number of vehicle movements and the fleet size required is reasonably large. The estimated vehicle movements, cycle times and fleet size for the base case are shown in the following tables. The stretch case will require approximately three times the vehicle movements for the increased production.
Rejects from the MSP and solid waste streams from the smelter will be backloaded onto the HMC transporters for disposal back at the mine site. Anthracite will be backloaded into the slag and pig iron transporters as the importing and exporting ports are in close proximity.
Table 15‑1: Road transport vehicle movement summary (base case)
| |
|
|
|
|
|
|
|
|
|
|
|
Cycles |
|
|
|
|
|
| Road transport vehicle movements |
Unit |
|
|
Value |
|
|
|
Year |
|
|
|
Week |
|
|
|
Day |
|
|
Road transport weight limit
|
t
|
|
|
25.5 |
|
|
|
|
|
|
|
|
|
|
|
|
|
|
HMC per year (wet tonnes)
|
tpa
|
|
|
375,500 |
|
|
|
14,882 |
|
|
|
268 |
|
|
|
41 |
|
|
Anthracite
|
tpa
|
|
|
36,600 |
|
|
|
1,435 |
|
|
|
28 |
|
|
|
4 |
|
|
Slag products
|
tpa
|
|
|
150,000 |
|
|
|
5,882 |
|
|
|
113 |
|
|
|
17 |
|
|
Pig iron products
|
tpa
|
|
|
100,000 |
|
|
|
3,922 |
|
|
|
75 |
|
|
|
11 |
|
Addition errors may occur due to rounding.
Table 15‑2: Road transport cycle times (base case)
|
Road transport cycle times
|
|
Distance
(km)
|
|
|
Ave speed
(km/hour)
|
|
|
1 way trip
(hours)
|
|
|
Loading +
unloading (hours)
|
|
|
Road transport Block A to MSP
|
|
|
67 |
|
|
|
65 |
|
|
|
1.0 |
|
|
0.75 |
|
|
Road transport Block E1 to MSP
|
|
|
100 |
|
|
|
65 |
|
|
|
1.5 |
|
|
0.75 |
|
|
Hernandarias to San Antonio
|
|
|
360 |
|
|
|
65 |
|
|
|
5.5 |
|
|
0.75 |
|
An approximate fleet size has been estimated based on transporting goods 12 hours per day, 7 days per week. The fleet size may be reduced if the transport operation runs 24 hours per day or if the road transport weight limit is increased using truck and trailer combinations.
Table 15‑3: Road transport fleet size (base case)
|
Fleet size
(12 hour daylight travel time)
|
Unit
|
|
Vehicles
|
|
|
Road transport Block A to MSP
|
ea
|
|
10 |
|
|
Road transport Block E1 to MSP (from year 18)
|
ea
|
|
14 |
|
|
Hernandarias to San Antonio
|
ea
|
|
28 |
|
Exporting
Outbound freight is a significant cost item due to the land-locked location of Paraguay. For the base case all of the product transport, storage, barge loading, transport and transhipping will be managed by a third party in-country logistics provider. A complete transport cost breakdown has been provided by a reputable in-country contractor for the transport of the final products and imported bulk materials.
Approximately 150,000tpa of high titania slag and 100,000tpa of HPPI will be exported. Weight limits on road transport for 3-axle trucks are allowed up to 25.5 tonnes.
The products will be hauled for 360km by a transport contractor from the smelter site in Hernandarias to a storage facility in San Antonio, Asunción. The product storage and barge loading facility will be located near the City of San Antonio, adjacent to Asunción, with easy access from National Road ACCESO SUR.
Product will be stored until such time as a parcel of product is loaded onto barges and transported along the Paraguay River to the Rio de la Plata. The chloride slag, chloride fines and the pig iron will be loaded onto barges and transhipped onto larger vessels on a free on board (FOB) basis for export to international markets. All products are transported in loose bulk.
Importing
Approximately 36,600tpa of anthracite reductant will be imported as loose bulk. The product will be imported in ocean going vessels and will require unloading or transhipping onto barges for the trip up the Paraná and Paraguay River to be unloaded at San Antonio. The anthracite will require temporary storage while it is progressively loaded onto trucks to be transported to the smelter site in Hernandarias.
Consumables and spares will be transported in containers to be unloaded at Villeta, 30km south of Asunción. The containers will be transported by road to the smelter site in Hernandarias to be unloaded and returned to the river port.
Figure 15‑3: Barge and container unloading on the Paraguay River
Alternative transport options
The alternative option for importing and exporting of goods is along the Paraná River up to Tres Fronteras. The river ports along the Paraná River will be much closer to the smelter with a proposed barge loading site on the southern outskirts of Ciudad del Este at Tres Fronteras on the Paraná River approximately 30km from Hernandarias. Tres Fronteras is 20km south of the Itaipu dam at the border between Paraguay, Brazil and Argentina. There is a risk the Paraná River waterway is at capacity when the Project is developed and will be subject to seasonal variation. Much of the barging capacity on the Paraná River had been reduced in 2021 and 2022 due to droughts in Brazil.
Preliminary discussions with in-country transport providers indicate the increased volumes of the stretch case may justify a dedicated terminal on the Paraná River to reduce the road transport requirements. Overall, the transport unit rates will remain similar to the base case with the decreased road transport costs offset by the amortization of the terminal costs.
Figure 15‑4: Barge loading port on the Paraná River
The connected load for the base case mine and beneficiation plant is 11.8MW while the mineral separation plant and slagging plant is estimated at approximately 55MW. For the stretch case this increases to 41 MW distributed across two mining sites with the power requirements increasing as the pumping distances increase. The stretch case MSP and slagging plant increases this to 158MW. The Paraguayan state-owned generation and distribution company, ANDE, jointly owns and operates the Itaipú and Yacyretá binational hydropower plants. The Itaipú hydropower plant, 20km from the smelter site in Hernandarias, is the largest hydropower plant in the world in electricity generation and the second largest in terms of installed capacity.
High voltage power transmission lines (66kV and 220kV) run through Hernandarias, where the mineral separation plant and smelter are planned, as well as lower voltage local power lines. The Orlando Kue Substation located in the Hernandarias Industrial District provides power to the slagging plant. An allowance has been made in the capital cost estimate to connect into the Orlando Kue Substation along with power distribution lines to the smelter site.
There is a major sub-station located at Itakyry, approximately 20km south of the Project pilot plant site connecting the 220kV and 66kV power lines from the Itaipu dam. A 500kV line is currently under construction and will follow the right-of-way of the 220kV line. A small substation and powerline from Minga Pora to the Block E1 concentrator plant has been allowed for in the capital cost estimate. It is estimated that approximately 28km of overhead power line will be required to connect the Block E1 concentrator to the ANDE power grid.
Early discussions with in-country consultants have indicated that there is adequate power capacity in the Alto Paraná region for the base case and stretch case.
|
15.5
|
Buildings and workshops
|
Equipment warehouses, workshops and maintenance facilities will be required for the mine and beneficiation plant mobile equipment, WCP, MSP and smelter. As the local availability of significant major equipment repair facilities is limited, provision has been made for investment in workshops and spare parts warehouses at the concentrator and smelter sites.
Product transport equipment including trucks and barges will be maintained off-site by the transport contractor.
Office space for administrative and support staff as well as laboratory space will be required for both the beneficiation plant and the smelter. Provisions have been made for canteen and change room space at the beneficiation plant and the smelter.
Perimeter fencing will be required for the beneficiation plant and slagging plant. Security gate houses, ambulance bays and first aid clinics will be required.
|
15.6
|
Site based analytical facilities
|
Allowance has been made for a basic on-site laboratory with analytical services at the mine and concentrator site. This laboratory will provide basic in-fill drilling sample analysis, process control and analytical data to support the operation for the mine and wet concentrator. Any complex or non-routine analysis will be sent to the smelter laboratory for analysis.
Allowance has been made for an advanced laboratory with analytical services at the slagging plant. These services will provide detailed sample analysis, process control and analytical data to support the operation for the smelter and provide additional support for the mine and wet concentrator laboratory.
Deep bores are required to produce make-up process water replacing the water lost to tailings, products and evaporation.
Water is recovered in the concentration plant by thickening and dewatering the tailings as well as recovering the supernatant water recovered from the tailings consolidation therefore reducing the amount of make-up water to be abstracted by the bores.
Given the concentrator’s proximity to Hernandarias and a number of smaller settlements, the mining and processing operations will not require a separate accommodation camp for the work force.
[Remainder of page intentionally left blank]
The Project will produce two primary products – a high titania slag used predominantly as a feedstock in titanium dioxide pigment manufacture (and sometimes titanium metal production), and a high-purity pig iron (HPPI) product for foundry and steel use. Both products command premium prices in their respective markets and have seen prices rallying to record highs in recent years. Aspects of the markets for both products produced by the Alto Paraná smelter operation are discussed in the following sections. The TiO₂ feedstock (slag) market assessment was completed by specialists at TZMI while the pig iron market assessment was based on a report provided by Maia Research (Maia), an international market research and consulting company.
|
16.1
|
Titanium feedstock market overview
|
According to TZMI, titanium feedstocks are characterized by two primary product chains: TiO2 pigment and the titanium metal sector with TiO2 pigment production accounting for almost 90% of global titanium feedstock consumption. Titanium metal manufacture is the second primary feedstock consumer and accounts for around 7% of global consumption.
Because the TiO2 pigment industry consumes most TiO2 feedstocks, feedstock demand has been historically linked to the TiO2 pigment market. TZMI estimates global demand for titanium feedstock in the TiO2 pigment sector will grow at 2.6% Compound Annual Growth Rate (CAGR) between 2022 and 2030.
With the chloride-based pigment process expected to outgrow the sulfate-based process in the future and the structural supply constraint in the natural rutile segment, TZMI forecasts that the market share of chloride slag for the pigment industry will likely to grow from an estimated 16% in 2022 to 24% in 2030, as shown in Figure 16‑1.
Figure 16‑1: Demand by individual feedstock for the TiO2 pigment end-use
Source: TZMI (March 2023 estimates)
TZMI’s analysis of TiO₂ feedstock markets shows that without the successful commercialization of new projects, the market is projected to enter into a supply deficit position from 2025 to 2030, reflecting the progressive ore depletion in some existing operations in Africa and Australia.
Chloride slag
Chloride slag is anticipated to be a key beneficiary of the long-term structural deficit in natural rutile in supplying high-grade feedstock to chloride pigment producers. According to TZMI’s March 2023 estimates, overall demand for chloride slag is projected to grow at 7.7% CAGR in TiO₂ pigment end-use markets, increasing from 1.6 million TiO2 units in 2022 to 2.7 million TiO2 units by 2030. The TiO2 pigment end-use will lead this growth in volume terms, underpinned by chloride pigment capacity expansion in China, as well as other Western pigment producers switching from supply constrained feedstocks to chloride slag.
Demand attributed to titanium sponge end-use is also expected to show growth, but at a slower rate compared to the TiO2 pigment segment, with most of this growth concentrated in China given the planned sponge capacity growth.
Without likely new supply contribution, the market is projected to contain brief periods of supply/demand imbalance, particularly in 2026 and 2030 with the deficit positions projected at around 125,000 TiO₂ units and 300,000 TiO₂ units respectively. The change in market balance during the forecast period reflects largely the cycle timing of the TiO2 pigment sector. TZMI is of the view that new chloride slag supply will be required from 2029/2030 to ensure demand growth in this sector can be sustained.
Chloride fines and sulfate slag
In chloride slag manufacture, a proportion of the final slag product (approximately 15%) will be produced as a sulfate grade TiO₂ feedstock due to its fine particle size and will need to be sold as a feedstock for sulfate pigment production. This product is generally referred to as chloride fines.
According to TZMI’s March 2023 analysis, global supply of the two products, sulfate slag and chloride fines, is expected to fall 14% year-on-year in 2023, as TZMI expects Rio Tinto to scale back its sulfate slag output at Rio Tinto Fer et Titane (RTFT) in Canada in response to the demand slowdown in the TiO2 pigment market. In addition, Chinese sulfate slag production is expected to decline in line with the demand reduction in the domestic market as pigment producers favor the use of ilmenite to increase copperas output. Chloride fines output, on the other hand, is negatively impacted by the scheduled maintenance outage at Eramet TTI facility in Norway, which saw the facility being suspended for a period of 2.5 months during 1H 2023.
Incremental supply growth is expected from 2024, in line with the recovery in global sulfate pigment output. The global sulfate slag/chloride fines market is projected to tip into a deficit position from 2027.
|
16.2
|
Alto Paraná product quality review
|
The composition of the slag produced by smelting the Alto Paraná ilmenite was estimated by TZMI using a proprietary ilmenite smelter model. The predicted chemical analysis of the Alto Paraná slag is shown in Table 16‑1.
Table 16‑1: Alto Paraná slag as chloride slag
|
Chemical
analyses
|
|
Alto Paraná slag
(%)
|
|
|
TiO₂ (eq)
|
|
86.0 |
|
|
FeO
|
|
10.5 |
|
|
SiO₂
|
|
1.7 |
|
|
Al₂O₃
|
|
1.87 |
|
|
CaO
|
|
0.09 |
|
|
MgO
|
|
1.7 |
|
|
MnO
|
|
1.0 |
|
|
V₂O₅
|
|
0.46 |
|
|
Cr₂O₃
|
|
0.02 |
|
|
P₂O₅
|
|
0.002 |
|
|
U+Th (ppm) *
|
|
<40
|
|
* Uranium and thorium assays based on previous studies.
Chloride slag
The smelter feed is very low in uranium and thorium. The smelter simulation shows the resulting slag is very low in chrome and calcium. The slag composition from the smelter modelling, however, indicates elevated magnesium with an MgO level of 1.7% in the slag, which will likely attract a price discount. The exceptionally low levels of calcium, chrome, uranium and thorium in the smelter feed and subsequently in the resultant slag may provide opportunities for chloride pigment producers to blend the Alto Paraná slag product with lower quality alternative feedstocks.
Based on the indicative quality of the Alto Paraná slag, TZMI is of the view that the slag would be better suited as a blend feedstock in the chloride pigment production process due to elevated levels of MgO and low levels of other key impurities. Alternatively, the Alto Paraná slag could be sold to pigment producers who are able to process feedstocks with elevated levels of MgO.
From a pricing perspective, TZMI estimates the Alto Paraná slag would achieve a long-term price of US$1,025 per tonne FOB, inclusive of applicable discounts and premiums based on the expected quality of the slag.
Chloride fines
TZMI assessed the quality of the slag for the chloride fines market and concluded that the TiO₂ content, at 86.0% is in line with commercially available chloride fines products. The expected contaminant concentrations are either at or below acceptable levels compared to the other chloride fines products in the market.
Based on the indicative specifications, the Alto Paraná slag will be suitable as a feedstock for sulfate pigment production.
From a pricing perspective, TZMI estimates the Alto Paraná chloride fines would achieve a long-term price of US$720 per tonne FOB, inclusive of applicable discounts and premiums.
|
16.3
|
Potential offtake opportunities for Alto Paraná products
|
Chloride slag
China is an obvious target market given its rapidly increasing chloride pigment capacity. The Alto Paraná slag would present an attractive alternative feedstock to Chinese chloride pigment producers.
North America is also a potential market for the Alto Paraná chloride slag. Given the supply constraint of natural rutile and chloride ilmenite in the longer term, future chloride pigment output growth will likely be underpinned by chloride slag.
Chloride fines
The sulfate pigment industry in Brazil is a potential candidate for chloride fines offtake given its proximity to the Project. With the depletion of ilmenite output from local sources in Brazil, there could be scope for increased chloride fines consumption by the local sulfate pigment plant.
With its vast sulfate pigment capacity base, China would also be a logical target market for the Alto Paraná chloride fines. Annual chloride fines consumption in China is expected to increase over the long term on the back of increased sulfate pigment output and the increasing adoption of higher-grade feedstocks in the blend to maintain environmental compliance.
|
16.4
|
HPPI market overview
|
HPPI that is co-produced with high titania slag, participates in the global market for merchant pig iron (MPI).
MPI is produced in three main grades:
|
●
|
foundry, or hematite pig iron.
|
The by-product from the production of titania slag is HPPI grade, low manganese pig iron, which is sold for specialty foundry applications, particularly for automotive parts. This iron generally commands a price premium compared to standard blast furnace (basic) pig iron.
HPPI or nodular pig iron is differentiated from other types due to its low manganese, low phosphorous and low sulfur content. Nodular pig iron constitutes the principal ferrous raw material in the production of ductile (also known as nodular or spheroidal graphite) iron castings. It is anticipated that the pig iron produced at Alto Paraná would be of this grade.
According to a Research Analysis by Maia conducted at the end of 2022, the growth in demand for pig iron is expected to accelerate over the next six years (from 2022), increasing by 9.7% to 2028. This growth is a result of demand for renewable energy infrastructure, which requires foundry products, and the infrastructure program announced by the US.
Pricing dynamics with long term forecast price
The price of HPPI is primarily determined by the cost of production of basic pig iron by non-mineral sands industry operations. The main cost drivers for these operations are raw material costs (e.g. reductant) and energy costs. The rising costs of both factors, exacerbated by the invasion of Ukraine, has led to higher HPPI prices. While any conclusion to the Ukrainian war is expected to reduce upward pressure on prices, continued high cost of energy is expected to keep prices above historic levels.
The historical and forecast price for both the standard and special (nodular) pig iron is shown in Figure 16‑2.
Figure 16‑2: Historical and forecast HPPI price
Source: Maia
The quality of the pig iron from Alto Paraná is expected to be close to that of special (nodular) pig iron which has been used as the basis for the pricing assumption. A discount to the special grade has been applied to account for the fees of agents, pig iron distributors and/or any grade variations. The long-term price for Alto Paraná pig iron is assumed to be US$747 per tonne (real 2022 dollars), which is a 10% discount to the Special HPPI grade.
Marketing for the stretch case
Based on TZMI analysis, global demand for chloride slag is expected to show continued growth underpinned by chloride pigment and titanium sponge output growth in China. The global chloride slag market is expected to reach 2.7 million TiO₂ units (~3.2 million tonnes of chloride slag) by 2030. With the Project’s planned output of ~425,000 tonnes of chloride slag per year for the stretch case, this will equate to approximately 13% of the market. There is ample opportunity to blend with other slag products if needed on the basis that the slag produced by the Project is competitively priced. Notwithstanding the MgO in the planned slag product from the Project is above preferred limits, history has demonstrated that pigment producers are able to tolerate higher levels of impurities at times when feedstock supply is tight, so the limits are more likely to be ‘negotiable’ rather than absolute thresholds.
There are relatively few chloride slag production opportunities such as Alto Paraná which benefits from a large resource in close proximity to a green, low-cost power source. Based on TZMI analysis, the small-scale slag producers in high power cost jurisdictions rarely show R/C ratios much above 1, largely due to the requirement to import ilmenite combined with high power costs. The low carbon footprint of the Project will also likely be an advantage and an important consideration for some investors and offtake partners in the future.
No contracts are in place for product sales, raw materials supplies, transport or other services currently. Preliminary discussions have been held with various service providers in respect of inbound and outbound freight and product offtake agreements. No details on these discussions are currently available.
[Remainder of page intentionally left blank]
|
17.0
|
Environmental studies, permitting and social and community impact
|
|
17.1
|
Overview of ESG aspects
|
Mining and wet concentration
Mining and primary processing will initially be conducted on the Block A lease area located in the Itakyry district of Alto Paraná province. The Block A lease covers approximately 12km x 15km and consists mainly of cropped fields, with scattered bush and forest areas, bosques, villages and infrastructure corridors. Topsoil removal, hydraulic mining of the ore and then backfilling with tailings will be the major mining activities. These activities will necessitate the construction of haul roads, tailings facilities, water bores, water storage dams, pipelines, power lines, buildings and other mining infrastructure.
Key environmental and social aspects to be considered for the construction and operation of the mine are highlighted below.
Land use and habitat
The mine will be located in an area that is currently used primarily for production of rotational crops including soybean, wheat and corn. During construction and operation of the mine, the potential for soil erosion and ground loss will be considered and mitigated, and the removal of existing vegetation carefully managed.
The potential for contamination of the land from construction and mining activities, specifically by fuel and oils, will be mitigated. Rehabilitation and restoration of the land will have the objective of re-establishing crops with landforms and drainage closely approximating pre-mining conditions.
Existing forest and scattered bush areas within the potential development area are characterized by high numbers of plants species and trees. Wildlife diversity is comparatively high in the area, according to the Pilot Plant EIA. Baseline establishment and understanding of existing habitat resources will be necessary to provide adequate protection and mitigation planning. At present, forest areas are confined to bosque areas outside of the development footprint, however, the post mining landscape may impact on these areas due to changes in topography and drainage.
Road transportation from Hernandarias may require road upgrades, possible bypass roads and construction of a dedicated mineral warehouse at San Antonio prior to barge loading. It is anticipated that road upgrades will not have a major impact on land use if current corridors are upgraded. If significant new road construction is required, then an assessment of land use and habitat impacts will need to be incorporated into the Environmental and Social Impact Assessment (ESIA) terms of reference.
Air and water
The major air quality issue associated with mining activities is dust and its potential impact on farming operations in the surrounding areas. Fugitive dust emissions from mobile equipment need to be assessed and mitigated as much as possible. It is noted, however, that the proposed hydraulic mining method will cause minimal dust and vehicle movement compared to alternative methods.
The mining area is in the Paraná River Basin, and information on precipitation, evapotranspiration, and groundwater resources in the area is available. Project water use in relation to available groundwater supply must be assessed. Aquifer groundwater quality in the immediate mining area will need to be determined and the potential impacts of releasing this water back into the soil evaluated.
Evaluation of wastewater discharge options will be required, following guidance from Paraguay Environmental Protection Standards. This could include sewage, processing water and mine dewatering discharge. Drainage sumps might be required to ensure adequate quality of run-off water.
GHG emissions, both direct and indirect, will be evaluated. Preference will be given to options that conserve energy or use energy efficiently. Renewable power will be included as an important environmental element of the Project.
Socio-economic impacts
An important concept regarding the proposed mining operations is that they will only affect an area temporarily. Planning for final rehabilitation commences before the first ore is mined. Topsoil will be carefully conserved and then replaced on mined out areas as soon as possible. Mining in any given location might disrupt agriculture for four to six years, but as soon as possible the substrate below the topsoil will be replaced, landforms will be restored with original slopes and drainage patterns, and topsoil will be replaced so that cropping and farming can continue as before. Much of the mining activity takes place in a ‘moving window’ where activities are confined within a relatively small area.
There are five farms directly affected by the planned mining and processing of ore in the initial mining area at Block E1 Santa Maria. Potential impacts on these landowners will be carefully assessed. In similar situations, affected farmers can profitably lease the land for mining and continue with normal farming activities on land unaffected by mining. Alternatively, farmers are often given the option to sell their properties to the mining company at an above-market rate and retain an option to buy it back again at a reduced price after mining is complete. Typically as well, directly affected farmers and nearby communities are given preference for employment in the mine or processing plant.
The potential impacts of an influx of workers for mine construction will be assessed as a socio-economic element, although this is a strictly temporary impact.
Roads are currently used for grain transportation and traffic can be particularly heavy at harvest times. An increase in transportation activity by road and waterway will increase the associated health and safety risks. Associated dust and noise will also be considered in this context. The potential benefit of increased employment and improvements to the transportation systems should also be assessed.
Separation and smelting facilities
Processing facilities will include a MSP and smelter at a site near Ciudad del Este. The key environmental elements associated these facilities include air quality, water quality and possible noise emissions.
Emissions that could have an impact on air quality would include process emissions or combustion source emissions. Emissions sources will include point sources (stacks and vents) and non-point source fugitive emissions. Air quality emission standards or ambient air quality guidelines would typically be used to assess the potential impact of the processing facilities. Establishing criteria may require an assessment of internationally recognized standards such as the World Bank’s International Finance Corporation or the World Health Organization.
Worker and community exposure to elevated levels of airborne compounds associated with production of concentrates, slag and pig iron, will need to be specifically evaluated.
Energy efficiency and GHG emissions should also be a key element considered in the assessment of processing facilities. Industrial and domestic (sewage) wastewater will be key elements assessed according to the laws of Paraguay.
Transportation and logistics
The most significant transport corridors from Paraguay to an ocean port are along the Paraguay and Paraná Rivers. The Project will use a combination of road and barge transportation to deliver the slag and pig iron products to an ocean port or direct transhipping in the Río de la Plata.
The base case logistics option currently being evaluated is transporting the products by truck from Hernandarias to San Antonio in Asunción, and barging product to an ocean port via the Paraguay River. Anthracite and other consumables will be brought in via the reverse journey.
Water course impacts
Barge traffic is currently well developed along the Paraná Paraguay Waterway (PPW) and the potential impacts on the watercourse, such as fuel or product spills, would need to be evaluated and managed according to International Maritime Organization standards as the PPW is treated as an international watercourse for navigation.
|
17.2
|
Regulatory environment
|
Lead review and approval agency
MADES is the governing body responsible for enforcement of Law No. 294/93 Environmental Impact Assessment and regulatory decree.
The terms of reference for an ESIA are issued by MADES based on input and request by a Project proponent. From the time of receipt of the request and questionnaire, MADES has 90 days to issue the ESIA Terms of Reference (ToR).
Scope of ESIA
The purpose of the ToR, as described below, is to provide an initial indication of the requirements of the ESIA. The ToR described below is preliminary and would need to be finalized following meetings with the Paraguayan environmental authorities upon or prior to the Project notification or prior to it. The ESIA process must cover at least the following steps:
|
●
|
Conduct an ESIA ToR and Scoping Study for submission to the authorities;
|
|
●
|
Identification of potential impacts based on the Project proposal and conduct specialist studies;
|
|
●
|
Comprehensive baseline assessment of the affected areas, which must include baseline monitoring of identified areas and parameters including water quality and air quality;
|
|
●
|
Compilation of an Environmental Management Plan (EMP) that covers both the construction and operational management of impacts identified during the ESIA. The EMP must also include a plan for decommissioning of the facilities, including rehabilitation;
|
|
●
|
Conduct a Public Participation Process that complies with the environmental regulations and guidelines and satisfies the international standards mentioned above;
|
|
●
|
Identification of other permits or licenses required to operate the facility, as well as cost estimates to apply for these permits and licenses are to be included in the ESIA process; and
|
|
●
|
An independent review of the ESIA.
|
ESIA schedule
A preliminary high level schedule for the ESIA process in Paraguay is shown in Table 17‑1.
Table 17‑1: Preliminary high-level ESIA schedule.
|
ESIA step
|
Time required
|
Cumulative time
Elapsed
|
|
Prepare request to MADES for terms of reference for ESIA
|
Completed prior to initiation of ESIA Process
|
0 months
|
|
MADES Prepare Terms of Reference for ESIA
|
3 months
|
3 months
|
|
Prepare ESIA
|
12 months
|
15 months
|
|
MADES Review ESIA
|
9 months
|
24 months
|
|
Project Specific Permitting including water use and discharge, air emissions
|
3 – 6 months
|
The following steps have been identified for the next phase of the Project:
|
●
|
A review of the advantages and disadvantages of separating Project components into different ESIAs. Such a review should include a review of the schedule and identification of where opportunities may be enhanced through expediting certain components.
|
|
●
|
An open dialogue with Paraguayan regulators should be initiated as soon as possible.
|
|
●
|
The approach to assessment and approval of the ESIA with MADES should be collaborative. Due to the lack of previous mining projects of this nature, MADES staff may lack experience in mining ESIA’s. Training and information sharing sessions should be included throughout the process.
|
|
●
|
Permitting requirements and their relation to ESIA approval should be defined and accounted for in the schedule.
|
|
●
|
Flexibility should be considered in the permitting approach including provisions for Project phasing or early works for certain construction components.
|
|
●
|
A community engagement plan is necessary.
|
Preliminary stakeholder identification
Due to the large scale and complex nature of the Project, stakeholder engagement and management will form a key component of a successful environmental authorization process. Early identification of stakeholders and detailed planning in terms of engagement and interaction will be required prior to the start-up of any regulatory assessment process. Table 17‑2 and Table 17‑3 lists the preliminary stakeholders identified as potentially having an interest in the Project.
Table 17‑2: Government stakeholders (preliminary)
|
Name
|
Classification
|
Area of interest
|
|
Paraguay National Departments Government
|
Paraguay Government
|
Entire Project and its national benefits
|
|
Local municipality sectors and departments (Alto Paraná District)
|
Paraguay Government
|
Local benefits and impacts
|
|
Secretariat of the Environment (local and national)
|
Paraguay Government
|
Environmental and social licensing
|
|
Dirección de Recursos Minerales (DRM, Directorate of Mineral Resources)
|
Paraguay Government
|
Direct and indirect Project aspects
|
|
Ministerio de Obras Públicas y Comunicaciones (MOPC, Ministry of industry and commerce)
|
Paraguay Government
|
Direct and indirect Project aspects
|
|
Paraná Paraguay Waterway Administration
|
Multi-government
|
Transportation route
|
|
Argentina or Uruguay Transport Authorities*
|
Argentina/Uruguay Government
|
Export terminal and waterways
|
* Only required if transhipping from barge to ocean vessel is not used.
Table 17‑3: Non-Government stakeholders (preliminary)
|
Name
|
Classification
|
Area of interest
|
|
Residential Organizations and groupings at the 4 nodes of activity
|
Private
|
All aspects of social development and impact
|
|
Local directly affected residents
|
Private
|
All aspects of social development and impact
|
|
Local farmers associations/organizations
|
Private
|
All aspects of social development and impact
|
|
Paraguayan Agricultural Development (PAD)
|
Private
|
Farming and agricultural impacts
|
|
Alter Vida
|
NGO
|
Agriculture, human rights, social development and environment
|
|
Kolping Foundation
|
NGO
|
Agriculture, human rights, social development and environment
|
|
OIPIC
|
NGO
|
Agriculture, human rights, social development and environment
|
|
Sociedad de Estudios y Culture Popular
|
NGO
|
Agriculture, human rights, social development and environment
|
|
Fundación Marco Aguayo de Lucha Contra el sida
|
NGO
|
Agriculture, human rights, social development and environment
|
|
17.4
|
External (Argentina or Uruguay) regulatory environment
|
Paraguay is a landlocked country and exports will have to cross a neighboring country to gain access to a seaport. The most significant transportation corridor from Paraguay to a seaport is along the Paraguay and Paraná Rivers to the ports of Rosario, San Nicolas, or Camapan, which can handle ocean going vessels.
Currently barge transportation on the Hidrovia System or PPW carries agricultural products and iron ore to ocean ports. There are restrictions on the river usage in terms of barge string sizes, barge sizes and operating hours. There are also restrictions on free movement of barges between countries but presently this does not seem to be a major risk as barges are moving freely between the above countries.
The major regulatory requirements for Project components in Argentina would be centered around the PPW. A recent project development proposal on the PPW that crossed multiple countries (Brazil, Paraguay and Argentina) determined that an ESIA was not required as there was no new infrastructure. If a new terminal is required, with bulk loading and off-loading facilities along the PPW, then it is likely that a separate ESIA would be required. At this stage, however, it is envisaged that minimal, if any, new infrastructure will be required in the Rio de la Plata area for trans-shipment of products.
|
17.5
|
Mine closure requirements
|
No definitive mine closure requirements are contained within current mining law. Current laws do not establish any percentage or insurance policies for the recovery or closure of mining areas. What is established is an insurance policy on the 10% investment commitment established by law at the beginning of each year of permit or concession, to cover any breach of the companies with respect to the investment committed.
Aside from the requirements noted in this section, there are no known environmental, socio-economic, regulatory, legal, political or other issues which could potentially affect the development of the Project.
The proposed mine will be developed by open pit methods using a retreating panel mining concept, with progressive rehabilitation of excavated areas minimizing the open area and cost of rehabilitation at the end of the mine life. Progressive rehabilitation of excavated areas will use backfill from tailings, followed by recontouring using recovered topsoil material. Rehabilitation and restoration of the land will, wherever possible, have the objective of re-establishing crops. Final mine closure and rehabilitation costs are assumed to be offset by the scrap value of the plant.
|
17.6
|
Environmental conclusions
|
Gaining approval for the proposed Project requires a fairly standard environmental authorization process, commencing with discussions with MADES, who oversees the social and environmental approval process, to set the terms of reference for the ESIA. Adequate planning and preparation are required to ensure there are no delays in either the approval process or in the planned construction sequence.
Many upfront activities including baseline studies, communication plans and steering committees can commence quickly to help avoid delays.
Growing awareness of the risks associated with GHG emissions mean that energy efficient projects, especially those utilizing renewable hydroelectricity, such as the Project, will become preferred ‘green’ alternatives when sourcing feedstocks for titanium products and iron metal for ductile iron castings. The combination of hydro-electric power, efficient mining and processing methods, and economical river-based transport logistics result in the delivery of high titania slag and iron metal products with lower associated GHG emissions than comparable suppliers.
GHG emissions for the Project have been calculated following the guidelines set out in the Australian National Greenhouse accounts factors document (National Greenhouse Accounts Factors: 2021 published by the Department of Industry, Science, Energy and Resources) and other relevant internationally accepted publications.
Scope 1, Scope 2 and limited Scope 3 emissions are included in the comparison. Direct, or point-source, emissions (Scope 1) that are produced within the boundary of an organization as a result of that organization’s activities and indirect emissions from the generation of the electricity purchased and consumed (Scope 2) have been included in the calculation. The emissions are calculated from the beginning of mining until the point of product loading on the customer’s vessel.
TZMI has positioned the Project onto the TZMI industry GHG curve showing how the carbon dioxide equivalent (CO2e) per tonne of final products compares to other ilmenite smelters included in the analysis. As expected, the Project is well placed on the left side of the chart shown in Figure 17‑1, with less than half the expected GHG emissions of the next most efficient producer. The TZMI industry GHG curve that is used in the comparison has been produced as part of the annual Feedstock Cost Study Report published by TZMI. The Feedstock Cost Study reviews the costs, revenue, production and Scope 1, Scope 2 and limited Scope 3 (feedstock transport only) GHG emissions data for producers across the titanium feedstock sector with 36 operations included in the 2022 study.
For the comparisons with other operations the GHG Protocol ‘Technical Guidance for Calculating Scope 3 Emissions (Version 1.0)’ has been used to define the Scope 3 Category 4 Emissions (upstream) included for the transport of ilmenite purchased from one operation to be beneficiated at another location. For example, ilmenite produced at Eramet’s Grande Cotê mine and smelted at the TiZir Titanium & Iron facility will incorporate the GHG emissions resulting from the seaborne transport of the ilmenite from Senegal to Norway. All other Scope 3 Categories are excluded, such as shipping products to the final customer.
The ‘final products’ in the comparison are considered to be sold FOB from five smelters and include slag and pig iron as well as ilmenite, leucoxene, rutile and zircon if these are also produced.
Hydraulic mining, electric drying of concentrates, low reductant consumption in smelting and efficient transport logistics are the main reason the CO2e per tonne of product is so low compared to other smelters, including those that benefit from hydropower.
Figure 17‑1: GHG emissions comparison for selected western smelters
[Remainder of page intentionally left blank]
|
18.0
|
Capital and operating costs
|
Capital and operating cost estimates for the base case and the stretch case have been developed using the mine production schedule, process flowsheet and mass balance information generated following the testwork program completed at LDE in 2022/2023. Due to the preliminary level of understanding of the Project the capital costs are based on preliminary equipment selections, equipment suppliers budget quotations, indicative estimates from local engineers and data from the TZMI in-house database of costs, plus certain allowances. The capital cost estimate can be considered to have an overall accuracy band of ±50%.
In the majority of cases the operating costs are based on modelled consumptions and costs provided from in-country providers. Where specific cost data has not been obtained data from previous projects or studies have been factored to suit the throughput and location of the Project. It has been assumed that the product haulage, barge transport and transhipping will be undertaken on a contract basis; all labor is local drive-in-drive-out; and sufficient power is available from the Paraguay's state-owned utility, ANDE.
All costs are in United States dollars with a base date of mid-2022.
Rehabilitation will be an ongoing process through the life of mine and the final mine closure and plant site rehabilitation costs are assumed to be covered by the salvageable value of the plant at the end of the mine life.
The capital cost estimate for the base case and the stretch case projects have been summarized into the major processing areas and are shown in Table 18‑1. The basis and inclusions for these areas are outlined in the following sections. Cost estimates for each of the mining and processing areas have been developed assuming local material suppliers and fabricators where used. Total capital estimates have been checked by factoring major cost areas from previous studies and projects of a similar scale.
Table 18‑1: Total project capital cost summary
|
Description
|
|
Base case
US$’000
|
|
Stretch case
US$’000
|
|
Direct costs
|
|
|
|
|
|
|
|
|
|
Total Mining Equipment
|
|
|
17,400 |
|
|
|
47,650 |
|
|
Total Wet Concentrator Plant
|
|
|
52,190 |
|
|
|
156,810 |
|
|
Total Mineral Separation Plant
|
|
|
10,310 |
|
|
|
24,340 |
|
|
Total Slagging Plant
|
|
|
150,360 |
|
|
|
385,770 |
|
|
Total Infrastructure
|
|
|
7,620 |
|
|
|
30,100 |
|
|
Total direct costs
|
|
|
237,880 |
|
|
|
644,670 |
|
|
Indirect costs
|
|
|
|
|
|
|
|
|
|
EPCM
|
|
|
35,680 |
|
|
|
96,700 |
|
|
Spares Allowance
|
|
|
5,360 |
|
|
|
15,870 |
|
|
Contingency (25%)
|
|
|
59,470 |
|
|
|
161,200 |
|
|
Total CAPEX
|
|
|
338,390 |
|
|
|
918,440 |
|
* Costs are rounded to the nearest US$10,000. Rounding errors may occur.
Several contracting strategies are available, however it is most likely that an Engineering, Procurement and Contract Management (EPCM) consultancy with experience in South America will be awarded the overall engineering, procurement and construction contract. A standard allowance of 15% of the direct costs has been factored into the capital cost estimate for EPCM costs.
Capital cost estimates have been generated based on a nominal feed rate of 6.5 million tonnes per annum for the base case and combined 24 million tonnes per annum for the stretch case. The flowsheet was developed from the current metallurgical testwork and is based on similar high slimes mineral sands operations. Where possible the Project capitalizes on recent developments of modular plants in order to reduce onsite construction costs and allow for future relocation. The WCP will be located at the mine site initially in Block A with the WCP relocated to Block E1 once the Block A mine has been exhausted. The relocation and extension of the access road and powerline in the base case has an estimated cost of US$27.3 million including 25% contingency. There is no relocation required in the stretch case.
The MSP will be adjacent to the slagging plant in Hernandarias and share common infrastructure where possible. The flowsheet for the MSP has been developed from the 2022 metallurgical testwork data and simplified MSP operations.
The slagging plant capital estimates have been developed using a standard concept level estimating methodology and includes the design, procurement, management, construction and commissioning of the feed preparation, furnace, molten product handling, iron processing and slag processing operations. The project wide infrastructure packages include the roads and power supply that have been estimated using local rates provided by in-country consultants during the course of the study. The length and path of the power lines detailed in Section 15.0 Infrastructure and the roads have been estimated using up-to-date maps and proposed plant locations. It has been assumed the design and construction of these packages will be allocated to experienced contractors either through the EPCM contractor or directly by the owners.
Due to the limited mine life expected at Block A the concentrator and mining equipment will be designed to be relocatable with minimal interruption to the supply of concentrate to the MSP and slagging plant. A plant relocation will be required approximately 18 years after the commencement of mining at Block A with the concentrator and mining operation being relocated to Block E1.
Contingency
Contingency is an allowance for items, conditions or events whose outcome is uncertain, but experience has shown is likely to occur and will result in additional costs. A contingency of 25% has been applied to the capital cost typical for an estimate of this accuracy.
Capital cost exclusions
Cost of land purchases for the fixed plant is assumed to be outside of the financial evaluation at this stage of the Project. The compensation paid to landowners in the mining area is included as an operating cost.
The following is a list of areas not covered in the capital cost estimate because they are either typically provided for by the Project owners or are outside the scope of this study:
|
●
|
all permits and licenses;
|
|
●
|
environmental assessments and approvals;
|
|
●
|
project interest and financing costs.
|
The estimated operating costs for the mine, concentrator plant, slagging plant and product transport were developed by TZMI after taking account of the projected production tonnages and costs factors as detailed in this report. The operating cost estimate for the base case has been summarized into major cost areas as shown in Table 18‑2, and the stretch case as shown in Table 18-3, with the basis and inclusions for these areas outlined below.
Labor rates used in development of the operating costs are based on current local rates provided by UEC and in-country advisors. Equipment maintenance and operating costs are derived from the TZMI database and similar projects and adjusted for local labor, consumable, power and fuel costs. Costs for senior expatriate staff expected to be required in the early years of operation of the mine, WCP, MSP and slagging plant operation are estimated based on the TZMI database costs for expatriate staff for similarly sized operations.
The accuracy range for the operating cost estimate is ±50%. All costs are in US dollars as of the mid-2022. The life of mine averages for the base case are based on 23 years for mining and WCP and 24 years for MSP and slagging plant operation.
Table 18‑2: Base case operating cost plus sustaining capital summary
|
Item
|
|
LOM Average
US$ million pa *
|
|
US$/tonne mined
|
|
US$/tonne slag **
|
|
Mining and rehabilitation
|
|
|
8.20 |
|
|
|
1.30 |
|
|
|
57.20 |
|
|
Wet concentrator
|
|
|
15.20 |
|
|
|
2.40 |
|
|
|
105.70 |
|
|
HMC transport
|
|
|
2.00 |
|
|
|
0.30 |
|
|
|
14.20 |
|
|
Mineral separation
|
|
|
3.00 |
|
|
|
0.50 |
|
|
|
21.70 |
|
|
Slagging plant
|
|
|
41.90 |
|
|
|
7.10 |
|
|
|
303.70 |
|
|
Admin & marketing
|
|
|
3.60 |
|
|
|
0.60 |
|
|
|
26.10 |
|
|
Transport, storage, barging, ship loading
|
|
|
18.00 |
|
|
|
3.10 |
|
|
|
130.80 |
|
|
NSR royalties
|
|
|
1.30 |
|
|
|
0.20 |
|
|
|
9.80 |
|
|
Sustaining capital
|
|
|
5.90 |
|
|
|
1.00 |
|
|
|
43.10 |
|
|
Total
|
|
|
99.10 |
|
|
|
16.50 |
|
|
|
712.30 |
|
* Costs are rounded. Rounding errors may occur.
** Life of mine average slag production is 138,000 tonnes per annum taking account of the ramp up and downtime for furnace relines.
The life of mine averages for the stretch case are based on 22 years for mining, WCP and MSP and 23 years of slagging plant operation.
Table 18‑3: Stretch case operating cost plus sustaining capital summary
|
Item
|
|
LOM Average
US$ million pa *
|
|
US$/tonne mined
|
|
US$/tonne slag **
|
|
Mining and rehabilitation
|
|
|
29.40 |
|
|
|
1.30 |
|
|
|
63.20 |
|
|
Wet concentrator
|
|
|
49.50 |
|
|
|
2.20 |
|
|
|
106.30 |
|
|
HMC transport
|
|
|
7.10 |
|
|
|
0.30 |
|
|
|
15.30 |
|
|
Mineral separation
|
|
|
5.60 |
|
|
|
0.30 |
|
|
|
12.00 |
|
|
Slagging plant
|
|
|
130.80 |
|
|
|
6.20 |
|
|
|
293.50 |
|
|
Admin & marketing
|
|
|
7.60 |
|
|
|
0.40 |
|
|
|
17.00 |
|
|
Transport, storage, barging, ship loading
|
|
|
58.30 |
|
|
|
2.70 |
|
|
|
130.80 |
|
|
NSR royalties
|
|
|
4.50 |
|
|
|
0.20 |
|
|
|
10.10 |
|
|
Sustaining capital
|
|
|
14.80 |
|
|
|
0.70 |
|
|
|
33.10 |
|
|
Total
|
|
|
307.60 |
|
|
|
14.30 |
|
|
|
681.30 |
|
* Costs are rounded. Rounding errors may occur.
** Life of mine average slag production is 446,000 tonnes per annum taking account of the ramp up and downtime for furnace relines.
Mine operating costs were estimated taking into account landowner compensation, pre-stripping of topsoil, hydraulic mining, equipment relocation, labor, power, dried tailings contouring, topsoil return and rehabilitation. The mining and mobile equipment operating cost assumes an owner operator model for hydraulic mining as very few experienced mining contractors currently operate in Paraguay.
The WCP operating cost is based on experience with similar size concentrators with a high clay content and a requirement for scrubbing. The operating cost includes; local grid power, labor, maintenance, water abstraction, technical services, administration and overhead costs. Tailings treatment costs have been estimated based on the volume of slimes thickened and pumped for solar drying. The HMC will be transported in bulk by road by a haulage contractor to the MSP in Hernandarias.
The MSP will be located adjacent to the slagging plant. The operating cost includes local grid power, dryer power assuming a 50% split between smelter off gas and electrical power in the base case increasing to 80% smelter off-gas for the stretch case; labor, maintenance, technical services and overhead costs. Rejects from the MSP and solid waste streams from the slagging plant will be backloaded onto the HMC transporters for back filling the mine void.
Operating costs for the slagging plant were estimated using data from smelter simulations in conjunction with first principal cost estimates, historic database costs and scaled or adjusted costs based on comparisons with existing smelter operations. The operating cost includes local grid power, reductant, electrodes; labor, maintenance, consumables associated with iron treatment, makeup water, furnace refractories, technical services, administration, marketing costs and overhead costs.
Outbound freight is a significant cost item due to Paraguay’s land-locked nature. For both cases all of the product transport, storage, barge loading, transport and transhipping will be managed by a third party in-country logistics provider. Figure 18‑1 shows barges being loaded with pig iron while Figure 18‑2 shows barge transport of loose bulk materials.
Sustaining capital costs for the mine, concentrator plant and slagging plant are incorporated into the cashflow projections. Sustaining capital costs are based on periodic replacement of major equipment with the sustaining capital calculated as a percentage of the direct capital costs. Plant relocations, for the base case, and the extension to slurry and water pumping systems, in the stretch case, are also included.
Figure 18‑1: Pig Iron loading into barges
Source: Terminales Portuarias S.A.
Figure 18‑2: Barge transport of loose bulk materials
Source: Terminales Portuarias S.A.
Royalty payments
The Alto Paraná Titanium Project is subject to 1.0% net smelter returns (NSR) royalty payable to CIC.
The economic analysis of the Alto Paraná Titanium Project is reliant on the project schedule, mine schedule, capital and operating costs discussed in the previous sections of this TRS. This study is preliminary in nature and includes Inferred Mineral Resources that are considered too speculative geologically to have modifying factors applied to them that would enable them to be categorized as Mineral Reserves, and there is no certainty that the results of this economic assessment will be realized. All costs are in United States dollars with a base date of mid-2022.
The proposed project concept has an initial design capacity of approximately 150,000 tonnes per annum high titania slag and 100,000 tonnes per annum of HPPI based on a single furnace plant as a base case. Given the large world class Resource, a further stretch case sensitivity has been developed with a design capacity of 500,000 tonnes per annum high titania slag and 320,000 tonnes per annum of HPPI, based on two mining and concentrator operations and multiple furnaces. Four economic models were prepared for the study:
|
1)
|
Base case including 70.7 million tonnes of Indicated (47%) and 80.3 million tonnes of Inferred Resources (53%).
|
|
2)
|
Base case including 70.7 million tonnes of Indicated Resources only.
|
|
3)
|
Stretch case including 70.7 million tonnes of Indicated Resources (14%) and 444.7 million tonnes of Inferred Resources (86%).
|
|
4)
|
Stretch case including 70.7 million tonnes of Indicated Resource only.
|
The economic evaluation was prepared using the standard discounted cashflow methodology (DCF) on the following basis:
|
●
|
Unleveraged (pre-finance);
|
|
●
|
Dollars are reported on a real basis with the base date of Mid-2022;
|
|
●
|
Revenue is recognized in the year of production with a production-sales off-set of three months.
|
|
19.2
|
Key economic model assumptions
|
The key input assumptions for the economic analysis are shown in Table 19‑1.
Table 19‑1: Key economic model assumptions
|
Assumption
|
Units
|
|
Value
|
|
|
Utilities estimate
|
|
|
|
|
|
|
Power cost
|
US$/kWh
|
|
0.041 plus VAT
|
|
|
Fuel cost
|
US$/liter diesel
|
|
|
0.75 |
|
|
Market prices
|
|
|
|
|
|
|
Alto Paraná chloride slag
|
US$/t
|
|
|
1,025 |
|
|
Alto Paraná chloride fines
|
US$/t
|
|
|
720 |
|
|
Alto Paraná HPPI
|
US$/t
|
|
|
747 |
|
|
General
|
|
|
|
|
|
|
NSR Royalty
|
%
|
|
|
1.0 |
|
|
Depreciation rate
|
%
|
|
|
15 |
|
|
Corporate tax rate
|
%
|
|
|
10 |
|
|
Discount rate (real)
|
%
|
|
|
8 |
|
Tax and royalty assumptions
The QPs have relied on the following information supplied by UEC in relation to the tax and mineral royalty assumptions used in the economic model:
|
●
|
A depreciation rate of 15%;
|
|
●
|
A corporate tax rate of 10%;
|
|
●
|
A NSR royalty rate of 1.0%. The NSR is calculated from the FOB revenue less taxes (excluding income tax), less all transport costs (HMC and final products) and less all smelter costs.
|
|
19.3
|
Economic model results base case Indicated + Inferred Resources
|
The key economic measures for the base case Indicated + Inferred are presented in Table 19‑2.
Table 19‑2: Economic measures base case Indicated + Inferred Resources
|
Measure
|
Units
|
|
Result
|
|
|
Initial capital cost
|
US$ million
|
|
|
338 |
|
|
Annual operating cost *
|
US$ million
|
|
|
99 |
|
|
Annual revenue
|
US$ million
|
|
|
200 |
|
|
Post-tax NPV
|
US$ million
|
|
|
419 |
|
|
Post-tax IRR
|
%
|
|
|
21 |
|
|
R/C ratio (Project)
|
|
|
2.2 |
|
|
Payback (Real)
|
Years
|
|
|
4.7 |
|
* Includes sustaining capital costs
The annual cashflow profile for the base case Indicated + Inferred is shown in Figure 19‑1.
Figure 19‑1: Profile of forecast annual cashflow base case Indicated + Inferred Resources
Positive cashflows are expected through the life of mine despite the expansions and the infrastructure move anticipated in year 18. Corporate tax is only expected to be payable in the second year of the Project. The revenue/cash cost ratio (R/C ratio) is positive throughout the Project with an average of 2.2.
A sensitivity analysis was conducted on key value drivers including; slag pricing, pig iron pricing, operating costs, capital costs and heavy mineral grade.
Each component has been varied by plus and minus 15%. The results of the analysis are summarized in Figure 19‑2 post-tax NPV8 sensitivity tornado and in Figure 19‑3 post-tax IRR% sensitivity plot.
The base case Indicated + Inferred Project post-tax NPV is most sensitive to changes in the slag price and operating costs. A 15% change in slag price results in approximately a US$130 million difference to the mid case Project NPV. Refer to Section 16.0 for the titanium feedstock market overview and pricing assumptions used for the TRS. Apart from slag price and operating costs, Figure 19‑3 shows that the Project IRR is also sensitive to the pig iron price.
Figure 19‑2: Post tax NPV8 sensitivity tornado diagram base case Indicated + Inferred Resources
Figure 19‑3: Post-tax IRR sensitivity plot base case Indicated + Inferred Resources
|
19.4
|
Economic model results base case Indicated Resources only
|
A second option for the base case has been produced using Indicated Resources only resulting in a decrease in mine life from 24 years to 12 years with the mine and concentrator relocation occurring in year six. Key economic measures for the second model, base case Indicated only, are presented in Table 19‑3.
Table 19‑3: Economic measures base case Indicated Resources only
|
Measure
|
Units
|
|
Result
|
|
|
Initial capital cost
|
US$ million
|
|
|
338 |
|
|
Annual operating cost *
|
US$ million
|
|
|
95 |
|
|
Annual revenue
|
US$ million
|
|
|
190 |
|
|
Post-tax NPV
|
US$ million
|
|
|
200 |
|
|
Post-tax IRR
|
%
|
|
|
18 |
|
|
R/C ratio (Project)
|
|
|
2.2 |
|
|
Payback (Real)
|
Years
|
|
|
4.7 |
|
* Includes sustaining capital costs
The annual cashflow profile for this model (base case Indicated only) is shown in Figure 19‑4.
Figure 19‑4: Profile of forecast annual cashflow base case Indicated Resources only
For this model, in which only Indicated Resources are extracted, the annual cashflows of the Project are also expected to be positive through the life of the mine, even in year six, which includes the moving of mine infrastructure. The revenue/cash cost ratio is positive for most years with an average for the life of the mine of 2.2.
The results of the sensitivity analysis for the model are summarized in Figure 19‑5 and Figure 19‑6.
As for the base case, the post-tax NPV of this scenario is most sensitive to changes in the slag price and operating costs. A 15% change in slag price results in approximately a US$90 million difference to the mid case Project NPV. Apart from slag price and operating costs, Figure 19‑6 shows that the Project IRR is also sensitive to the pig iron price.
Figure 19‑5: Post tax NPV8 sensitivity tornado diagram base case Indicated Resources only
Figure 19‑6: Post-tax IRR sensitivity plot base case Indicated Resources only
|
19.5
|
Economic model results stretch case Indicated + Inferred Resources
|
The stretch production case has been developed to investigate the effect of increasing the design rate to 500,000 tonnes of slag and 320,000 tonnes of HPPI per year on project economics by revising the mine production schedule and scaling the previously proposed process flowsheet and cost estimates. The intention of the stretch case is to demonstrate the upside potential of the Project for a stretched production output which demonstrates the economies of scale. A cash flow model for the stretch case was prepared using DCF with the same basis and assumptions as the base case using factored capital and operating cost estimates.
The key economic measures for the stretch case Indicated + Inferred are presented in Table 19‑4.
Table 19‑4: Economic measures stretch case Indicated + Inferred
|
Measure
|
Units
|
|
Result
|
|
|
Initial capital cost
|
US$ million
|
|
|
918 |
|
|
Annual operating cost *
|
US$ million
|
|
|
308 |
|
|
Annual revenue
|
US$ million
|
|
|
652 |
|
|
Post-tax NPV
|
US$ million
|
|
|
1,554 |
|
|
Post-tax IRR
|
%
|
|
|
25 |
|
|
R/C ratio (Project)
|
|
|
2.3 |
|
|
Payback (Real)
|
Years
|
|
|
4.2 |
|
| * Includes sustaining capital costs |
|
|
|
|
|
The annual cashflow profile for the stretch case Indicated + Inferred is shown in Figure 19‑7.
Figure 19‑7: Profile of forecast annual cashflow stretch case Indicated + Inferred Resources
For the stretch case model, extracting both Indicated and Inferred Resources, positive cashflows are expected every year after the first year of operation. Corporate tax is only expected to be payable in the second year of the Project. The revenue/cash cost ratio (R/C ratio) is positive throughout the Project with an average of 2.3.
The results of the sensitivity analysis for this model, stretch case Indicated + Inferred, are summarized in Figure 19‑8 and Figure 19‑9. The post-tax NPV is most sensitive to changes in the slag price and operating costs. A 15% change in slag price results in approximately a US$420 million difference to the mid case Project NPV. Apart from slag price and operating costs, Figure 19‑9 shows that the Project IRR is also sensitive to the pig iron price.
Figure 19‑8: Post tax NPV8 sensitivity tornado diagram stretch case Indicated + Inferred Resources
Figure 19‑9: Post-tax IRR sensitivity plot stretch case Indicated + Inferred
|
19.6
|
Economic model results stretch case Indicated Resources only
|
The key economic measures for the stretch case Indicated only model are presented in Table 19‑5.
Table 19‑5: Economic measures stretch case Indicated only
|
Measure
|
Units
|
|
Result
|
|
|
Initial capital cost
|
US$ million
|
|
|
918 |
|
|
Annual operating cost
|
US$ million
|
|
|
222 |
|
|
Annual revenue
|
US$ million
|
|
|
457 |
|
|
Post-tax NPV
|
US$ million
|
|
|
-76 |
|
|
Post-tax IRR
|
%
|
|
|
5 |
|
|
R/C ratio (Project)
|
|
|
2.2 |
|
|
Payback (Real)
|
Years
|
|
|
4.2 |
|
| * Includes sustaining capital costs |
|
|
|
|
|
The annual cashflow profile for the stretch case Indicated only is shown in Figure 19‑10.
Figure 19‑10: Profile of forecast annual cashflow stretch case Indicated Resources only
This scenario, in which only the Indicated Resources are extracted, results in positive cashflows from the second year of operation. Corporate tax is only expected to be payable in the second year of the Project. The revenue/cash cost ratio (R/C ratio) is positive for all years after the first year of operation with a life of mine average of 2.2.
The results of the sensitivity analysis for this scenario are summarized in Figure 19‑11 and in Figure 19‑12.
The stretch case Indicated only Project post-tax NPV is most sensitive to changes in the slag price and operating costs. A 15% change in slag price results in approximately a US$120 million difference to the mid case Project NPV. Apart from slag price, capital costs and operating costs, Figure 19‑12 shows that the Project IRR is also sensitive to the pig iron price.
Figure 19‑11: Post tax NPV8 sensitivity tornado diagram stretch case Indicated Resources only
Figure 19‑12: Post-tax IRR sensitivity plot stretch case Indicated Resources only
Given the reliance on renewable energy if this Project was to have a carbon tax applied, or the products subject to carbon taxes in the place of purchase, then this would have a relatively small impact on project economics relative to the impacts on, for example, South African or Chinese slagging operations which are largely powered by fossil fuel generated power.
[Remainder of page intentionally left blank]
A check of the adjacent properties has indicated the exploration permits held by MYNM, has 10 neighboring exploration permits application and one Quarry within the exploration permit areas. Exploration permits held by MYNM as of August 2023 are in Table 20‑1 with the exploration permits currently being renewed in Table 20‑2.
Figure 20‑1 shows the application, prospecting and exploration permits in the Alto Paraná District, Paraguay. Adjacent exploration permit areas that have been approved are shown in Table 20‑3.
Table 20‑1: MYNM exploration permits - August 2023
|
Exploration permit
|
Vice ministry reference
|
|
Area (Ha)
|
MYNM block reference
|
|
235/8-02-2019
|
I7-i
|
|
|
15.156 |
|
Block A
|
|
1027/9-05-2022
|
I7-h1/I7 h2
|
|
|
9.895 |
|
Block E1 and E2
|
|
1891/31-10-2016
|
I6-d1/I7-e1/I6-d3
|
|
|
25.767 |
|
Block B1, B2 and B3
|
Table 20‑2: MYNM permits for resolution - July 2023
|
Exploration permit
|
Vice ministry reference
|
|
Area (Ha)
|
MYNM block reference
|
|
429_22-03-2023
|
I6-d1h
|
|
|
2.831 |
|
Block C1
|
|
429_22-03-2023
|
I7-e3
|
|
|
9.804 |
|
Block C2
|
|
1187_6-07-2023
|
I7-e4
|
|
|
6.646 |
|
Block D2
|
|
1187_6-07-2023
|
I6-d3e
|
|
|
400 |
|
Block D1
|
Table 20‑3: Adjacent exploration permits
|
Application
|
Vice ministry reference
|
|
Area (Ha)
|
Company
|
| 18026 - 20-04-2022 |
I6-d2
|
|
|
37.300 |
|
Minerva Exploration SA
|
|
29096_28-06-2023
|
I6d1f
|
|
|
25.413 |
|
Rossland S.A.
|
|
29096_28-06-2023
|
I6d4e
|
|
|
4.012 |
|
Rossland S.A.
|
|
51794_17-11-2022
|
I6-d
|
|
|
30.052 |
|
Mesina S.A.
|
|
53686_28-11-2022
|
I6-d4
|
|
|
21.092 |
|
LESC International S.R.L
|
| 51794 - 17-11-2022 |
I6-a4h
|
|
|
8.560 |
|
Mesina S.A
|
| 51794 - 17-11-2022 |
I6-d4f
|
|
|
49.059 |
|
Mesina S.A
|
| 51794 - 17-11-2022 |
I7-e
|
|
|
3.700 |
|
Mesina S.A
|
| 51794 - 17-11-2022 |
I7-a1g
|
|
|
6.067 |
|
Mesina S.A
|
| 51794 - 17-11-2022 |
I7-a2
|
|
|
15.400 |
|
Mesina S.A
|
Figure 20‑1: Prospecting and exploration permits Alto Paraná District, Paraguay
Source: CATASMINE_JULIO23 – Vice ministry of Mines and Energy – Government of Paraguay
(unchanged as at August 31, 2023)
The only active basalt quarry that is within MYNM Exploration Permit I7-h1 is on the western edge of Block E1. The quarry is operated by the construction group Arenales S.A.
Figure 20‑2: Active quarries in the MYNM Exploration Permit areas
[Remainder of page intentionally left blank]
|
21.0
|
Other relevant data and information
|
A high level desktop analysis of Project strengths, weaknesses, opportunities and threats (SWOT) was undertaken for the Project to summarize the various attributes currently known about the Project and assist with identifying key areas for future focus and potential opportunities that would need to be developed.
As is usual in a SWOT analysis, many of the perceived weaknesses and threats are also covered in the opportunities list. The quadrant diagram presented below provides a compact picture of issues that are more broadly covered elsewhere in this TRS. It should be noted that the Project is at a very early stage of development, and that many of the items presented will be addressed in later studies.
Table 21‑1: Project SWOT analysis
| Strengths |
|
Weaknesses |
| ● |
Large Resource potential. |
|
● |
Landlocked/distance to ocean vessels. |
| ● |
Local workforce available. |
|
● |
High clay matrix/large tailings volumes. |
| ● |
No overburden. |
|
● |
No by-product minerals. |
| ● |
Low Cr2O3, CaO, U and Th in product which may be attractive for blending. |
|
● |
Limited Indicated Resource. |
| ● |
Large groundwater source. |
|
● |
Limited geometallurgical understanding. |
| ● |
Ample renewable power, low unit cost. |
|
● |
Valuable minerals are fine grained compared to typical mineral sand particle size |
| ● |
Very low carbon footprint for a smelter with low carbon footprint products. |
|
|
|
| ● |
Existing pilot plant on site. |
|
|
|
| ● |
Significant investment to date to understand and de-risk geology, process and marketing for the stage the Project is at. |
|
|
|
| Opportunities |
|
Threats |
| ● |
Improved market acceptance for higher MgO chloride slag enabling an increase in smelter feed blending. |
|
● |
Increased capital and labor costs. |
| ● |
Price premiums for chloride slag with a very low carbon footprint. |
|
● |
Construction delays. |
| ● |
Development of partnerships with bulk logistics ports and transport providers to access the upper Paraná River. |
|
● |
Competing land use. |
| ● |
Sufficient market demand to support a second smelter expansion in the early years. |
|
● |
Increased tailings disposal costs. |
| ● |
Electric vehicles for road haulage minimizing diesel usage. |
|
● |
Increased footprint pending rehabilitation (extended tailings dewatering and stabilization) |
| ● |
Negotiate with ANDE for lower hydroelectric power rates. |
|
● |
Limited acceptance in the global chloride market initially due to elevated MgO. |
| ● |
Incorporating biochar in the smelter process to further reduce the Project’s greenhouse gas emissions. |
|
● |
Increases in transport costs. |
| ● |
Pre-reduction of the smelter feed using biochar or other local carbon sources. |
|
● |
Smelter technology risk/delays in ramp-up. |
| |
|
|
● |
No formal mining approvals process exists in Paraguay. |
| |
|
|
● |
Limited in-country mining and processing experience. |
| |
|
|
● |
Product price assumptions are not realized. |
|
22.0
|
Interpretation and conclusions
|
The Project is at an early stage of development and includes an economic analysis that is based, in part, on Inferred Mineral Resources. Inferred Mineral Resources are considered too speculative geologically to have economic considerations applied to them that would allow them to be categorized as Mineral Reserves, and there is no certainty that the results will be realized. Mineral Resources do not have demonstrated economic viability and are not Mineral Reserves.
|
22.1
|
Geology and Resources
|
The QP has reviewed the data upon which the MRE are based and is of the opinion that the procedures and systems employed to collect and manage this information meet industry best practice. The QP is of the opinion that the supporting data is representative and adequately support the geological interpretations and estimates to the level of classification assigned.
On consideration, the QP believes that the levels of uncertainty with the Mineral Resource estimations are adequately reflected in the classification of Mineral Resources for the Project.
Results indicate hydraulic mining is potentially economically viable with and without the Inferred Resources for both the base case and stretch cases. The Inferred material accounts for approximately 53% of the total Resource in the base case and 86% of the total Resource in the stretch case.
|
22.3
|
Metallurgy and process
|
The subsequent stages of project development will undertake additional laboratory scale and pilot plant trials to determine the optimum equipment selection for desliming the scrubber discharge slurry including cycloning and screening. Additionally, pilot scale tests on bulk samples from all established geometallurgical zones will provide additional design data to allow for a robust concentrator process flowsheet and design.
The TRS describes the potential technical and economic viability of the Alto Paraná Project for two cases at different scales. Based on the work described in this TRS, and the resultant economic evaluation, positive business cases have been identified for the base case and stretch case when the Indicated and Inferred Resources are considered and for the base case when only the Indicated Resources are considered. The stretch case does not produce a positive business case when only the Indicated Resources are considered.
The high titania slag and HPPI to be produced from the Alto Paraná project are expected to have the lowest GHG emissions per tonne of final products compared to existing ilmenite smelters.
The key sensitivity to the economic outcomes in this Project are assumptions associated with revenue, for example; product prices, ore grades, productivity and recoveries. The exchange rate and operating cost assumptions are also important to Project outcomes.
TZMI has positioned the Project onto the TZMI industry GHG curve showing how the carbon dioxide equivalent (CO2-e) per tonne of final products compares to ilmenite smelters considered in the analysis. As expected access to hydro power and comparatively low reductant requirement for the Project, results in the operation being well placed even with the mining and product transport emissions included. If this Project was to have a carbon tax applied, or the products be subjected to carbon taxes in the place of purchase, then this would have a relatively small impact on Project economics relative to the impacts on South African or Chinese slagging operations.
The following is a list of potential risks which future work on the Project should address:
|
●
|
The 2022 testwork at LDE treated a bulk sample from the Block E2 area and the resulting process flowsheet is conceptual and may not be optimized for Block E1 or Block A material types. Testwork and flowsheet development needs to be substantively advanced to support future PFS level studies. Bulk samples from Block E1 and Block A should be processed through a pilot plant to confirm the recovery and grade assumptions developed using the Block E2 material.
|
|
●
|
As there has been a significant change to the front end of the flowsheet the slimes settling and flocculant selection for the new scrubber flowsheet may also be significantly different. Previous pulp rheology, slimes dewatering and thickener settling testwork performed by Pocock industrial Inc. (Pocock) in 2010 used blungers and hydroseparators which will not be representative of the scrubber flowsheet.
|
|
●
|
If the Paraná River is used as the main import and export transport corridor a suitable barge port location will need to be advanced to establish the cost of developing a dedicated minerals barge loading and unloading facility near Tres Fronteras.
|
|
●
|
Paraguay has no significant history of mining. Mining activity in Paraguay is governed by the national constitution and the Project Mining Concession will need to be negotiated. Due to the scale of the Project, there may be delays in approvals for the Mining Concession, access to power, water infrastructure and land purchase. Early negotiations with the government to develop a clear path forward will reduce the risk of delays. Conversely this may also be beneficial to the Project as legislation can be flexed to suit the development of the Project.
|
| |
●
|
Similarly, the Project may be subjected to a change in duties, taxes and royalties during mining concession negotiations.
|
|
●
|
As there are relatively few ilmenite smelter projects selecting an appropriate smelter technology provider will de-risk the project. Incorrect design of the smelter and infrastructure will lead to delays in the Project ramp-up.
|
|
●
|
There is limited mining and processing experience in Paraguay. The safety maturity of the local labor and cultural language barrier may introduce risks to the project during the construction and operation of a project of this scale. Sufficient experienced expatriate labor will be required during the construction, commissioning and operation phases to ensure adequate training and guidance is provided.
|
| |
●
|
The Mineral Resources used as the basis for the production schedule in this study contain a significant proportion of Inferred Resources. The use of Inferred and Indicated Resources in the production schedule increases uncertainty. This uncertainty can be reduced once the Resources are upgraded to Measured and Indicated status and if modifying factors were applied to these Resources to produce Ore Reserves.
|
|
●
|
Slag quality and the price achievable for the chloride slag and chloride fines is a significant risk to the revenue streams of the Project.
|
|
●
|
Pricing assumptions used for the study have been based on market analysis of both slag and pig iron, however, the project economics are highly sensitive to product prices and there is a risk that these are not realized.
|
Risks unique to the stretch case
The following is a list of potential risks unique to the 500,000tpa slag stretch case. These risks are additional to the base case risks and opportunities:
|
●
|
The increased volume of reductant imports and exports of slag and pig iron will increase road traffic the impact of which needs to be investigated.
|
|
●
|
Locating the barge terminal on the Paraná River to reduce road transport will increase the Project’s exposure to risk of transport restrictions along the river.
|
|
●
|
The local labor market may not have sufficient skills or capacity to support the Project.
|
|
●
|
Accessing sufficient power from the existing infrastructure in Alto Paraná has not been investigated in detail and may increase Project costs if significant network upgrades are required.
|
|
●
|
Market acceptance of the slag may be slow and increased production of slag may flood the market attracting price discounts.
|
|
●
|
Resource definition at this early stage may become limiting as only a small proportion of the potential Resource zones is an Indicated Resource.
|
The following are potential opportunities which could add value to the Project.
Reduction of reliance on fossil fuels for reductants
The Project will be able to investigate the further reduction of GHG emissions by substituting some proportion of the reductant requirements with biochar instead of anthracite as the carbon source. Using biochar in the smelter process increases the use of renewable carbon sources and will increase local content by providing opportunities for the local supply of consumables. The investigation will need to determine likely sources of char and determine the quantity and quality of the ash content.
Rio Tinto has recently trialed the use of biochar in an ilmenite pre-reduction demonstration plant at RTFT Quebec, Canada with the aim of reducing emissions at Sorel-Tracy by 70%.
Feliciano (2014), reporting on the blending of biochar with anthracite reductant in Brazilian steel foundries, found that biochar had significantly lower ash and sulfur content than anthracite, with cost of the biochar being the main limiting factor in its use.
Pre-reduction of the smelter feed
Pre-reduction of the smelter feed may be a suitable process however no testwork exists for the pre-reduction of the Alto Paraná concentrate. Should pre-reduction provide an economic case then subsequent studies may also investigate sourcing local bio-char as the reductant. This will likely be more cost effective than imported coal given the additional cost of transporting up the Paraguay and Paraná Rivers to the smelter site.
As no testwork on pre-reduction of the Alto Paraná concentrates has been completed a testwork program will need to be developed to determine the operating conditions and confirm the applicability of local char as the reductant.
Improve Resource confidence
Exploration and development drilling should prioritize:
|
1.
|
Delineating the extent of mineralization at Block E1;
|
|
2.
|
Continue follow-up testing of Block A areas west and southwest of the currently drilled area;
|
|
3.
|
Continue regional drilling using the recently established drilling and sample processing methods.
|
Increased scale after ramp-up
The regional Inferred Resource (Section 14.1) is over 20 times the Resources used as the basis for the base case in the current study. There is considerable scope to increase the scale of the planned operation and take advantage of the efficiencies of scale. Opportunities may exist to develop the remaining Resource to increase the mining, concentration and smelting capacity of the Project beyond the stretch case.
Paste thickening of tailings
Following the initial pilot plant operation in 2011, the plant was modified to test paste thickening as opposed to conventional thickening. The paste thickener produced 36-40% solids underflow with low reagent consumption which would result in a significant reduction in the makeup water required if this could be successfully applied to the full scale process. Additional investigations into paste thickening reagents, equipment and pumping costs will need to be developed in the next Project phase.
Centrifuge separation of thickened tailings
Centrifuging of tailings is another potential method of efficiently generating clean process water and high-density tails solids from low-density silt and clay slurries. Further pilot-scale testing is recommended to evaluate the performance of this processing method with the Alto Paraná.
Technological advances in the use of decanting centrifuges have led to the increased use of centrifuge technology in the mining industry for dewatering fine tailings. If centrifugal separation equipment can be successfully applied to dewatering clay slurries at Alto Paraná, the solar drying and deposition area required to manage the tailings will be greatly reduced however the capital cost and ongoing maintenance and operating costs of the centrifuges if very high.
Agreements for lower power costs
The Project may be able to negotiate a lower power unit rate or alternatively amortize the cost of the smelter and mine power infrastructure with ANDE. ANDE and the Paraguayan government have recently demonstrated lower power rates can be negotiated by third parties.
[Remainder of page intentionally left blank]
The Alto Paraná Project is at an early stage of development. Significant additional technical work including the acquisition of additional site-specific data is required to advance the Project to the next development stage, which could potentially be a Pre-Feasibility Study.
Table 23‐1 outlines estimated significant costs if the following recommendations were completed. Critical areas to be addressed in this regard will as a minimum include:
Table 23‑1: Estimated costs associated with recommendations
|
Activity
|
|
Cost estimate
US$
|
|
Exploration and Resource definition
|
|
|
500,000 |
|
|
Hydraulic mining trials/site tailings testing/site processing/metallurgical testwork
|
|
|
900,000 |
|
|
ESG
|
|
|
150,000 |
|
|
Infrastructure
|
|
|
150,000 |
|
|
Coordination & reporting
|
|
|
500,000 |
|
|
Total
|
|
|
2,200,000 |
|
|
23.1
|
Exploration and Resource definition
|
Approximately 200 drillholes are required to upgrade sufficient Inferred Resource areas to the Indicated category to confirm 20 years of smelter feed for the base case option. Drilling will continue at the current 400 meter x 400 meter spacing.
New bulk density samples will be taken from across the Indicated Resource areas using large diameter auger drilling. Approximately 18 of these drillholes will also be used to generate representative bulk samples for processing testwork.
|
23.2
|
Mining and tailings deposition
|
Hydraulic mining trials
A hydraulic mining trial is required to confirm the viability of the method at Alto Paraná. A limited test at the pilot plant site will evaluate:
|
1.
|
Water requirements and slurry density of slurried ore;
|
|
2.
|
Mining rates achievable with standard hydraulic mining equipment;
|
|
3.
|
Slope requirements for the main flow paths;
|
|
4.
|
Pumping characteristics of the ore slurry.
|
The mining trial will also facilitate on-site process testing and testing of tailings materials, to be conducted in parallel.
Site tailings testing
|
1.
|
The physical properties of tailings materials generated in the on-site mining and processing trials will be tested in specially prepared tailings storage facility. Properties will be measured such as stable slope angles, solar drying rates, and changes in moisture levels over time. The test program will be developed by tailings engineers to ensure maximum use of available resources during the test program.
|
|
2.
|
Centrifuging of the tailings is a potential method of generating clean process water and high-density solids from low-density silt and clay slurries. Pilot-scale centrifuge testing can be conducted during hydraulic mining trials.
|
|
3.
|
Test paste thickening of the tailings to reduce water losses to the tailings dam.
|
|
4.
|
Investigate discharge pipe flocculation and co-deposition technology.
|
| 5.
|
Use the findings from the tests to develop a tailings deposition plan in conjunction with the hydraulic mining plan and determine the required external tailings volumes, open area, tails rehandle volumes, pit wall arrangements and other design requirements.
|
|
1.
|
During the mining trial, tests on the ore slurry can be conducted on selected processing by adapting and adding to the existing pilot plant equipment:
|
| |
♦ |
LIMs wet magnetic separation
|
| |
♦ |
dewatering tailings slurries
|
|
2.
|
Investigate pre-reduction of smelter feed to increase furnace throughput. Bench scale testwork will be required on the smelter feed blend to obtain the operating conditions to be used in computer simulations.
|
|
3.
|
Investigate the use of bio-char in the smelter process to further reduce the Projects greenhouse gas emissions. The investigation will need to determine likely sources of char and determine the quantity and quality of the ash content.
|
|
4.
|
Investigate the potential for improved scrubbing and attritioning efficiency by using the coarse rejects as the scrubbing media instead of silica sand.
|
| |
5.
|
Undertake laboratory scale and pilot plant trials to determine the optimum equipment selection for desliming the scrubber discharge slurry including cycloning and screening.
|
| |
6.
|
Undertake bulk trials at pilot scale to optimize the wet concentrator circuit using full size spirals and pilot scale magnetic separation equipment.
|
|
7.
|
Pilot test representative bulk samples from all established Indicated Resources to provide certainty for the concentrator process flowsheet and design.
|
|
1.
|
Complete the required environmental studies for mine development.
|
|
2.
|
Progress with hydrogeological investigations and water bore drilling to gain a better understanding of the hydrogeology beneath the exploration areas to replace the assumptions made on bore water access and yields from the bores.
|
|
3.
|
Progress with the application processes required to secure permits and access to the required volumes of groundwater.
|
|
4.
|
Benchmark the Project GHG emissions with slag and synthetic rutile producers worldwide.
|
|
5.
|
Commence gathering baseline data for the Project including:
|
| |
♦ |
Acquire a weather station and record climatic information at the pilot plant. Collecting pan evaporation data is especially important along with recording temperature, rainfall, humidity, wind speed and direction, solar radiation intensity.
|
| |
♦ |
Identify potential environmental and social data consultants.
|
| |
♦ |
Commence development of social outreach plan.
|
| |
♦ |
Gather basic census information from the Project areas and region overall.
|
|
1.
|
Ongoing development of new road infrastructure from Hernandarias to Tres Frontera will open new transport avenues for the Project. A detailed analysis of long-term logistics options is required to accurately cost the transport of reductant and consumables into Paraguay and the export of slag and pig iron products.
|
|
2.
|
Investigate alternate transport routes and barge options in further detail due to the current river dredging works. A closer port access site will require a higher Capex and a lower transport operating costs that have not been quantified in the study.
|
[Remainder of page intentionally left blank]
Bacha, R. R. B. W. B. L. &. E. R. E., 2022. The mafic volcanic climax of the Paraná-Etendeka Large Igneous Province as the trigger of the Weissert Event.. Terra Nova, p. 28– 36.
Bellieni, G. C. C. P. M. L. M. A. P. E. N. A. &. R. A., 1984. High- and low-TiO2 flood basalts from the Parana plateau (Brazil): petrology and geochemical aspects bearing on their mantle origin. Neues Jarbuch Miner, pp. 273-306.
BHP-Utah Minerals International & Lewis Environmental Consultants, 1990. Environmental Review and Management Programme, Beenup Heavy Minerals Mine, s.l.: s.n.
Cavalheiro, L. &. 1. o., 2021. Impact of global cooling on Early Cretaceous high pCO2 world during the Weissert Event. Nature Communications.
CIC Resources Inc, 2011. Parana Project TZMI Congress ASIA IN FOCUS. s.l., s.n.
CIC RESOURCES, INC., 2010. PARANA PROSPECT CIC Resources Scoping Study No.2, s.l.: s.n.
De Valais S., F. V. M. S. &. S. R., 2012. Descripción de una huella de terópodo de la Formación Misiones: primerfósil mesozoico fidedigno de Paraguay/Description of a theropod footprint from the Misiones Formation: first reliable fossil from the Mesozoic of Paraguay. Andean Geology, pp. 541-547.
DERA & CGS, 2014. Investor’s and Procurement Guide South Africa, Part 1: Heavy Minerals, Rare Earth Elements, Antimony, s.l.: s.n.
Don Hains, P. G., 2021. TECHNICAL REPORT and RESOURCE ESTIMATE for ALTO PARANÁ PROJECT, s.l.: s.n.
Geldenhuys, I. J. M. S. & Xakalashe, B. S. M. R., 2012. MINTEK; External, s.l.: s.n.
Gkritsi, E., 2022. Commons Foundation Signs 100MW Deal for CryptoMining in Paraguay. [Online]
Available at: https://www.coindesk.com/business/2022/07/21/commons-foundation-signs-100mw-deal-for-crypto-mining-in-paraguay/
Gomes, A. d. L. &. G. J. d. S., 2018. Deep-seated geothermal resources of the Parana Basin. Terrestrial Heat Flow and Applied Geothermics, 1(1), pp. 52-58.
Hains, D. H., 2012. TECHNICAL REPORT, RESOURCE ESTIMATE, AND PRELIMINARY ECONOMIC ANALYSIS ON THE ALTO PARANÁ ILMENITE PROJECT, Toronto: s.n.
Hatch Goba, 2014. Alto Parana Project Key Elements Analysis Report, s.l.: s.n.
Iluka Resources Ltd, 2022. Sembehun ore reserve and mineral resource update, Sierra Leone, s.l.: s.n.
Kuhn, M. a. r. D., 2017. TECHNICAL REPORT AND RESOURCE ESTIMATE ON ALTO PARANÁ PROJECT, s.l.: s.n.
Kuhn, M. C. a. B. D. .. M., 2015. Technical Report and Resource Estimate on Alto Paraná, s.l.: s.n.
Martin C. Kuhn, P. P., 2010. Parana Prospect presentation, s.l.: s.n.
Menezes, P. T. J., 2010. Magnetotellurics as a modelling tool in the extensive magmatic context of Parana Basin, Brazil. The Leading Edge, Volume 29.
P.V., M. E. a. Z., 1999. An outline of the geology and petroleum systems of the Paleozoic interior basins of South America. Episodes, 22(3).
Pang, K.-N. &. S. J. &. Z. M.-F., 2015. The Panzhihua Intrusion, SW China. Layered Intrusions. pp. 435-463.
Pang, K.-N. &. S. J., 2018. Magmatic Sulfide and Fe-Ti Oxide Deposits Associated With Mafic-Ultramafic Intrusions in China. In: Processes and Ore Deposits of Ultramafic-Mafic Magmas through Space and Time. s.l.:Elsevier, pp. 239-267.
Pocock Industrial, Inc., 2010. Particle Size Analyses, Flocculent Screening, Hydroseparation,, s.l.: s.n.
Scotese, C., 2013. Map Folio 29, Early Cretaceous (Hauterivian, 132.0 Ma), s.l.: PaleoAtlas for ArcGIS.
Sovereign Metals Ltd, 2022. Kasiya Expanded Scoping Study Results, s.l.: s.n.
STC-NESTRA B.V., 2018. GHG emission factors for IWT, s.l.: s.n.
U.S. DEPARTMENT OF THE INTERIOR U.S. GEOLOGICAL SURVEY, 1994. COAL MAP OF SOUTH AMERICA, s.l.: s.n.
Vergara, J., 2020. DECARBONIZATION OF PORTS AND INLAND WATERWAYS IN TIMES OF CRISIS, s.l.: s.n.
Wignall, P. B. S. Y. B. D. P. G. I. G. N. R. J. V. S. W. M. A. J. R. L. X. a. J. H., 2009. Volcanism, mass extinction, and carbon isotope fluctuations in the Middle Permian of China. Science, 324(5631), pp. 1179-1182.
Zhai, J. C. P. W. H. H. Y. &. S. W., 2017. Flotability Improvement of Ilmenite Using Attrition-Scrubbing as a Pretreatment Method. Minerals.
Zhou M-F, C. W. W. C. P. S. L. P.-P. H. G., 2013. Two stages of immiscible liquid separation in the formation of Panzhihua-type Fe-Ti-V oxide deposits, SW China. Geoscience Frontiers, 4(5), pp. 481-502.
Zhou, M. R. P. L. C. K. R. Z. C. M. J., 2005. Geochemistry, Petrogenesis and Metallogenesis of the Panzhihua Gabbroic Layered Intrusion and Associated Fe–Ti–V Oxide Deposits, Sichuan Province, SW China. Journal of Petrology, 46(11), pp. 2253-2280.
|
Symbol
|
Description
|
|
AUD or A$
|
Australian dollars
|
|
USD or US$
|
United States dollars
|
|
#
|
number
|
|
%
|
percent
|
|
wt%
|
weight percent
|
|
/
|
per
|
|
>
|
greater than
|
|
<
|
less than
|
|
g
|
gram
|
|
ppm
|
parts per million
|
|
°C
|
degrees Celsius
|
|
ha
|
hectares
|
|
km
|
Kilometer
|
|
km2
|
square kilometers
|
|
g/cm3
|
grams per cubic centimeter
|
|
kg/m3
|
kilograms per cubic meter
|
|
m
|
meter
|
|
m3
|
cubic meter
|
|
m3/hr
|
cubic meters per hour
|
|
Mm
|
million meters
|
|
mm
|
millimeter/millimeters
|
|
M
|
million
|
|
t
|
metric tonne
|
|
Mt
|
million tonnes
|
|
kt
|
kilotonne
|
|
t/m3
|
tonnes per cubic meter
|
|
t/d
|
tonnes per day
|
|
t/h
|
tonnes per hour
|
|
Mtpa
|
million tonnes per annum
|
|
tpa
|
tonnes per annum (tonnes per year)
|
|
Ma
|
million years ago
|
|
Ga
|
billion years ago
|
|
asl
|
above sea level
|
|
c.
|
circa
|
|
kW
|
kilowatt
|
|
pH
|
measure of the acidity or alkalinity of a solution
|
|
Term
|
Definition
|
|
1.0A and 0.5A magnetics
|
Represents the power (amperes) applied to a Carpco magnetic separator coil to generate a certain strength magnetic field. In this instance the strength of magnetic field is sufficient to separate the majority of the ilmenite minerals. This is known as Mag2.
|
|
0.05A Magnetics
|
Represents the power (amperes) applied to a Carpco magnetic separator coil to generate a certain strength magnetic field. In this instance the strength of magnetic field is sufficient to separate titanomagnetite and other susceptible magnetics. This is known as Mag1.
|
|
alluvial
|
Of, relating to, or found in alluvium.
|
|
alluvium
|
Unconsolidated terrestrial sediment composed of sorted or unsorted sand, gravel, and clay that has been deposited by water.
|
|
aquifer
|
A geologic formation capable of transmitting significant quantities of groundwater under normal hydraulic gradients.
|
|
auger drill
|
A type of drill which uses a corkscrew-type bit to recover samples from unconsolidated materials.
|
|
available ilmenite
|
represents the total amount of ilmenite present in the +45µm and 0.5A and 1.0A magnetic fraction.
|
|
basalt
|
Basalt is a dark-colored, fine-grained, igneous (volcanic) rock composed mainly of plagioclase and pyroxene minerals.
|
|
beneficiation
|
Physical treatment of crude ore to improve its quality for some specific purpose. Also called mineral processing.
|
|
block model
|
Refers to the process of creating a 3D spatial array of estimations. The parameter that is being estimated may be the thickness of the ore, the grade of the ore, or some other property that is useful for the evaluation of the Mineral Resource. These estimations are based on a weighted average of the values associated with the surrounding control points. A variety of interpolation methods or ‘algorithms’ are available for performing these estimations. A popular technique is ordinary Kriging.
|
|
bulk density
|
is the mass per unit volume of a solid, including the voids in a bulk sample of the material.
|
|
comminution,
crushing, grinding
|
Crushing and/or grinding of ore by impact and abrasion. Usually, the word ‘crushing’ is used for dry methods and ‘grinding’ for wet methods. Also, ‘crushing’ usually denotes reducing the size of coarse rock while ‘grinding’ usually refers to the reduction of the fine sizes.
|
|
concentrate
|
The concentrate is the valuable product from mineral processing, as opposed to the tailing, which contains the waste minerals. The concentrate represents a smaller volume than the original material that was processed.
|
|
copperas
|
Ferrous sulfate
|
|
cut-off grade
|
A grade level below which the material is not of economic interest and considered to be uneconomical to mine and process. The minimum grade of mineralization used to establish Reserves
|
| Term |
Definition |
|
density
|
The mass per unit volume of a substance, commonly expressed in grams/cubic centimeter or tonnes per cubic meter.
|
|
de-sliming
|
Removal of slimes (fine material) from a sample of unconsolidated material or finely ground material in a process plant. In this report the term is used mostly to refer to the removal of the -45μm sized material from pit and core samples using washing, disaggregation and sieving.
|
|
development
|
Often refers to the construction of a new mine or; Is the underground work carried out for the purpose of reaching and opening up a mineral deposit includes shaft sinking, cross-cutting, drifting and raising.
|
|
diamond drillhole
|
A drillhole which is drilled used a diamond impregnated bit so that a cylindrical sample of solid rock (drill core) can be recovered.
|
|
dilution
|
Waste of low-grade rock which is unavoidably removed along with the ore in the mining process.
|
|
diorite
|
Diorite is a medium- to coarse-grained intrusive igneous (volcanic) rock that commonly is composed of plagioclase-feldspar and dark-colored minerals, such as hornblende or biotite.
|
|
drill core
|
The cylinder of material, normally solid rock, recovered from a diamond drillhole.
|
|
easement
|
A legal term meaning a certain right to use the real property of another without possessing it.
|
|
EAF
|
Electric arc furnaces.
|
|
eluvial deposits
|
Weathered material (float) which is still at, or near, its point of formation.
|
|
encumbrance
|
This is a legal term covering anything that affects or limits the title of a property, such as mortgages, leases, easements, liens, or restrictions. An encumbrance may diminish the value of ownership but does not prevent the transfer of ownership. Mortgages, taxes and judgements are encumbrances known as liens. Restrictions, easements, and reservations are also encumbrances, although not liens.
|
|
erosion
|
Removal of surface material from the Earth’s crust, primarily soil and rock debris, and the transportation of the eroded materials by natural agencies from the point of removal.
|
|
ESIA
|
Environmental and Social Impact Assessment.
|
|
exploration information
|
Geological, geophysical, geochemical, sampling, drilling, trenching, analytical testing, assaying, mineralogical, metallurgical and other similar information concerning a particular property that is derived from activities undertaken to locate, investigate, define or delineate a mineral prospect or mineral deposit.
|
|
feasibility study (FS)
|
A comprehensive technical and economic study of the selected development option for a mineral project that includes appropriately detailed assessments of realistically assumed mining, processing, metallurgical, economic, marketing, legal, environmental, social and governmental considerations together with any other relevant operational factors and detailed financial analysis, that are necessary to demonstrate at the time of reporting that extraction is reasonably justified (economically mineable). The results of the study may reasonably serve as the basis for a final decision by a proponent or financial institution to proceed with, or finance, the development of the Project. The confidence level of the study will be higher than that of a Pre-Feasibility Study.
|
| Term |
Definition |
|
flotation
|
Separation of minerals based on the interfacial chemistry of the mineral particles in solution. Reagents are added to the ore slurry to render the surface of selected minerals hydrophobic. Air bubbles are introduced to which the hydrophobic minerals attach. The selected minerals are levitated to the top of the flotation machine by their attachment to the bubbles and into a froth product, called the ‘flotation concentrate.’ If this froth carries more than one mineral as a designated main constituent, it is called a ‘bulk float’. If it is selective to one constituent of the ore, where more than one will be floated, it is a ‘differential’ float.
|
|
flowsheet
|
The sequence of operations, step by step, by which ore is treated in a milling, concentration, or smelting process.
|
|
gabbro
|
Gabbro is a coarse-grained, dark-colored, intrusive igneous rock. It is usually black or dark green in color and composed mainly of the minerals plagioclase and augite.
|
|
Global Positioning System GPS
|
A space-based global navigation satellite system that provides location and time information in all weather, anywhere on or near the Earth, where there is an unobstructed line of sight to four or more GPS satellites.
|
|
Differential Global Positioning System DGPS
|
A space-based global navigation satellite system that provides location and time information in all weather, anywhere on or near the Earth, where there is an unobstructed line of sight to four or more GPS satellites.
|
|
gravity separation/ concentration
|
Exploitation of differences in the densities of particles to achieve separation. Equipment utilizing gravity separation include spirals, hydro-separators, up-current classifiers, jigs and shaking tables.
|
|
heavy liquid separation (HLS), heavy media separation (HMS)
|
Separation of minerals based on density differences using a dense heavy liquid or medium (mineral particles suspended in a liquid).
|
|
heavy mineral concentrate (HMC)
|
Material containing denser minerals which have been separated from lighter minerals using a gravity separation method such as heavy liquid separation.
|
|
ilmenite
|
A black mineral found in igneous rocks as layered deposits and in veins. It is the chief source of titanium. Composition: iron titanium oxide. Formula: FeTiO3. Crystal structure: hexagonal
|
|
Ilmenite conversion factor
|
This is a factor determined by testwork applied to the recovered magnetic fraction to determine ilmenite grade from in part titanium oxide.
|
|
Indicated Mineral Resource
|
That part of a Mineral Resource for which quantity, grade or quality, densities, shape and physical characteristics, can be estimated with a level of confidence sufficient to allow the appropriate application of technical and economic parameters, to support mine planning and evaluation of the economic viability of the deposit. The estimate is based on detailed and reliable exploration and testing information gathered through appropriate techniques from locations such as outcrops, trenches, pits, workings and drill holes that are spaced closely enough for geological and grade continuity to be reasonably assumed.
|
|
Inferred Mineral Resource
|
That part of a Mineral Resource for which quantity and grade or quality can be estimated on the basis of geological evidence and limited sampling and reasonably assumed, but not verified, geological and grade continuity. The estimate is based on limited information and sampling gathered through appropriate techniques from locations such as outcrops, trenches, pits, workings and drill holes.
|
| Term |
Definition |
|
JORC Code & Guidelines
|
Means the Australasian Code for Reporting of Exploration Results, Mineral Resources and Ore Reserves prepared by the Joint Ore Reserves Committee of the Australasian Institute of Mining and Metallurgy, Australian Institute of Geoscientists and Minerals Council of Australia, as amended; the 2012 Code has superseded the 2004 code.
|
|
laterite
|
Laterites are a type of soil, often rich in aluminum, magnesium, iron or nickel that formed through prolonged chemical and mechanical weathering in wet, warm, tropical environments.
|
|
lithology
|
The lithology of a rock unit is a description of its physical characteristics visible at outcrop, in hand or core samples or with low magnification microscopy, such as color, texture, grain size, or composition.
|
|
liberation
|
Freeing, by comminution, of particles of specific mineral from their interlock with other constituents of the ore.
|
|
life of mine (LOM)
|
Number of years that the operation is planning to mine and treat ore, and is taken from the current mine plan based on the current evaluation of Ore Reserves.
|
|
LST
|
A solution of lithium heteropolytungstates in water used in heavy liquid separation.
|
|
MADES
|
Ministry of the Environment and Sustainable Development
|
|
Mag1
|
Represents the titanomagnetite and other susceptible magnetics that are attracted when 0.05 amperes is applied to a Carpco magnet to generate a certain strength magnetic field.
|
|
Mag2
|
Represents the majority of the ilmenite minerals and other less susceptible magnetics that are attracted when 0.5 and 1.0 amperes is applied to a Carpco magnet to generate a certain strength magnetic field.
|
|
magnetic separation
|
Use of permanent or electro-magnets to remove relatively strong ferromagnetic particles from para- and dia-magnetic ores.
|
|
Measured Mineral Resource
|
That part of a Mineral Resource for which quantity, grade or quality, densities, shape, and physical characteristics are so well established that they can be estimated with confidence sufficient to allow the appropriate application of technical and economic parameters, to support production planning and evaluation of the economic viability of the deposit. The estimate is based on detailed and reliable exploration, sampling and testing information gathered through appropriate techniques from locations such as outcrops, trenches, pits, workings and drill holes that are spaced closely enough to confirm both geological and grade continuity.
|
|
MRE
|
Mineral Resource estimate
|
|
MPI
|
Merchant pig iron.
|
|
mill
|
Includes any ore mill, sampling works, concentration, and any crushing, grinding, or screening plant used at, and in connection with, an excavation or mine.
|
|
Mineral Reserve
|
The economically mineable part of a Measured or Indicated Mineral Resource demonstrated by at least a Preliminary Feasibility Study. This Study must include adequate information on mining, processing, metallurgical, economic and other relevant factors that demonstrate, at the time of reporting, that economic extraction can be justified. A Mineral Reserve includes diluting materials and allowances for losses that may occur when the material is mined.
|
| Term |
Definition |
|
Mineral Resource
|
A concentration or occurrence of diamonds, natural solid inorganic material, or natural solid fossilized organic material including base and precious metals, coal, and industrial minerals in or on the Earth’s crust in such form and quantity and of such a grade or quality that it has reasonable prospects for economic extraction. The location, quantity, grade, geological characteristics and continuity of a Mineral Resource are known, estimated or interpreted from specific geological evidence and knowledge.
|
|
Mineral Resource estimation
|
see Resource estimation.
|
|
MOPC
|
Ministry of Public Works and Communications.
|
|
MYNM
|
Metálicos y No Metálicos S.R.L. is the Paraguayan subsidiary of CIC Resources (Paraguay) Inc which is wholly owned by UEC.
|
|
open pit
|
A mine that is entirely on the surface. Also referred to as open-cut or opencast mine.
|
|
ordinary kriging
|
A geostatistical approach to geological modelling. Instead of weighting nearby data points by some power of their inverted distance, ordinary kriging relies on the spatial correlation structure of the data to determine the weighting values of each sample.
|
|
ore mineral
|
A mineral of value containing economic elements of interest. Mineral processing is aimed as separating the ore and gangue minerals contained in mineralization.
|
|
overburden
|
Material of any nature, consolidated or unconsolidated, that overlies a deposit of ore that is to be mined.
|
|
oxidation
|
A chemical reaction in which substances combine with oxygen for form an oxide. For example, the combination of iron with oxygen to form an iron oxide (rust) or copper and oxygen produce copper oxide; the green coating on old pennies. The opposite of oxidation is reduction.
|
|
pilot plant
|
A pilot plant is a small scale plant which is operated to generate information about the behavior of the system for use in design of larger facilities. Pilot plants are used to reduce the risk associated with construction of large process plants.
|
|
plant
|
A group of buildings, and especially to their contained equipment, in which a process or function is carried out; on a mine it will include warehouses, hoisting equipment, compressors, repair shops, offices, mill or concentrator.
|
|
preliminary feasibility study, pre-feasibility study (PFS)
|
A comprehensive study of a range of options for the technical and economic viability of a mineral project that has advanced to a stage where a preferred mining method, in the case of underground mining, or the pit configuration, in the case of an open pit, is established and an effective method of mineral processing is determined. It includes a financial analysis based on reasonable assumptions on mining, processing, metallurgical, economic, marketing, legal, environmental, social and governmental considerations and the evaluation of any other relevant factors which are sufficient for a Qualified Person, acting reasonably, to determine if all or part of the Mineral Resource may be classified as a Mineral Reserve.
|
|
PPW
|
Paraná Paraguay Waterway.
|
| Term |
Definition |
|
Probable Mineral Reserve
|
The economically mineable part of an Indicated and, in some circumstances, a Measured Mineral Resource demonstrated by at least a Preliminary Feasibility Study. This Study must include adequate information on mining, processing, metallurgical, economic, and other relevant factors that demonstrate, at the time of reporting, that economic extraction can be justified.
|
|
Proven Mineral Reserve
|
The economically mineable part of a Measured Mineral Resource demonstrated by at least a Preliminary Feasibility Study. This Study must include adequate information on mining, processing, metallurgical, economic, and other relevant factors that demonstrate, at the time of reporting, that economic extraction is justified.
|
|
QAQC
|
Quality assurance and Quality control of the geological sample database.
|
|
QEMScan
|
Is the name for an integrated automated mineralogy and petrography solution providing quantitative analysis of minerals, rocks and man-made materials. The integrated system comprises a Scanning Electron Microscope (SEM) with a large specimen chamber, up to four light-element Energy-dispersive X-ray spectroscopy (EDS) detectors, and proprietary software controlling automated data acquisition.
|
|
Qualified Person (QP)
|
A mineral industry professional. Have at least five years of relevant experience in the type of mineralization and type of deposit under consideration and in the specific type of activity that person is undertaking on behalf of the registrant.
An eligible member or licensee in good standing of a recognized professional organization at the time the technical report is prepared.
|
|
quaternary
|
A Geological Age within the Cainozoic Era from 2.58 million years ago to the present.
|
|
recovered magnetic fraction
|
Material from a sample that has been separated from its parent sample by use of a magnet. Usually it is magnetic minerals depending on mineral grain liberation.
|
|
Resource estimation
|
The process of using exploration data to generate models (usually three-dimensional) of a Mineral Resource for use in mine planning and in quantifying the tonnage and grades of Mineral Resources present.
|
|
right-of-way
|
A parcel of land granted by deed or easement for construction and maintenance according to a designated use. This may include highways, streets, canals, ditches, or other uses.
|
|
royalty
|
An amount of money paid at regular intervals by the lessee or operator of an exploration or mining property to the owner of the ground. Generally based on a specific amount per tonne or a percentage of the total production or profits. Also, the fee paid for the right to use a patented process.
|
|
run-of-mine (ROM)
|
A term used to describe ore of average grade for the deposit.
|
|
saprolite
|
A soft, earthy, typically clay-rich, thoroughly decomposed rock, formed in place by chemical weathering of igneous, sedimentary, and metamorphic rocks.
|
|
SEAM
|
Secretariat of the Environment.
|
| Term |
Definition |
|
slimes
|
Fine material, generally < 45μm sized particles, which is usually removed from a sample and discarded during mineral processing. Different size specifications may apply depending on the processing method being used; for instance, a finer size would apply in flotation compared to gravity separation. In this report the term has generally been used to refer to the - 45μm sized material.
|
|
specific gravity
|
The weight of a substance compared with the weight of an equal volume of pure water at 4°C. Reported in grams per cubic centimeter (g/cm3 ) or tonnes per cubic meter (t/m3 ).
|
|
standard reference material (SRM)
|
Homogenized finely ground sample material which has been analyzed at a group of different laboratories in order to provide agreed (true) values for the grades of the certified values. Such materials can be purchased commercially and are used to provide control samples for monitoring the accuracy of analyses during evaluation sampling.
|
|
tailings
|
Material rejected from a mill after the recoverable valuable minerals have been extracted.
|
|
TBE
|
Tetrabromoethane used in heavy liquid separation.
|
|
Tertiary
|
A Geological Age within the Cainozoic Era 2.6 to 65 million years ago.
|
|
TiO2 unit
|
One TiO2 unit is equal to one tonne of contained TiO₂.
|
|
titanomagnetite
|
A mineral containing oxides of titanium and iron.
|
|
UEC
|
Uranium Energy Corp.
|
|
Universal Transverse Mercator (UTM)
|
The Universal Transverse Mercator projection is a map projection used to define horizontal positions world-wide by dividing the surface of the Earth into 6 degree zones, each mapped by the Transverse Mercator projection with a central meridian in the center of the zone. UTM zone numbers designate 6 degree longitudinal strips extending from 80 degrees South latitude to 84 degrees North latitude. UTM zone characters designate 8 degree zones extending north and south from the equator.
|
|
variogram
|
A function of the distance and direction separating two locations that is used to quantify dependence. The variogram is defined as the variance of the difference between two variables at two locations. The variogram generally increases with distance and is described by nugget, sill, and range parameters. If the data is stationary, then the variogram and the covariance are theoretically related to each other.
|
|
variogram model
|
A model that is the sum of two or more component models, such as nugget, spherical, etc. Adding a nugget component to one of the other models is the most common nested model, but more complex combinations are occasionally used.
|
|
VAT
|
Value-added tax. In Paraguay the general VAT rate is 10%
|
|
weathering
|
Disintegration or alteration of rock in its natural or original position at or near the Earth’s surface through physical, chemical, and biological processes induced or modified by wind, water, and climate.
|
|
25.0
|
Reliance on information provided by the registrant
|
The Authors have used information supplied by UEC, reports by associate consultants and information available in the public domain either as reports or interactive websites. The Authors have used reasonable judgement to assess the veracity of information given in this TRS and original sources are cited in the relevant sections and listed in the References provided in section 24.0.
In addition, the Authors have relied upon, and believe there is reasonable basis for this reliance, the following reports that provided information regarding legal, political, tax and environmental matters relevant to the property in sections of this TRS as noted below.
|
25.2
|
Mineral Tenure Purpose Administering Authority
|
The QPs have relied upon, and disclaim responsibility for, information prepared by other experts regarding the legal status or ownership of the Project area or underlying property agreements (Section 3.0 of this report).
The QPs have relied on advice from UEC regarding mining law and any mining title issues, company structure, surface rights and access, environmental, taxes and royalties in Sections 3.0, 17.0, and 18.0.
|
26.0
|
Date and signature pages
|
This TRS titled ‘Technical Report Summary – Initial Assessment: Alto Paraná ‘with an effective date of November 2023, was prepared and signed by the following authors:
[remainder of page intentionally left blank]
CERTIFICATE OF AUTHOR
I, Colin W. Rothnie, Consulting Geologist of 50/27 Moo 5 Viset Road, Rawai Muang, Phuket, Thailand 83130, do hereby certify that:
|
1.
|
I am co-author of the report titled ‘Technical Report Summary – Initial Assessment: Alto Paraná Titanium Project’, dated October, 2023 and the Qualified Person for sections of it.
|
|
2.
|
I am currently employed by Uranium Energy Corporation, Suite 1830, 1030 West Georgia St, Vancouver, British Columbia, Canada as a Geological Consultant.
|
|
3.
|
I graduated with a Bachelor of Science degree (Hons) in Geology in 1985 from University of Western Australia in Perth.
|
|
4.
|
I am a Member of the Australian Institute of Mining and Metallurgy (ID No. 201546) and my membership is in good standing.
|
|
5.
|
I have worked as a geologist for over 30 years in titanium/mineral sands exploration and production.
|
|
6.
|
My direct experience with titanium and mineral sands involves more than 10 years of exploration, another 16 years employment at titanium/mineral sands mines and intermittent consulting work over the last 10 years. I have worked on titanium projects in Australia, Africa, Asia and South America. Relevant experience for the purpose of this study includes:
|
| |
a.
|
BHP Minerals 1986. Contract exploration geologist. Mineral sands exploration in Western Australia, including projects looking for titanium accumulations in the lateritic weathering profile (such as those found at Alto Paraná).
|
| |
b.
|
North Broken Hill Peko (now merged into Rio Tinto) 1987 – 1996. Mineral sands exploration across many regions of Western Australia and South Australia, including due diligence studies and resource estimations.
|
| |
c.
|
Tiwest/Tronox 1996 - 2006 Resources Superintendent at Cooljarloo Mineral Sands Mine, Western Australia. Competent Person for annual resource estimations (JORC). At Cooljarloo I supervised the development of solar drying treatment of ‘slimes’ (clay) slurries to fix a long-term build-up of ‘slimes’ tailings. The slurries are virtually the same as the main tailings stream expected at Alto Paraná (iron-stained kaolinitic clay slurries).
|
| |
d.
|
Kenmare Resources 2006 - 2012: Technical Manager Mining at Moma Mine, Mozambique. I was Competent Person for resource estimations (JORC). At both Kenmare and Tiwest I also helped develop techniques for quantitative assessment of mineral concentrates and was routinely involved in resolving mineralogical issues at the mine and mineral separation plant. My duties included helping to manage the slimes tailings by planning and constructing solar drying cells.
|
|
7.
|
I was last present at the site on August 8-13, 2022.
|
|
8.
|
I have read the definition of ‘qualified person’ set out in Subpart 1300 of Regulation S-K (S-K 1300) and certify that by reason of my education, professional registration, and relevant work experience, I fulfill the requirements to be a ‘qualified person’ for the purposes of S-K 1300.
|
Dated this 27th day of October 2023
/s/Colin W. Rothnie (M.AusIMM)
CERTIFICATE OF AUTHOR
TZ Minerals International Pty Ltd (TZMI), of Suite 11, 25 Walters Drive, Osborne Park , Western Australia does hereby certify that:
|
●
|
TZMI is an independent, third-party consulting firm comprised of industry experts, such as professional metallurgists and professional engineers.
|
|
●
|
TZMI has read the definition of ‘qualified person’ set out in S-K 1300 and certifies that by reason of education, professional registration and relevant work experience, TZMI professionals fulfill the requirements to be a ‘qualified person’ for the purposes of S-K 1300.
|
Dated this 10th day of November 2023
/s/ Gavin Diener, Chief Executive Officer
TZ Minerals International Pty Ltd
v3.23.3
Document And Entity Information
|
Nov. 13, 2023 |
| Document Information [Line Items] |
|
| Entity, Registrant Name |
URANIUM ENERGY CORP.
|
| Document, Type |
8-K
|
| Document, Period End Date |
Nov. 13, 2023
|
| Entity, Incorporation, State or Country Code |
NV
|
| Entity, File Number |
001-33706
|
| Entity, Tax Identification Number |
98-0399476
|
| Entity, Address, Address Line One |
500 North Shoreline, Ste. 800
|
| Entity, Address, City or Town |
Corpus Christi
|
| Entity, Address, State or Province |
TX
|
| Entity, Address, Postal Zip Code |
78401
|
| City Area Code |
361
|
| Local Phone Number |
888-8235
|
| Written Communications |
false
|
| Soliciting Material |
false
|
| Pre-commencement Tender Offer |
false
|
| Pre-commencement Issuer Tender Offer |
false
|
| Title of 12(b) Security |
Common Stock
|
| Trading Symbol |
UEC
|
| Security Exchange Name |
NYSE
|
| Entity, Emerging Growth Company |
false
|
| Amendment Flag |
false
|
| Entity, Central Index Key |
0001334933
|
| X |
- DefinitionBoolean flag that is true when the XBRL content amends previously-filed or accepted submission.
| Name: |
dei_AmendmentFlag |
| Namespace Prefix: |
dei_ |
| Data Type: |
xbrli:booleanItemType |
| Balance Type: |
na |
| Period Type: |
duration |
|
| X |
- DefinitionFor the EDGAR submission types of Form 8-K: the date of the report, the date of the earliest event reported; for the EDGAR submission types of Form N-1A: the filing date; for all other submission types: the end of the reporting or transition period. The format of the date is YYYY-MM-DD.
| Name: |
dei_DocumentPeriodEndDate |
| Namespace Prefix: |
dei_ |
| Data Type: |
xbrli:dateItemType |
| Balance Type: |
na |
| Period Type: |
duration |
|
| X |
- DefinitionThe type of document being provided (such as 10-K, 10-Q, 485BPOS, etc). The document type is limited to the same value as the supporting SEC submission type, or the word 'Other'.
| Name: |
dei_DocumentType |
| Namespace Prefix: |
dei_ |
| Data Type: |
dei:submissionTypeItemType |
| Balance Type: |
na |
| Period Type: |
duration |
|
| X |
- DefinitionAddress Line 1 such as Attn, Building Name, Street Name
| Name: |
dei_EntityAddressAddressLine1 |
| Namespace Prefix: |
dei_ |
| Data Type: |
xbrli:normalizedStringItemType |
| Balance Type: |
na |
| Period Type: |
duration |
|
| X |
- Definition
+ References
+ Details
| Name: |
dei_EntityAddressCityOrTown |
| Namespace Prefix: |
dei_ |
| Data Type: |
xbrli:normalizedStringItemType |
| Balance Type: |
na |
| Period Type: |
duration |
|
| X |
- DefinitionCode for the postal or zip code
| Name: |
dei_EntityAddressPostalZipCode |
| Namespace Prefix: |
dei_ |
| Data Type: |
xbrli:normalizedStringItemType |
| Balance Type: |
na |
| Period Type: |
duration |
|
| X |
- DefinitionName of the state or province.
| Name: |
dei_EntityAddressStateOrProvince |
| Namespace Prefix: |
dei_ |
| Data Type: |
dei:stateOrProvinceItemType |
| Balance Type: |
na |
| Period Type: |
duration |
|
| X |
- DefinitionA unique 10-digit SEC-issued value to identify entities that have filed disclosures with the SEC. It is commonly abbreviated as CIK. Reference 1: http://www.xbrl.org/2003/role/presentationRef
-Publisher SEC
-Name Exchange Act
-Number 240
-Section 12
-Subsection b-2
| Name: |
dei_EntityCentralIndexKey |
| Namespace Prefix: |
dei_ |
| Data Type: |
dei:centralIndexKeyItemType |
| Balance Type: |
na |
| Period Type: |
duration |
|
| X |
- DefinitionIndicate if registrant meets the emerging growth company criteria. Reference 1: http://www.xbrl.org/2003/role/presentationRef
-Publisher SEC
-Name Exchange Act
-Number 240
-Section 12
-Subsection b-2
| Name: |
dei_EntityEmergingGrowthCompany |
| Namespace Prefix: |
dei_ |
| Data Type: |
xbrli:booleanItemType |
| Balance Type: |
na |
| Period Type: |
duration |
|
| X |
- DefinitionCommission file number. The field allows up to 17 characters. The prefix may contain 1-3 digits, the sequence number may contain 1-8 digits, the optional suffix may contain 1-4 characters, and the fields are separated with a hyphen.
| Name: |
dei_EntityFileNumber |
| Namespace Prefix: |
dei_ |
| Data Type: |
dei:fileNumberItemType |
| Balance Type: |
na |
| Period Type: |
duration |
|
| X |
- DefinitionTwo-character EDGAR code representing the state or country of incorporation.
| Name: |
dei_EntityIncorporationStateCountryCode |
| Namespace Prefix: |
dei_ |
| Data Type: |
dei:edgarStateCountryItemType |
| Balance Type: |
na |
| Period Type: |
duration |
|
| X |
- DefinitionThe exact name of the entity filing the report as specified in its charter, which is required by forms filed with the SEC. Reference 1: http://www.xbrl.org/2003/role/presentationRef
-Publisher SEC
-Name Exchange Act
-Number 240
-Section 12
-Subsection b-2
| Name: |
dei_EntityRegistrantName |
| Namespace Prefix: |
dei_ |
| Data Type: |
xbrli:normalizedStringItemType |
| Balance Type: |
na |
| Period Type: |
duration |
|
| X |
- DefinitionThe Tax Identification Number (TIN), also known as an Employer Identification Number (EIN), is a unique 9-digit value assigned by the IRS. Reference 1: http://www.xbrl.org/2003/role/presentationRef
-Publisher SEC
-Name Exchange Act
-Number 240
-Section 12
-Subsection b-2
| Name: |
dei_EntityTaxIdentificationNumber |
| Namespace Prefix: |
dei_ |
| Data Type: |
dei:employerIdItemType |
| Balance Type: |
na |
| Period Type: |
duration |
|
| X |
- DefinitionLocal phone number for entity.
| Name: |
dei_LocalPhoneNumber |
| Namespace Prefix: |
dei_ |
| Data Type: |
xbrli:normalizedStringItemType |
| Balance Type: |
na |
| Period Type: |
duration |
|
| X |
- DefinitionBoolean flag that is true when the Form 8-K filing is intended to satisfy the filing obligation of the registrant as pre-commencement communications pursuant to Rule 13e-4(c) under the Exchange Act. Reference 1: http://www.xbrl.org/2003/role/presentationRef
-Publisher SEC
-Name Exchange Act
-Number 240
-Section 13e
-Subsection 4c
| Name: |
dei_PreCommencementIssuerTenderOffer |
| Namespace Prefix: |
dei_ |
| Data Type: |
xbrli:booleanItemType |
| Balance Type: |
na |
| Period Type: |
duration |
|
| X |
- DefinitionBoolean flag that is true when the Form 8-K filing is intended to satisfy the filing obligation of the registrant as pre-commencement communications pursuant to Rule 14d-2(b) under the Exchange Act. Reference 1: http://www.xbrl.org/2003/role/presentationRef
-Publisher SEC
-Name Exchange Act
-Number 240
-Section 14d
-Subsection 2b
| Name: |
dei_PreCommencementTenderOffer |
| Namespace Prefix: |
dei_ |
| Data Type: |
xbrli:booleanItemType |
| Balance Type: |
na |
| Period Type: |
duration |
|
| X |
- DefinitionTitle of a 12(b) registered security. Reference 1: http://www.xbrl.org/2003/role/presentationRef
-Publisher SEC
-Name Exchange Act
-Number 240
-Section 12
-Subsection b
| Name: |
dei_Security12bTitle |
| Namespace Prefix: |
dei_ |
| Data Type: |
dei:securityTitleItemType |
| Balance Type: |
na |
| Period Type: |
duration |
|
| X |
- DefinitionName of the Exchange on which a security is registered. Reference 1: http://www.xbrl.org/2003/role/presentationRef
-Publisher SEC
-Name Exchange Act
-Number 240
-Section 12
-Subsection d1-1
| Name: |
dei_SecurityExchangeName |
| Namespace Prefix: |
dei_ |
| Data Type: |
dei:edgarExchangeCodeItemType |
| Balance Type: |
na |
| Period Type: |
duration |
|
| X |
- DefinitionBoolean flag that is true when the Form 8-K filing is intended to satisfy the filing obligation of the registrant as soliciting material pursuant to Rule 14a-12 under the Exchange Act. Reference 1: http://www.xbrl.org/2003/role/presentationRef
-Publisher SEC
-Name Exchange Act
-Section 14a
-Number 240
-Subsection 12
| Name: |
dei_SolicitingMaterial |
| Namespace Prefix: |
dei_ |
| Data Type: |
xbrli:booleanItemType |
| Balance Type: |
na |
| Period Type: |
duration |
|
| X |
- DefinitionTrading symbol of an instrument as listed on an exchange.
| Name: |
dei_TradingSymbol |
| Namespace Prefix: |
dei_ |
| Data Type: |
dei:tradingSymbolItemType |
| Balance Type: |
na |
| Period Type: |
duration |
|
| X |
- DefinitionBoolean flag that is true when the Form 8-K filing is intended to satisfy the filing obligation of the registrant as written communications pursuant to Rule 425 under the Securities Act. Reference 1: http://www.xbrl.org/2003/role/presentationRef
-Publisher SEC
-Name Securities Act
-Number 230
-Section 425
| Name: |
dei_WrittenCommunications |
| Namespace Prefix: |
dei_ |
| Data Type: |
xbrli:booleanItemType |
| Balance Type: |
na |
| Period Type: |
duration |
|
Uranium Energy (AMEX:UEC)
Historical Stock Chart
From Jun 2024 to Jul 2024

Uranium Energy (AMEX:UEC)
Historical Stock Chart
From Jul 2023 to Jul 2024
