0000725363false--12-31Q220240.012000000000.016000000005408371847422304000011900000.011900000.0P4Y7M2D4558138100007253632023-10-012024-03-310000725363us-gaap:SubsequentEventMember2024-05-080000725363cvm:UnvestedRestrictedStockMember2022-10-012023-03-310000725363cvm:UnvestedRestrictedStockMember2023-10-012024-03-310000725363cvm:OptionsMember2022-10-012023-03-310000725363cvm:OptionsMember2023-10-012024-03-310000725363cvm:LandlordMember2023-01-012023-01-110000725363cvm:ErgomedMember2023-10-012024-03-310000725363cvm:ErgomedMember2024-01-012024-03-310000725363cvm:ErgomedMember2022-10-012023-03-3100007253632023-10-012023-10-280000725363cvm:ConsultingAgreementsMember2023-01-012023-03-310000725363cvm:ConsultingAgreementsMember2024-01-012024-03-3100007253632024-02-012024-02-2900007253632023-11-012023-11-3000007253632023-11-3000007253632024-02-290000725363cvm:RestrictedStocksMembercvm:ConsultantsMember2022-10-012023-03-310000725363cvm:ConsultingAgreementsMember2023-09-300000725363cvm:ConsultingAgreementsMember2024-03-310000725363cvm:RestrictedStocksMembercvm:ConsultantsMember2023-01-012023-03-310000725363cvm:RestrictedStocksMembercvm:ConsultantsMember2024-01-012024-03-310000725363cvm:ConsultingAgreementsMember2022-10-012023-03-310000725363cvm:ConsultingAgreementsMember2023-10-012024-03-310000725363cvm:RestrictedStocksMembercvm:ConsultantsMember2023-10-012024-03-310000725363cvm:SeriesRRMember2022-10-012022-10-280000725363cvm:SeriesSSMember2023-10-012024-03-310000725363srt:MinimumMembercvm:ConsultantsMember2023-12-310000725363cvm:ConsultantsOptionMember2023-12-310000725363cvm:SeriesRRMember2023-12-310000725363cvm:SeriesNNMember2023-12-310000725363cvm:SeriesMMMember2023-12-310000725363cvm:SeriesYMember2023-12-310000725363cvm:SeriesXMember2023-12-310000725363cvm:SeriesUUMember2023-12-310000725363cvm:SeriesNMember2023-12-310000725363srt:MaximumMembercvm:ConsultantsMember2023-10-012024-03-310000725363srt:MinimumMembercvm:ConsultantsMember2023-10-012024-03-310000725363cvm:SeriesRRMember2023-10-012024-03-310000725363cvm:SeriesNNMember2023-10-012024-03-310000725363cvm:SeriesMMMember2023-10-012024-03-310000725363cvm:SeriesYMember2023-10-012024-03-310000725363cvm:SeriesXMember2023-10-012024-03-310000725363cvm:SeriesUUMember2023-10-012024-03-310000725363cvm:SeriesNMember2023-10-012024-03-310000725363cvm:NonEmployeesMember2023-01-012023-03-310000725363cvm:NonEmployeesMember2024-01-012024-03-310000725363cvm:NonEmployeesMember2022-10-012023-03-310000725363cvm:NonEmployeesMember2023-10-012024-03-310000725363us-gaap:EmployeeStockMember2023-10-012024-03-310000725363us-gaap:EmployeeStockMember2022-10-012023-03-310000725363us-gaap:EmployeeStockMember2023-01-012023-03-310000725363us-gaap:EmployeeStockMember2024-01-012024-03-310000725363cvm:IncentiveStockBonusPlansMember2024-03-310000725363us-gaap:StockCompensationPlanMember2024-03-310000725363cvm:StockBonusPlansMember2024-03-310000725363cvm:NonQualifiedStockOptionsPlansMember2024-03-310000725363us-gaap:RetainedEarningsMember2024-03-310000725363us-gaap:AdditionalPaidInCapitalMember2024-03-310000725363us-gaap:CommonStockMember2024-03-310000725363us-gaap:RetainedEarningsMember2024-01-012024-03-310000725363us-gaap:AdditionalPaidInCapitalMember2024-01-012024-03-310000725363us-gaap:CommonStockMember2024-01-012024-03-3100007253632023-12-310000725363us-gaap:RetainedEarningsMember2023-12-310000725363us-gaap:AdditionalPaidInCapitalMember2023-12-310000725363us-gaap:CommonStockMember2023-12-3100007253632023-10-012023-12-310000725363us-gaap:RetainedEarningsMember2023-10-012023-12-310000725363us-gaap:AdditionalPaidInCapitalMember2023-10-012023-12-310000725363us-gaap:CommonStockMember2023-10-012023-12-310000725363us-gaap:RetainedEarningsMember2023-09-300000725363us-gaap:AdditionalPaidInCapitalMember2023-09-300000725363us-gaap:CommonStockMember2023-09-3000007253632023-03-310000725363us-gaap:RetainedEarningsMember2023-03-310000725363us-gaap:AdditionalPaidInCapitalMember2023-03-310000725363us-gaap:CommonStockMember2023-03-310000725363us-gaap:RetainedEarningsMember2023-01-012023-03-310000725363us-gaap:AdditionalPaidInCapitalMember2023-01-012023-03-310000725363us-gaap:CommonStockMember2023-01-012023-03-3100007253632022-12-310000725363us-gaap:RetainedEarningsMember2022-12-310000725363us-gaap:AdditionalPaidInCapitalMember2022-12-310000725363us-gaap:CommonStockMember2022-12-3100007253632022-10-012022-12-310000725363us-gaap:RetainedEarningsMember2022-10-012022-12-310000725363us-gaap:AdditionalPaidInCapitalMember2022-10-012022-12-310000725363us-gaap:CommonStockMember2022-10-012022-12-3100007253632022-09-300000725363us-gaap:RetainedEarningsMember2022-09-300000725363us-gaap:AdditionalPaidInCapitalMember2022-09-300000725363us-gaap:CommonStockMember2022-09-3000007253632023-01-012023-03-3100007253632022-10-012023-03-3100007253632024-01-012024-03-3100007253632023-09-3000007253632024-03-3100007253632024-05-09iso4217:USDxbrli:sharesiso4217:USDxbrli:sharesxbrli:pure
UNITED STATES
SECURITIES AND EXCHANGE COMMISSION
Washington, D.C. 20549
FORM 10-Q
(Mark One)
☒ QUARTERLY REPORT PURSUANT TO SECTION 13 OR 15 (d) OF THE SECURITIES EXCHANGE ACT OF 1934
For the quarterly period ended March 31, 2024
OR
☐ TRANSITION REPORT PURSUANT TO SECTION 13 OR 15 (d) OF THE SECURITIES EXCHANGE ACT OF 1934
For the transition period from _______________ to ______________.
Commission File Number 001-11889
Colorado | | 84-0916344 |
State or other jurisdiction incorporation | | (IRS) Employer Identification Number |
8229 Boone Boulevard, Suite 802
Vienna, Virginia 22182
Address of principal executive offices
(703) 506-9460
Registrant's telephone number, including area code
Securities registered pursuant to Section 12(b) of the Act:
Title of Each Class | | Trading Symbol(s) | | Name of Each Exchange on Which Registered |
Common Stock | | CVM | | NYSE American |
Indicate by check mark whether the Registrant (1) has filed all reports required to be filed by Section 13 or 15(d) of the Securities Exchange Act of 1934 during the preceding 12 months (or for such shorter period that the Registrant was required to file such reports) and (2) had been subject to such filing requirements for the past 90 days. Yes ☒ No ☐
Indicate by check mark whether the registrant has submitted electronically every Interactive Data File required to be submitted and posted pursuant to Rule 405 of Regulation S-T (§232.405 of this chapter) during the preceding 12 months (or for such shorter period that the registrant was required to submit and post such files). Yes ☒ No ☐
Indicate by check mark whether the Registrant is a large accelerated filer, an accelerated filer, a non-accelerated filer, a smaller reporting company or an emerging growth company. See the definitions of “large accelerated filer,” “accelerated filer”, “smaller reporting company” and “emerging growth company” in Rule 12b-2 of the Exchange Act:
Large accelerated filer | ☐ | Accelerated filer | ☐ |
Non-accelerated filer | ☒ | Smaller reporting company | ☒ |
| | Emerging growth company | ☐ |
If an emerging growth company, indicate by check mark if the registrant has elected not to use the extended transition period for complying with any new or revised financial accounting standards provided pursuant to Section 13(a) of the Exchange Act. ☐
Indicate by check mark whether the Registrant is a shell company (as defined in Exchange Act Rule 12b-2 of the Exchange Act). Yes ☐ No ☒
Class of Stock | | No. Shares Outstanding | | Date |
Common | | 54,159,937 | | May 9, 2024 |
TABLE OF CONTENTS
PART I FINANCIAL INFORMATION
CEL-SCI CORPORATION |
CONDENSED BALANCE SHEETS |
| | | | | | |
| | MARCH 31, | | | SEPTEMBER 30, | |
ASSETS | | 2024 | | | 2023 | |
| | (UNAUDITED) | | | | |
Current assets: | | | | | | |
Cash and cash equivalents | | $ | 5,309,321 | | | $ | 4,145,735 | |
Prepaid expenses | | | 696,648 | | | | 520,368 | |
Supplies used for R&D and manufacturing | | | 2,489,284 | | | | 2,248,072 | |
Deposits | | | 16,129 | | | | 4,245 | |
| | | | | | | | |
Total current assets | | | 8,511,382 | | | | 6,918,420 | |
| | | | | | | | |
Finance lease right of use assets | | | 8,251,453 | | | | 9,131,987 | |
Operating lease right of use assets | | | 1,598,879 | | | | 1,698,243 | |
Property and equipment, net | | | 9,113,284 | | | | 10,188,126 | |
Patent costs, net | | | 180,482 | | | | 197,704 | |
Deposits | | | 2,319,101 | | | | 2,319,101 | |
Supplies used for R&D and manufacturing | | | 73,524 | | | | 74,669 | |
| | | | | | | | |
Total assets | | $ | 30,048,105 | | | $ | 30,528,250 | |
| | | | | | | | |
LIABILITIES AND STOCKHOLDERS' EQUITY | | | | | | | | |
| | | | | | | | |
Current liabilities: | | | | | | | | |
Accounts payable | | $ | 1,015,969 | | | $ | 2,009,786 | |
Accrued expenses | | | 1,219,399 | | | | 1,049,581 | |
Due to employees | | | 751,607 | | | | 557,244 | |
Finance lease obligation, current portion | | | 1,888,767 | | | | 1,771,804 | |
Operating lease obligation, current portion | | | 211,275 | | | | 197,431 | |
| | | | | | | | |
Total current liabilities | | | 5,087,017 | | | | 5,585,846 | |
| | | | | | | | |
Finance lease obligations, net of current portion | | | 8,987,319 | | | | 9,949,565 | |
Operating lease obligations, net of current portion | | | 1,544,126 | | | | 1,652,949 | |
Other liabilities | | | 125,000 | | | | 125,000 | |
| | | | | | | | |
Total liabilities | | | 15,743,462 | | | | 17,313,360 | |
| | | | | | | | |
Commitments and contingencies (refer to Note E) | | | | | | | | |
| | | | | | | | |
STOCKHOLDERS' EQUITY | | | | | | | | |
| | | | | | | | |
Preferred stock, $0.01 par value; 200,000 shares authorized; 0 shares issued and outstanding | | | - | | | | - | |
Common stock, $0.01 par value; 600,000,000 shares authorized; 54,083,718 and 47,422,304 shares issued and outstanding at March 31, 2024 and September 30, 2023, respectively | | | 540,837 | | | | 474,223 | |
Additional paid-in capital | | | 514,809,617 | | | | 499,832,063 | |
Accumulated deficit | | | (501,045,811 | ) | | | (487,091,396 | ) |
| | | | | | | | |
Total stockholders' equity | | | 14,304,643 | | | | 13,214,890 | |
| | | | | | | | |
TOTAL LIABILITIES AND STOCKHOLDERS' EQUITY | | $ | 30,048,105 | | | $ | 30,528,250 | |
| | | | | | | | |
See notes to condensed financial statements. |
CEL-SCI CORPORATION |
CONDENSED STATEMENTS OF OPERATIONS |
SIX MONTHS ENDED MARCH 31, 2024 and 2023 |
(UNAUDITED) |
| | | | | | |
| | 2024 | | | 2023 | |
| | | | | | |
Operating expenses: | | | | | | |
Research and development | | $ | 8,981,044 | | | $ | 11,476,034 | |
General and administrative | | | 4,580,791 | | | | 4,350,761 | |
Total operating expenses | | | 13,561,835 | | | | 15,826,795 | |
| | | | | | | | |
Operating loss | | | (13,561,835 | ) | | | (15,826,795 | ) |
| | | | | | | | |
Interest expense, net | | | (380,397 | ) | | | (311,852 | ) |
Other expense | | | (12,183 | ) | | | (57,671 | ) |
| | | | | | | | |
Net loss | | | (13,954,415 | ) | | | (16,196,318 | ) |
Modification of warrants | | | - | | | | (171,552 | ) |
| | | | | | | | |
Net loss available to common shareholders | | $ | (13,954,415 | ) | | $ | (16,367,870 | ) |
| | | | | | | | |
Net loss per common share – basic and diluted | | $ | (0.28 | ) | | $ | (0.38 | ) |
Weighted average common shares outstanding – basic and diluted | | | 50,228,860 | | | | 43,513,571 | |
| | | | | | | | |
See notes to condensed financial statements. |
CEL-SCI CORPORATION |
CONDENSED STATEMENTS OF OPERATIONS |
THREE MONTHS ENDED MARCH 31, 2024 and 2023 |
(UNAUDITED) |
| | | | | | |
| | 2024 | | | 2023 | |
| | | | | | |
Operating expenses: | | | | | | |
Research and development | | $ | 4,628,535 | | | $ | 6,083,488 | |
General and administrative | | | 2,447,413 | | | | 2,092,758 | |
Total operating expenses | | | 7,075,948 | | | | 8,176,246 | |
| | | | | | | | |
Operating loss | | | (7,075,948 | ) | | | (8,176,246 | ) |
| | | | | | | | |
Interest expense, net | | | (182,701 | ) | | | (159,063 | ) |
Other income (expense) | | | 13,758 | | | | (7,500 | ) |
| | | | | | | | |
Net loss | | | (7,244,891 | ) | | | (8,342,809 | ) |
| | | | | | | | |
Net loss available to common shareholders | | $ | (7,244,891 | ) | | $ | (8,342,809 | ) |
| | | | | | | | |
Net loss per common share – basic and diluted | | $ | (0.14 | ) | | $ | (0.19 | ) |
Weighted average common shares outstanding – basic and diluted | | | 52,006,442 | | | | 43,588,381 | |
| | | | | | | | |
See notes to condensed financial statements. |
CEL-SCI CORPORATION
STATEMENTS OF STOCKHOLDERS’ EQUITY
(UNAUDITED)
| | | | | | | | Additional | | | | | | | |
| | Common Stock | | | Paid-In | | | Accumulated | | | | |
| | Shares | | | Amount | | | Capital | | | Deficit | | | Total | |
| | | | | | | | | | | | | | | |
BALANCES AT SEPTEMBER 30, 2023 | | | 47,422,304 | | | $ | 474,223 | | | $ | 499,832,063 | | | $ | (487,091,396 | ) | | $ | 13,214,890 | |
| | | | | | | | | | | | | | | | | | | | |
401(k) contributions paid in common stock | | | 17,724 | | | | 177 | | | | 48,730 | | | | - | | | | 48,907 | |
Stock issued to nonemployees for service | | | 88,573 | | | | 886 | | | | 201,421 | | | | - | | | | 202,307 | |
Proceeds from the sale of common stock | | | 2,490,000 | | | | 24,900 | | | | 4,955,100 | | | | - | | | | 4,980,000 | |
Equity based compensation – employees | | | - | | | | - | | | | 1,383,909 | | | | - | | | | 1,383,909 | |
Share issuance costs | | | - | | | | - | | | | (470,229 | ) | | | - | | | | (470,229 | ) |
Net loss | | | - | | | | - | | | | - | | | | (6,709,524 | ) | | | (6,709,524 | ) |
BALANCES AT DECEMBER 31, 2023 | | | 50,018,601 | | | $ | 500,186 | | | $ | 505,950,994 | | | $ | (493,800,920 | ) | | $ | 12,650,260 | |
| | | | | | | | | | | | | | | | | | | | |
401(k) contributions paid in common stock | | | 27,373 | | | | 274 | | | | 53,211 | | | | - | | | | 53,485 | |
Stock issued to nonemployees for service | | | 162,744 | | | | 1,627 | | | | 379,243 | | | | - | | | | 380,870 | |
Proceeds from the sale of common stock | | | 3,875,000 | | | | 38,750 | | | | 7,711,250 | | | | - | | | | 7,750,000 | |
Equity based compensation – employees | | | - | | | | - | | | | 1,432,540 | | | | - | | | | 1,432,540 | |
Share issuance costs | | | - | | | | - | | | | (717,621 | ) | | | - | | | | (717,621 | ) |
Net loss | | | - | | | | - | | | | - | | | | (7,244,891 | ) | | | (7,244,891 | ) |
BALANCES AT MARCH 31, 2024 | | | 54,083,718 | | | $ | 540,837 | | | $ | 514,809,617 | | | $ | (501,045,811 | ) | | $ | 14,304,643 | |
See notes to condensed financial statements.
CEL-SCI CORPORATION
STATEMENTS OF STOCKHOLDERS’ EQUITY (continued)
(UNAUDITED)
| | | | | | | | Additional | | | | | | | |
| | Common Stock | | | Paid-In | | | Accumulated | | | | |
| | Shares | | | Amount | | | Capital | | | Deficit | | | Total | |
| | | | | | | | | | | | | | | |
BALANCES AT SEPTEMBER 30, 2022 | | | 43,448,317 | | | $ | 434,484 | | | $ | 486,625,816 | | | $ | (454,897,093 | ) | | $ | 32,163,207 | |
| | | | | | | | | | | | | | | | | | | | |
Warrant exercises | | | 217,752 | | | | 2,177 | | | | 445,114 | | | | - | | | | 447,291 | |
Equity based compensation – employees | | | - | | | | - | | | | 1,703,931 | | | | - | | | | 1,703,931 | |
401(k) contributions paid in common stock | | | 21,331 | | | | 213 | | | | 49,965 | | | | - | | | | 50,178 | |
Stock issued to nonemployees for service | | | 40,236 | | | | 402 | | | | 91,221 | | | | - | | | | 91,623 | |
2014 incentive stock forfeited | | | (2,000 | ) | | | (20 | ) | | | (11,080 | ) | | | - | | | | (11,100 | ) |
Net loss | | | - | | | | - | | | | - | | | | (7,853,509 | ) | | | (7,853,509 | ) |
BALANCES AT DECEMBER 31, 2022 | | | 43,725,636 | | | $ | 437,256 | | | $ | 488,904,967 | | | $ | (462,750,602 | ) | | $ | 26,591,621 | |
| | | | | | | | | | | | | | | | | | | | |
Equity based compensation – employees | | | - | | | | - | | | | 1,743,288 | | | | - | | | | 1,743,288 | |
401(k) contributions paid in common stock | | | 23,627 | | | | 236 | | | | 54,629 | | | | - | | | | 54,865 | |
Stock issued to nonemployees for service | | | 38,562 | | | | 386 | | | | 100,249 | | | | - | | | | 100,635 | |
Net loss | | | - | | | | - | | | | - | | | | (8,342,809 | ) | | | (8,342,809 | ) |
BALANCES AT MARCH 31, 2023 | | | 43,787,825 | | | $ | 437,878 | | | $ | 490,803,133 | | | $ | (471,093,411 | ) | | $ | 20,147,600 | |
See notes to condensed financial statements.
CEL-SCI CORPORATION |
CONDENSED STATEMENTS OF CASH FLOWS |
SIX MONTHS ENDED MARCH 31, 2024 and 2023 |
(UNAUDITED) |
| | | | | | |
| | 2024 | | | 2023 | |
| | | | | | |
Net loss | | $ | (13,954,415 | ) | | $ | (16,196,318 | ) |
Adjustments to reconcile net loss to net cash used in operating activities: | | | | | | | | |
Depreciation and amortization | | | 1,993,395 | | | | 1,973,982 | |
Non-cash lease expense | | | 4,383 | | | | 9,545 | |
Share-based payments for services | | | 547,893 | | | | 285,722 | |
Equity-based compensation | | | 2,816,449 | | | | 3,436,119 | |
Common stock contributed to 401(k) plan | | | 102,392 | | | | 105,043 | |
(Increase)/decrease in assets: | | | | | | | | |
Prepaid expenses | | | (30,996 | ) | | | 180,222 | |
Supplies used for R&D and manufacturing | | | (240,067 | ) | | | 170,434 | |
Deposits | | | (11,884 | ) | | | (2,354,723 | ) |
Increase/(decrease) in liabilities: | | | | | | | | |
Accounts payable | | | (896,939 | ) | | | 102,841 | |
Accrued expenses | | | 59,818 | | | | 111,515 | |
Due to employees | | | 194,363 | | | | 37,798 | |
| | | | | | | | |
Net cash used in operating activities | | | (9,415,608 | ) | | | (12,137,820 | ) |
| | | | | | | | |
CASH FLOWS FROM INVESTING ACTIVITIES: | | | | | | | | |
Purchases of property and equipment | | | (51,650 | ) | | | (165,032 | ) |
Expenditures for patent costs | | | (13,211 | ) | | | - | |
| | | | | | | | |
Net cash used in investing activities | | | (64,861 | ) | | | (165,032 | ) |
| | | | | | | | |
CASH FLOWS FROM FINANCING ACTIVITIES: | | | | | | | | |
Proceeds from issuance of common stock | | | 12,730,000 | | | | - | |
Payments of stock issuance costs | | | (1,218,937 | ) | | | (9,010 | ) |
Proceeds from the exercise of warrants | | | - | | | | 447,291 | |
Payments on obligations under finance leases | | | (867,008 | ) | | | (761,223 | ) |
| | | | | | | | |
Net cash provided by (used in) financing activities | | | 10,644,055 | | | | (322,942 | ) |
| | | | | | | | |
NET INCREASE (DECREASE) IN CASH AND CASH EQUIVALENTS | | | 1,163,586 | | | | (12,625,794 | ) |
| | | | | | | | |
CASH AND CASH EQUIVALENTS, BEGINNING OF PERIOD | | | 4,145,735 | | | | 22,672,138 | |
| | | | | | | | |
CASH AND CASH EQUIVALENTS, END OF PERIOD | | $ | 5,309,321 | | | $ | 10,046,344 | |
| | | | | | | | |
See notes to condensed financial statements. |
CEL-SCI CORPORATION |
CONDENSED STATEMENTS OF CASH FLOWS |
SIX MONTHS ENDED MARCH 31, 2024 and 2023 |
(UNAUDITED) |
| | | | | | |
| | 2024 | | | 2023 | |
SUPPLEMENTAL SCHEDULE OF NON-CASH INVESTING AND FINANCING ACTIVITIES: | | | | | | |
Property and equipment purchases included in current liabilities | | $ | - | | | $ | 176,743 | |
Assets purchased under finance leases | | $ | 20,797 | | | $ | - | |
Finance lease obligation included in accounts payable | | $ | 522 | | | $ | 1,402 | |
Consulting services paid with issuance of common stock | | $ | 583,177 | | | $ | 192,258 | |
Accrued consulting services to be paid with common stock | | $ | 165,000 | | | $ | 165,000 | |
Financing costs included in current liabilities | | $ | 46,616 | | | $ | - | |
| | | | | | | | |
Cash paid for interest | | $ | 480,044 | | | $ | 547,765 | |
| | | | | | | | |
See notes to condensed financial statements. |
CEL-SCI CORPORATION
NOTES TO CONDENSED FINANCIAL STATEMENTS
SIX MONTHS ENDED MARCH 31, 2024 AND 2023 (UNAUDITED)
A. BASIS OF PRESENTATION AND SUMMARY OF SIGNIFICANT ACCOUNTING POLICIES
Basis of Presentation
The accompanying condensed financial statements of CEL-SCI Corporation (the “Company”) are unaudited and certain information and footnote disclosures normally included in the annual financial statements prepared in accordance with accounting principles generally accepted in the United States of America have been omitted pursuant to the rules and regulations of the Securities and Exchange Commission. While management of the Company believes that the disclosures presented are adequate to make the information presented not misleading, these interim condensed financial statements should be read in conjunction with the financial statements and notes included in the Company’s annual report on Form 10-K for the year ended September 30, 2023.
In the opinion of management, the accompanying unaudited condensed financial statements contain all adjustments (all of which are of a normal recurring nature) and disclosures necessary for a fair presentation of the Company’s financial position as of March 31, 2024 and the results of its operations for the six months then ended. The condensed balance sheet as of September 30, 2023 is derived from the September 30, 2023 audited financial statements.
Due to recurring losses from operations and future liquidity needs, there is substantial doubt about the Company’s ability to continue as a going concern. The financial statements do not include any adjustments that might result from the outcome of this uncertainty. Refer to discussion in Note B.
Summary of Significant Accounting Policies:
Cash and Cash Equivalents – Cash and cash equivalents consist principally of unrestricted cash on deposit and short-term money market funds. The Company considers all highly liquid investments with a maturity when purchased of less than three months to be cash equivalents.
Property and Equipment – Property and equipment is recorded at cost and depreciated using the straight-line method over estimated useful lives of five to seven years. Leasehold improvements are depreciated over the shorter of the estimated useful life of the asset or the term of the lease. Repairs and maintenance which do not extend the life of the asset are expensed when incurred. Property and equipment is reviewed on a quarterly basis to determine if any of the assets are impaired.
Supplies used for R&D and manufacturing – Supplies are consumable items kept on hand to support the Company’s R&D and manufacturing operations. Supplies are recorded at cost and are charged to expense as they are used in operations.
Patents – Patent expenditures are capitalized and amortized using the straight-line method over the shorter of the expected useful life or the legal life of the patent (17 years). In the event changes in technology or other circumstances impair the value or life of the patent, appropriate adjustments to the asset value and period of amortization are made. An impairment loss is recognized when estimated future undiscounted cash flows expected to result from the use of the asset, and from its disposition, are less than the carrying value of the asset. The amount of the impairment loss would be the difference between the estimated fair value of the asset and its carrying value.
Leases – The Company accounts for contracts that convey the right to control the use of identified property, plant or equipment over a period of time in exchange for consideration as leases upon inception. The Company leases certain real estate, machinery, laboratory equipment and office equipment over varying periods. Many of these leases include an option to either renew or terminate the lease. For purposes of calculating lease liabilities, these options are included in the lease term when it is reasonably certain that the Company will exercise such options. The incremental borrowing rate utilized to calculate the lease liabilities is based on the information available at the commencement date, as most of the leases do not provide an implicit borrowing rate. Short-term leases, defined as leases with initial terms of 12 months or less, are not reflected on the balance sheet. Lease expense for such short-term leases is not material.
Share-Based Compensation – Compensation cost for all share-based awards is measured at fair value as of the grant date in accordance with the provisions of ASC 718, Compensation – Stock Compensation (“ASC 718”). The fair value of stock options is calculated using the Black-Scholes option pricing model. The Black-Scholes model requires various judgmental assumptions including volatility and expected option life. The share-based compensation cost is recognized using the straight-line method as expense over the requisite service or vesting period.
The Company has Incentive Stock Option Plans, Non-Qualified Stock Option Plans, Stock Compensation Plans, Stock Bonus Plans and an Incentive Stock Bonus Plan. These Plans are collectively referred to as the “Plans”. All Plans have been approved by the Company’s stockholders.
The Company’s stock options are not transferable, and the actual value of the stock options that an employee may realize, if any, will depend on the excess of the market price on the date of exercise over the exercise price. For options issued with service conditions only, the Company has based its assumption for stock price volatility on the variance of daily closing prices of the Company’s stock. The risk-free interest rate assumption is based on the U.S. Treasury rate at the date of grant with the term equal to the expected life of the option. Forfeitures are accounted for when they occur. The expected term of options represents the period that options granted are expected to be outstanding and has been determined based on an analysis of historical exercise behavior. If any of the assumptions used in the Black-Scholes model change significantly, share-based compensation expense for new awards may differ materially in the future from that recorded in the current period.
Restricted stock granted under the Incentive Stock Bonus Plan and options granted under the Non-Qualified Stock Option Plans are subject to service, performance and market conditions and meet the classification of equity awards. These awards were measured at fair value on the grant dates using a Monte Carlo simulation for issuances where the attainment of performance criteria is uncertain. The total compensation cost will be expensed over the estimated requisite service period.
Research and Development Costs – Research and development costs are expensed as incurred. Management accrues Clinical Research Organization (“CRO”) expenses and clinical trial study expenses based on services performed and relies on the CROs to provide estimates of those costs applicable to the completion stage of a study. Estimated accrued CRO costs are subject to revisions as such studies progress to completion. The Company records revisions to estimated expense in the period in which the facts that give rise to the revision become known.
Net Loss Per Common Share – The Company calculates net loss per common share in accordance with ASC 260, Earnings Per Share. Basic and diluted net loss per common share was determined by dividing net loss applicable to common shareholders by the weighted average number of common shares outstanding during the period. The Company’s potentially dilutive shares, which include outstanding common stock options, unvested restricted stock and common stock warrants, have not been included in the computation of diluted net loss per share for all periods as the result would be anti-dilutive.
Income Taxes – The Company accounts for income taxes in accordance with the provisions of ASC 740, Income Taxes, on a tax jurisdiction basis. Deferred tax assets and liabilities are recognized for future tax consequences attributable to differences between the financial statement carrying amounts of existing assets and liabilities and their respective tax bases and operating and tax loss carryforwards. Deferred tax assets and liabilities are measured using enacted tax rates expected to apply to taxable income in the years in which those temporary differences are expected to be recovered or settled. The effect on deferred tax assets and liabilities of a change in tax rates is recognized in income in the period that includes the enactment date. The Company records a valuation allowance to reduce the deferred tax assets to the amount that is more likely than not to be recognized. A full valuation allowance was recorded against the deferred tax assets as of March 31, 2024 and September 30, 2023.
Impairment of long-lived assets – CEL-SCI’s fixed assets are made up of leasehold improvements, furniture, and equipment. ASC 360-10 requires that a long-lived asset group be reviewed for impairment only when events or changes in circumstances indicate that the carrying amount of the long-lived asset (group) might not be recoverable. CEL-SCI’s recurring losses are a triggering event that could indicate impairment of long-lived assets such as fixed assets. CEL-SCI reviews these assets to determine if events or changes in circumstances indicate the existence of impairment. If indicators of impairment exist, the Company tests for recoverability, then, if necessary, measures and records the impairment. The amount of the impairment loss would be the amount by which the carrying amount of the asset (group) exceeds its fair value.
Use of Estimates – The preparation of financial statements in conformity with U.S. GAAP requires management to make estimates and assumptions that affect the amounts reported in the financial statements and the accompanying disclosures. These estimates are based on management’s best knowledge of current events and actions the Company may undertake in the future. Estimates are used in accounting for, among other items, inventory obsolescence, accruals, stock options, useful lives for depreciation and amortization of long-lived assets, right of use assets and lease liabilities, deferred tax assets and the related valuation allowance. Actual results could differ from estimates, although management does not generally believe such differences would materially affect the financial statements in any given year. Additionally, in calculating the right of use assets and lease liabilities, estimates and assumptions were used to determine the incremental borrowing rates and the expected lease terms. The Company considers the estimates used in valuing the stock options and the lease assets and liabilities to be significant.
Recently Adopted Accounting Standards
In June 2016, the Financial Accounting Standards Board (“FASB”) issued Accounting Standards Update No. 2016-13, Financial Instruments – Credit Losses (Topic 326): Measurement of Credit Losses on Financial Instruments (“ASU 2016-13”). ASU 2016-13 requires a financial asset (or a group of financial assets) measured at amortized cost basis to be presented at the net amount expected to be collected. The amendments in ASU 2016-13 replace the incurred loss impairment methodology in current U.S. GAAP with a methodology that reflects expected credit losses and requires consideration of a broader range of reasonable and supportable information. ASU 2016-13 was effective for SEC filers, excluding smaller reporting companies, for fiscal years beginning after December 15, 2019, including interim periods within those fiscal years. As a smaller reporting company, the Company was permitted to adopt the new standard for fiscal years beginning after December 15, 2022, including interim periods within those fiscal years. Effective October 1, 2023, the Company adopted ASU 2016-13 using a modified retrospective transition method. The adoption of ASU 2016-13 had no impact on the Company’s financial position, results of operations, or cash flows.
New Accounting Pronouncements – The Company has considered all recently issued accounting pronouncements and does not believe the adoption of such pronouncements will have a material impact on its financial statements.
B. LIQUIDITY
The Company has incurred significant costs since its inception for the acquisition of certain proprietary technology and scientific knowledge relating to the human immunological defense system, patent applications, research and development, administrative costs, construction and expansion of manufacturing and laboratory facilities and conducting clinical trials. The Company has funded such costs primarily with proceeds from loans and the public and private sale of its securities. The Company will be required to raise additional capital or find additional long-term financing to continue with its efforts to bring Multikine, the Company’s lead investigational therapy, to market. The ability to raise capital may be dependent upon market conditions that are outside the control of the Company. The ability of the Company to obtain approval from any regulatory agency for the sale of products to be developed on a commercial basis is uncertain. Ultimately, the Company must complete the development of its products, obtain the appropriate regulatory approvals and obtain sufficient revenues to support its cost structure.
To finance the Company through marketing approval, the Company plans to raise additional capital in the form of corporate partnerships, and debt and/or equity financings. The Company believes that it will be able to obtain additional financing because it has done so consistently in the past and because Multikine showed great survival benefit in the Phase 3 study in one of the two treatment arms for advanced primary head and neck cancer. However, there can be no assurance that the Company will be successful in raising additional funds on a timely basis or that the funds will be available to the Company on acceptable terms or at all. If the Company does not raise the necessary amounts of money, it may have to curtail its operations until such time as it is able to raise the required funding.
Due to the Company’s recurring losses from operations and future liquidity needs, there is substantial doubt about the Company’s ability to continue as a going concern. The financial statements do not include any adjustments that might result from the outcome of this uncertainty.
C. STOCKHOLDERS’ EQUITY
Proceeds from the Sale of Common Stock
In February 2024, the Company sold 3,875,000 shares of common stock at a public offering price of $2.00 per share and received proceeds of approximately $7.0 million, net of issuance costs of approximately $0.7 million.
In November 2023, the Company sold 2,490,000 shares of common stock at a public offering price of $2.00 per share and received proceeds of approximately $4.5 million, net of issuance costs of approximately $0.5 million.
Equity Compensation
Underlying share information for equity compensation plans as of March 31, 2024 is as follows:
Name of Plan | | Total Shares Reserved Under Plans | |
Incentive Stock Option Plans | | | 138,400 | |
Non-Qualified Stock Option Plans | | | 15,787,200 | |
Stock Bonus Plans | | | 1,283,760 | |
Stock Compensation Plans | | | 634,000 | |
Incentive Stock Bonus Plan | | | 640,000 | |
Stock option activity:
| | Six Months Ended March 31, | |
| | 2024 | | | 2023 | |
Options granted | | | 3,000 | | | | 4,500 | |
Options exercised | | | - | | | | - | |
Options forfeited | | | 53,000 | | | | 122,332 | |
Options expired | | | 27,035 | | | | 45,404 | |
| | Three Months Ended March 31, | |
| | 2024 | | | 2023 | |
Options granted | | | 3,000 | | | | 2,000 | |
Options exercised | | | - | | | | - | |
Options forfeited | | | 42,000 | | | | 25,500 | |
Options expired | | | 27,035 | | | | 4 | |
On March 1, 2024, the Company accelerated the vesting of 234,332 stock options issued to directors to vest on April 19, 2024. The Company concluded that the change in vesting of the options should be treated as a modification in accordance with ASC 718. As such, the Company revalued the options as of March 1, 2024 (the modification date) and subtracted any compensation cost already recognized prior to the modification date. This resulted in remaining compensation cost of approximately $260,000 that will be amortized on a straight-line basis over the remaining service period.
Share-Based Compensation Expense:
| | Six Months Ended March 31, | |
| | 2024 | | | 2023 | |
Employees | | $ | 2,816,449 | | | $ | 3,436,119 | |
Non-employees | | $ | 370,163 | | | $ | 285,722 | |
| | Three Months Ended March 31, | |
| | 2024 | | | 2023 | |
Employees | | $ | 1,432,540 | | | $ | 1,743,288 | |
Non-employees | | $ | 151,777 | | | $ | 136,864 | |
Employee compensation expense includes the expense related to options and restricted stock that is expensed over the vesting periods. Non-employee expense includes the expense related to options and stock issued to consultants expensed over the period of the related service contracts.
Warrants and Non-Employee Options
The following chart represents the warrants and non-employee options outstanding at March 31, 2024:
Warrant/ Options | | Issue Date | | Shares Issuable upon Exercise of Warrants/ Options | | | Exercise Price | | | Expiration Date | |
Series N | | 8/18/2008 | | | 85,339 | | | $ | 3.00 | | | 8/18/2024 | |
Series UU | | 6/11/2018 | | | 93,603 | | | $ | 2.80 | | | 6/30/2024 | |
Series X | | 1/13/2016 | | | 120,000 | | | $ | 9.25 | | | 7/13/2024 | |
Series Y | | 2/15/2016 | | | 26,000 | | | $ | 12.00 | | | 8/15/2024 | |
Series MM | | 6/22/2017 | | | 333,432 | | | $ | 1.86 | | | 6/22/2024 | |
Series NN | | 7/24/2017 | | | 200,087 | | | $ | 2.52 | | | 7/24/2024 | |
Series RR | | 10/30/2017 | | | 234,009 | | | $ | 1.65 | | | 10/30/2024 | |
Consultant Options | | 7/28/2017 – 9/2/2023 | | | 110,000 | | | $ | 1.39 - $2.18 | | | 7/27/2027 - 9/1/2028 | |
1. Equity Warrants
Changes in Equity Warrants
No warrants recorded as equity were exercised during the six months ended March 31, 2024. The following warrants recorded as equity were exercised during the six months ended March 31, 2023.
Warrants | | Warrants Exercised | | | Exercise Price | | | Proceeds | |
Series RR | | | 17,752 | | | $ | 1.65 | | | $ | 29,291 | |
Series SS | | | 200,000 | | | $ | 2.09 | | | | 418,000 | |
| | | 217,752 | | | | | | | $ | 447,291 | |
No warrants recorded as equity expired during the six and three months ended March 31 ,2024. On February 5, 2023, 600 Series TT warrants, with an exercise price of $2.24, expired.
No warrants recorded as equity were extended during the six and three months ended March 31, 2024. On October 28, 2022, the expiration date of the Series RR warrants was extended two years from October 30, 2022 to October 30, 2024. The incremental cost of this extension was approximately $172,000, which was recorded as a deemed dividend in the financial statements for the three months ended December 31, 2022. The Series RR warrants are held by Geert Kersten, Patricia Prichep (current Officers of the Company) and the de Clara Trust, of which the Company’s CEO, Geert Kersten, is a beneficiary.
2. Options and Shares Issued to Consultants
During the six months ended March 31, 2024 and 2023, the Company issued 251,317 and 78,798 shares, respectively, of restricted common stock to consultants for services. The weighted average grant date fair value of the shares issued to consultants was $1.99 and $2.47 during the six months ended March 31, 2024 and 2023, respectively. During the three months ended March 31, 2024 and 2023, the Company issued 162,744 and 38,562 shares, respectively, of restricted common stock to consultants for services. The weighted average grant date fair value of the shares issued to consultants was $2.22 and $2.42 during the three months ended March 31, 2024 and 2023, respectively.
No options were issued to a consultant during the six months ended March 31, 2024. During the six months ended March 31, 2023, 5,000 options with an exercise price of $11.61 issued to a consultant expired.
During the six months ended March 31, 2024 and 2023, the Company recorded total expense of approximately $370,000 and $285,000, respectively, relating to the share-based compensation under various consulting agreements. During the three months ended March 31, 2024 and 2023, the Company recorded total expense of approximately $152,000 and $136,000, respectively, relating to the share-based compensation under these consulting agreements. On March 31, 2024 and September 30, 2023, consulting fees of approximately $351,000 and $205,000, respectively, are included in current assets as prepaid expenses and will be amortized over the remaining service periods.
D. RELATED PARTY TRANSACTIONS
During the six and three months ended March 31, 2024, no restricted shares of the Company’s common stock were purchased by related parties.
On October 28, 2022, the expiration date of the Series RR warrants was extended two years from October 30, 2022 to October 30, 2024 (Note C). The incremental cost of this extension was approximately $172,000, which was recorded as a deemed dividend. The Series RR warrants are held by Geert Kersten, Patricia Prichep (current officers of the Company) and the de Clara Trust, of which the Company’s CEO, Geert Kersten, is a beneficiary.
E. COMMITMENTS AND CONTINGENCIES
Clinical Research Agreement
Under co-development and revenue sharing agreements with Ergomed, Ergomed agreed to contribute up to $12 million towards the Company’s Phase 3 Clinical Trial in the form of discounted clinical services in exchange for a single digit percentage of milestone and royalty payments, up to a specific maximum amount. The Company accounted for the co-development and revenue sharing agreements in accordance with ASC 808, Collaborative Arrangements. The Company determined the payments to Ergomed are within the scope of ASC 730, Research and Development. Therefore, the Company records the discount on the clinical services as a credit to research and development expense on its statements of operations. Since the inception of the agreement with Ergomed, the Company has incurred research and development expenses of approximately $35.8 million for Ergomed’s services. This amount is net of Ergomed’s discount of approximately $11.9 million. During the six months ended March 31, 2024 and 2023, the Company recorded, net of Ergomed’s discount, approximately $0.1 million for each quarter as research and development expense related to Ergomed’s services. During the three months ended March 31, 2024 and 2023, the Company recorded, net of Ergomed’s discount, less than $0.1 million for each quarter as research and development expense related to Ergomed’s services.
Lease Agreements
The Company leases a manufacturing facility near Baltimore, Maryland (the San Tomas lease). The building was remodeled in accordance with the Company’s specifications so that it can be used by the Company to manufacture Multikine for the Company’s Phase 3 clinical trial and sales of the drug if approved by any regulatory agency. The lease is for a term of twenty years and requires annual base rent to escalate each year at 3%. The Company is required to pay all real estate and personal property taxes, insurance premiums, maintenance expenses, repair costs and utilities. The lease allows the Company, at its election, to extend the lease for two ten-year periods or to purchase the building at the end of the 20-year lease, which expires in October 2028. The renewal options are not included in the calculation of the right of use asset and lease liability because exercise of those options is not reasonably certain.
The San Tomas lease is classified as a finance lease on the Company’s balance sheet, as well as several other smaller finance leases for office equipment. The finance right of use assets are being depreciated using the straight-line method over the underlying lease terms. Total cash paid related to finance leases during the six months ended March 31, 2024 and 2023 was approximately $1.3 million for both periods, of which approximately $0.5 and $0.6 million was for interest, respectively, in each six-month period. As of March 31, 2024, the weighted average discount rate of the Company’s finance leases is 8.46% and the weighted average time to maturity is 4.59 years.
On January 11, 2023, the Company was required to deposit approximately $2.3 million to its landlord, equivalent to one year’s rent, for falling below the stipulated cash threshold in accordance with the San Tomas lease. The amount will be included as an asset on the balance sheet until the Company meets the minimum cash balance required and the deposit is returned.
Approximate future minimum lease payments under finance leases as of March 31, 2024 are as follows:
Six months ending September 30, 2024 | | $ | 1,333,000 | |
Year ending September 30, | | | | |
2025 | | | 2,747,000 | |
2026 | | | 2,838,000 | |
2027 | | | 2,929,000 | |
2028 | | | 3,021,000 | |
2029 | | | 255,000 | |
Total future minimum lease obligation | | | 13,123,000 | |
Less imputed interest on finance lease obligations | | | (2,247,000 | ) |
Net present value of financing lease obligations | | | 10,876,000 | |
Less net present value of financing lease obligations – current portion | | | (1,889,000 | ) |
Net present value of financing lease obligations - non-current portion | | $ | 8,987,000 | |
The Company leases two facilities under operating leases. The lease for the Company’s office headquarters will expire on November 30, 2025. The lease for its research and development laboratory was renewed in September 2021 for an additional ten years and will expire on February 29, 2032. The renewal was considered a modification for accounting purposes and the right of use asset and liability were remeasured as of the date of the renewal. The operating leases include escalating rental payments. The Company is recognizing the related rent expense on a straight-line basis over the terms of the leases. The Company incurred lease expense for operating leases of approximately $0.2 million for both the six months ended March 31, 2024 and 2023. Total cash paid related to operating leases during the six months ended March 31, 2024 and 2023 was approximately $0.2 million for each period. The weighted average discount rate of the Company’s operating leases is 9.03% and the weighted average time to maturity is 7.35 years.
As of March 31, 2024, approximate future minimum lease payments under operating leases are as follows:
Six months ending September 30, 2024 | | $ | 180,000 | |
Year ending September 30, | | | | |
2025 | | | 366,000 | |
2026 | | | 287,000 | |
2027 | | | 277,000 | |
2028 | | | 285,000 | |
2029 | | | 294,000 | |
Thereafter | | | 746,000 | |
Total future minimum lease obligation | | | 2,435,000 | |
Less imputed interest on operating lease obligation | | | (680,000 | ) |
Net present value of operating lease obligations | | | 1,755,000 | |
Less net present value of operating lease obligations - current portion | | | (211,000 | ) |
Net present value of operating lease obligations - non-current portion | | $ | 1,544,000 | |
G. PATENTS
During the six and three months ended March 31, 2024 and 2023, there was no impairment of patent costs. The weighted average amortization period for patents is approximately 8 years. For the six months ended March 31, 2024 and 2023, amortization of patent costs totaled approximately $17,000 and $20,000, respectively. For the three months ended March 31, 2024 and 2023, amortization of patent costs totaled approximately $8,000 and $10,000, respectively. The total estimated future amortization is as follows:
Six months ending September 30, 2024 | | $ | 15,000 | |
Year ending September 30, | | | | |
2025 | | | 29,000 | |
2026 | | | 25,000 | |
2027 | | | 22,000 | |
2028 | | | 19,000 | |
2029 | | | 16,000 | |
Thereafter | | | 54,000 | |
Total | | $ | 180,000 | |
H. LOSS PER COMMON SHARE
Basic loss per share is computed by dividing net loss available to common stockholders by the weighted average number of common shares outstanding during the period. The Company’s potentially dilutive shares, which include outstanding common stock options, common stock warrants and unvested restricted stock are not included in the computation of diluted net loss per share if their effect would be anti-dilutive.
The following table provides a reconciliation of the numerators and denominators of the basic and diluted loss per-share computations:
| | Six Months | | | Three Months | |
| | Ended | | | Ended | |
| | 2024 | | | 2023 | | | 2024 | | | 2023 | |
Loss per share – basic and diluted | | | | | | | | | | | | |
Net loss available to common – basic and diluted | | $ | (13,954,415 | ) | | $ | (16,367,870 | ) | | $ | (7,244,891 | ) | | $ | (8,342,809 | ) |
Weighted average shares outstanding – basic and diluted | | | 50,228,860 | | | | 43,513,571 | | | | 52,006,442 | | | | 43,588,381 | |
Basic and diluted loss per common share | | $ | (0.28 | ) | | $ | (0.38 | ) | | $ | (0.14 | ) | | $ | (0.19 | ) |
In accordance with the contingently issuable shares guidance of ASC 260, Earnings Per Share, the calculation of diluted net earnings (loss) per share excludes the following securities because their inclusion would have been anti-dilutive as of March 31:
| | 2024 | | | 2023 | |
Options and Warrants | | | 15,772,993 | | | | 13,893,248 | |
Unvested Restricted Stock | | | 147,250 | | | | 149,250 | |
Total | | | 15,920,243 | | | | 14,042,498 | |
J. SUBSEQUENT EVENTS
On May 4, 2024, the Company extended for two years the expiration date of 1,092,470 outstanding warrants.
On May 8, 2024, officers and directors purchased 58,000 shares of restricted common stock from the Company at an aggregate fair market value of $80,620.
Item 2. MANAGEMENT'S DISCUSSION AND ANALYSIS OF FINANCIAL CONDITION AND RESULTS OF OPERATIONS
Company Overview
CEL-SCI Corporation is a clinical-stage biotechnology company dedicated to research and development directed at improving the treatment of cancer and other diseases by using the immune system, the body’s natural defense system. CEL-SCI is currently focused on the development of the following product candidates and technologies:
| 1) | Multikine, an investigational immunotherapy under development for the potential treatment of certain head and neck cancers; and |
| | |
| 2) | L.E.A.P.S. (Ligand Epitope Antigen Presentation System) technology, or LEAPS, with several product candidates under development for the potential treatment of rheumatoid arthritis. |
Multikine (Leukocyte Interleukin, Injection) is the full name of this investigational therapy, which, for simplicity, is referred to in this report as Multikine. Multikine is the trademark that the Company has registered for this investigational therapy, and this proprietary name is subject to FDA review under the Company’s future anticipated regulatory submission for approval. None of the Company’s product candidates have been approved for sale, barter or exchange by the Food and Drug Administration (FDA) or any other regulatory agency for any use to treat disease in humans nor has the safety or efficacy of these products been established for any use. There can be no assurance that obtaining marketing approval from the FDA in the United States and by comparable agencies in most foreign countries will be granted.
MULTIKINE AND THE PHASE III CLINICAL TRIAL RESULTS
Immunotherapy is a large, high growth market. Immunotherapies use the patient’s own immune system to fight disease. These “targeted therapies” are at the forefront of modern cancer research. A recent Bloomberg report from January 2023 asserted that:
The global cancer immunotherapy market is expected to reach USD $196.45 billion by 2030, registering CAGR of 7.2% during the forecast period, according to a new report by Grand View Research, Inc. The rising adoption of immunotherapy over other therapy options for cancer owing to its targeted action is anticipated to increase the adoption during the forecast period. Moreover, increasing regulatory approvals from authoritarian establishments for novel immunotherapy used for oncology is also expected to further fuel the market growth. (https://www.bloomberg.com/press-releases/2023-01-18/cancer-immunotherapy-market-worth-196-45-billion-by-2030-grand-view-research-inc)
CEL-SCI hopes to participate in this growing market with its lead investigational therapy Multikine® (Leukocyte Interleukin, Injection). Multikine has already been tested in approximately 750 human patients in multiple clinical trials, including a well-controlled, multicenter, global, 928 patient Phase III randomized controlled trial. Multikine is unique among approved cancer immunotherapies because it is given first, right after diagnosis and before surgery. CEL-SCI believes that the Phase III clinical trial demonstrated that Multikine caused tumors to reduce in size and/or caused the disease to “downstage” within just a few weeks of treatment before surgery. Importantly, patients with these reductions and/or downstages had their risk of death cut in half at five years of follow up. CEL-SCI is in discussions with regulators about the design of a confirmatory trial focused on the patients selected as the best responding patients in the prior study.
What is Multikine and who is it for? Multikine is a biological medicinal immunotherapy comprised of a mixture of natural cytokines and small biological molecules. Multikine is injected around the tumor and adjacent lymph nodes for three weeks as a first-line treatment before the standard of care (SOC), which is surgery followed by either radiotherapy or chemoradiotherapy. Multikine’s rationale for use is to incite a locoregional immune response against the tumor before the local immune system has been compromised by the standard of care and/or disease progression.
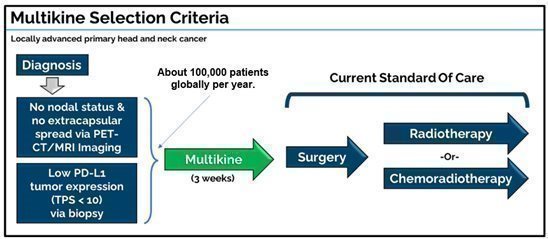
The Multikine target population is treatment-naïve adult patients with resectable locally advanced primary squamous cell carcinoma of the head and neck (SCCHN) in the oral cavity and who have:
| · | No lymph node involvement (via PET scan) |
| · | Low PD-L1 tumor expression (TPS<10) (via biopsy) |
PD-L1 is a protein receptor on the tumor surface that helps the tumor repel the immune system. CEL-SCI believes that patients with tumors having low PD-L1 would be more likely to respond to Multikine because their tumors have lower defenses against the patient’s immune system. CEL-SCI estimates that patients with tumors having low PD-L1 represent about 70% of locally advanced primary SCCHN patients.
Multikine leads to longer survival with no safety issues. Clinical investigations of Multikine have demonstrated in the randomized controlled Phase III trial (RCT) the following in the target population:
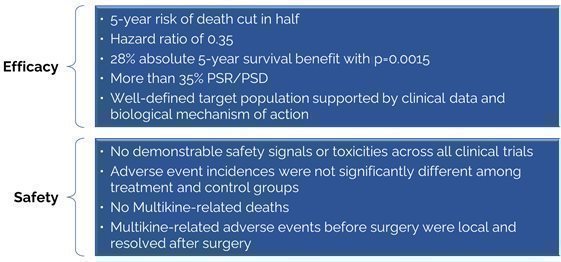
| · | risk of death cut in half at five years versus the control; |
| · | 28.6% absolute 5-year overall survival benefit versus control (p=0.0015); |
| · | 0.349 hazard ratio vs control (95% CIs [0.18, 0.66], Wald p=0.0012); |
| · | >35% rate of pre-surgery reductions and/or downstages (p<0.01); and |
| · | low PD-L1 tumor expression (vs high PD-L1 where Keytruda and Opdivo work best). |
There were no demonstrable safety signals or toxicities observed in approximately 750 Multikine-treated subjects across multiple clinical trials. Adverse event (AE) and serious adverse event (SAE) incidences were not significantly different among treatment and control groups. There were no Multikine-related deaths and only two discontinuations. Multikine-related AEs before surgery were local and resolved after surgery. Although the literature reports that some of Multikine’s components may be toxic when administered systemically (e.g., TNFα, IFN γ, IL-1β), these toxicities did not emerge with Multikine, even at doses many times higher than those administered in the Phase III trial, primarily due to Multikine’s delivery by local injection and dosage.
CEL-SCI published its data as abstracts and posters at the annual conferences for the 2022 American Society of Clinical Oncology (ASCO), 2022 and 2023 European Society for Medical Oncology (ESMO), and the 2023 European Head and Neck Society’s (EHNS’s) annual European Conference On Head And Neck Oncology (ECHNO) and the 2023 European Society for Therapeutic Radiology and Oncology (ESTRO) and 2023 American Head and Neck Society (AHNS). These publications can be accessed at http://www.cel-sci.com.
Multikine works by inducing pre-surgical responses. CEL-SCI observed statistically significant pre-surgical responses after Multikine treatment, and therefore CEL-SCI believes in the following:
| ➢ | Multikine causes pre-surgical responses; |
| ➢ | Pre-surgical responses lead to longer life; |
| ➢ | Therefore, selecting more patients predicted to have a pre-surgical response should lead to much better survival in the target population. |
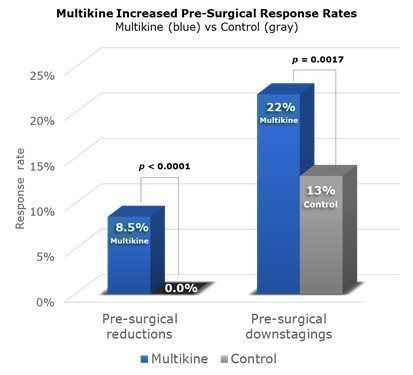
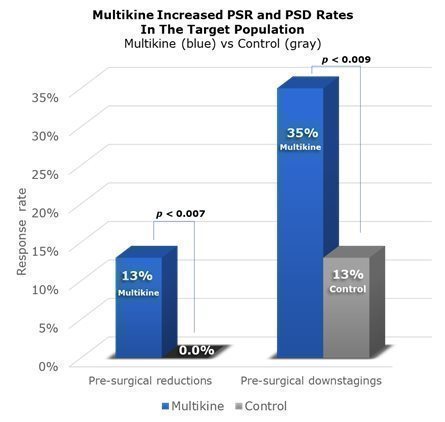
A “pre-surgical response” is a significant change in disease before surgery. CEL-SCI saw two kinds of responses in the Phase III trial. First, there were “reductions” in the size of the tumor—a reduction of 30% or more qualified as a “pre-surgical reduction” or “PSR” for short. Second, there were disease “downstages,” (e.g., the disease improved from Stage IV to Stage III) pre-surgery. CEL-SCI calls this a “pre-surgical downstaging” or “PSD” for short. CEL-SCI’s 2022 ESMO cancer conference presentation reported on PSR, and CEL-SCI’s new 2023 ESMO presentation reported on PSD.
Across the whole Phase III trial, PSRs were seen in 8.5% of Multikine patients compared to none in the control group. PSDs were seen in 22% of Multikine patients as compared to 13% in the control group. Because Multikine was the only therapy given to these patients before surgery, it is CEL-SCI’s strong belief that Multikine had to be the cause of the higher rates of PSR and PSD. These data are presented visually below. The taller blue columns show PSR and PSD rates in all 529 Multikine-treated patients in the Phase III trial, and the gray columns show PSR and PSD rates for all 394 control patients.
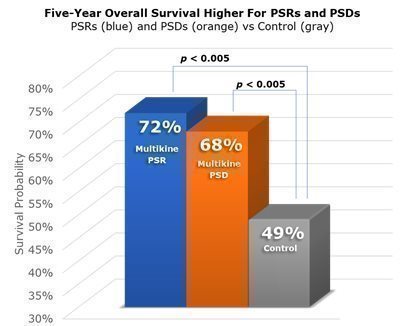
It was not enough for us to show that Multikine likely leads to PSRs and PSDs as compared to a control group, CEL-SCI also had to test if PSRs and PSDs lead to improved survival. CEL-SCI’s Phase III trial demonstrated that PSR patients were 72% likely to be alive after five years, whereas control patients were only about 49% likely to be alive after five years. Patients with PSD saw similar improvement in CEL-SCI’s Phase III trial. Their five-year chance of survival was approximately 68%. Therefore, CEL-SCI believes that the Phase III trial demonstrated that those patients who had PSR or PSD resulting from Multikine lived longer than those who were not treated with Multikine. It is important to note that these results are from the entire Phase III study population, not from a subgroup. The likelihood of living at least five years is shown in the graphic below for patients with PSR (blue), patients with PSD (orange) and patients who did not receive Multikine (gray).
CEL-SCI’s target population as presented at ESMO in October 2023 can be readily selected by doctors upon diagnoses using standard tests. Having shown a potential causal link supported by strong statistics between Multikine and survival benefit, CEL-SCI believes that Multikine should be approved quickly. But recall that the Phase III study’s primary endpoint of 10% survival benefit was not met. How then can we say that Multikine actually benefits patients? The answer is that while Multikine has shown that it can help patients with PSR/PSD, there were not enough PSR/PSD in the Phase III study population to yield a 10% survival benefit for the whole population. In other words, the benefits from PSR/PSD were too diluted when averaged with the other patients in the study.
None of this changes the fact that CEL-SCI observed statistical significance when analyzing Multikine’s ability to cause PSR/PSD and that these PSR/PSD statistically appear to lead to a higher chance of living five years or longer—CEL-SCI simply had to define a target population who would have a larger number of PSR/PSD. To do so, CEL-SCI analyzed Multikine’s biological mechanism of action, talked to regulators and physicians who knew best, and were guided by the Phase III data, including patient-specific data down to the cellular level. All this of course took time, but CEL-SCI believes it has succeeded and is ready to move forward.
One of the first things we reported from the Phase III study was that Multikine was shown to work best in patients who were deemed “low risk” after surgery, about 40% of the study population. These patients saw a significant 14.1% absolute 5‑year survival benefit vs the “low risk” control group not receiving Multikine. It made sense biologically that these patients would benefit most from Multikine, because they tended to have immune systems that were not yet compromised by the disease. “High risk” patients, by contrast, typically had lymph nodes invaded by the tumor, and needed chemotherapy after surgery. Because their lymph nodes were compromised, this made it harder for their immune systems to work, and they needed surgery as soon as possible without waiting an extra three weeks to receive Multikine. CEL-SCI initially developed criteria for selecting “low-risk” patients at diagnosis—i.e., those having no lymph nodes invaded by the tumor (N0) or only one lymph node invaded by the tumor (N1) as well as no extracapsular spread as determined by PET scan. CEL-SCI published these criteria at the ASCO conference in 2022. However, after discussions with regulators and physicians, CEL-SCI saw that outcomes could be improved further if the N1 patients were excluded, and only the N0 patients were included in the target population.
CEL-SCI also saw from the Phase III data that Multikine was more effective for patients with low PD-L1 tumor expression than for patients with high PD-L1 expression. This analysis was pre-specified in the statistical analysis plan. Targeting low PD-L1 also differentiates Multikine from other immunotherapies. For example, checkpoint inhibitors like Keytruda and Opdivo appear to best serve patients having high PD-L1, because these drugs work by blocking PD1/PD-L1 receptors interaction; when this interaction (PD1/PD-L1) happens it leads to inactivation/death of the immune cells attacking the tumor. While none of these drugs are currently approved as a first-line treatment before surgery, even if such approvals were to come in the future, the large majority of patients in this group having low PD-L1 would still be expected to need Multikine.
CEL-SCI’s target population is now directed to patients who present at diagnosis with N0 nodal involvement and also with low PD-L1 tumor expression (defined as tumor proportions score (TPS) < 10). These patients can be readily identified upon diagnosis with tests that physicians routinely use in cancer screening, a crucial achievement towards Multikine becoming available for use. For instance, a PET scan should be used to determine the N0 nodal status and a screening biopsy should be used to determine the low PD-L1 expression. Doctors already routinely screen head and neck cancer patients using PET scans and biopsy.
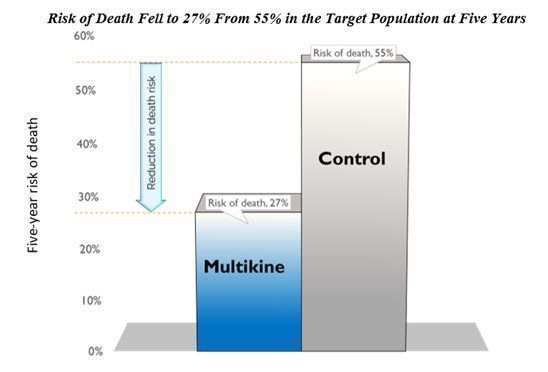
Multikine cut the 5-year risk of death in half in the target population. CEL-SCI’s results show that Multikine can cut the risk of death in half at five years versus the control group in the finalized target population. Survival increased from 45% in the control group to 73% in the Multikine group, at five years. This means the risk of death fell to 27% in the Multikine group from 55% in the control, shown below.
Another way to see the survival benefit of Multikine in the target population is the Kaplan-Meier curve from our ESMO ’23 poster, shown below. On the vertical axis is the probability of survival and the horizontal axis is time in months. The blue Multikine line is far above the green control line, meaning the chance of survival is much higher in the Multikine group at every point in time compared to the control. These results had a low p-value of 0.0015, which is very significant as a statistical matter.
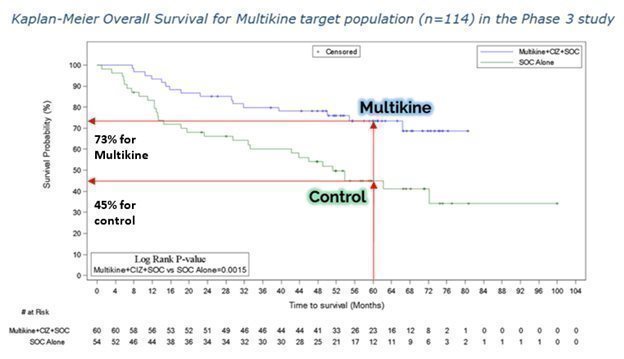
CEL-SCI’s physician consultants tell CEL-SCI that the early separation of these two survival curves (e.g., at 12 months) adds validation to the potential positive effects of Multikine.
Another measure of survival benefit is called the “hazard ratio,” which compares the chances of dying between two different groups. Here, in the Multikine target population, the hazard ratio was 0.35, which means that deaths occurred in the Multikine group about one-third as frequently as in the control group. It is also important to note that the hazard ratio’s 95% confidence interval remained far below 1.0. In the case of Multikine, statistically speaking, there is a 95% chance that the hazard ratio would fall between 0.18 and 0.66 if Multikine were tested in the target population in another study. A hazard ratio of 0.66 as the “so called worst case scenario” is still below (better) than the hazard ratio required for most drug approvals.
These positive survival outcomes—increased overall survival, reduced risk of death, widely separated Kaplan-Meier curves with early separation, low hazard ratio, low p-values, low confidence intervals—CEL-SCI believes were driven by high PSR/PSD rates in the target population, as shown in the graphic below:
CEL-SCI relies on all of these data together to support its plan to request accelerated/conditional approval in the new target population without waiting until the completion of another clinical trial.
CEL-SCI’s regulatory strategy going forward is to seek approval of Multikine following full enrollment of its confirmatory study wherever possible.
When the Phase III trial was designed, there was no evidentiary basis for excluding either of the low-risk or high-risk patient groups before surgery. Therefore, the study had to include a large percentage of high-risk patients with immune systems already compromised by disease. These subjects generally did not respond to Multikine. CEL-SCI has narrowed its target population as compared to the overall Phase III study population to focus on patients most likely to have PSR/PSD and to exclude the rest.
CEL-SCI acknowledges that efficacy in the target population has not been tested prospectively, but CEL-SCI believes that the data generated to date already presents a compelling patient need in the target population that justifies accelerated/conditional access to Multikine. This is why the conditional approval pathways were created in the first place. CEL-SCI intends to base its request for regulatory approval, in part, on its view that patients should not have to wait many more years before gaining access to the benefits of Multikine PSRs/PSDs and increased survival, particularly given Multikine’s safety profile and data that mechanistically and empirically supports the target population definition.
The benefit-risk balance favoring immediate patient access to Multikine is described below:
An “unmet need” is a factor for approval considered by all major regulatory bodies worldwide. In the Multikine target population, there is also a tremendous unmet need for improved survival. The current standard of care provides only about a 50/50 chance of surviving five years, whereas Multikine could increase that survival rate to over 70% based on the Phase III data. Chemotherapy has improved outcomes for some head and neck patients, but chemotherapy is only indicated for high-risk patients, who are not likely to fall within the Multikine target population. Currently available immunotherapies are given after surgery or where surgery is not indicated, in contrast to Multikine, which is given before surgery to patients with resectable tumors. Available checkpoint inhibitors work best on tumors with high PD-L1 expression, whereas Multikine works best in tumors with low PD-L1 expression. Therefore, Multikine’s target population is underserved, and will continue to be underserved, by current therapies, but Multikine can meet the need for improved survival.
The major regulatory bodies with whom we are working, U.S. FDA, Health Canada, European Medicines Agency (EMA) and the Medicines and Healthcare products Regulatory Agency (MHRA) in the United Kingdom (UK) all have conditional approval pathways designed for situations where the target population has not been fully tested prospectively and there is strong data supporting clinical benefit for patients. The reason is that regulators understand that in many cases patients should not have to wait for additional data before being offered the chance to benefit from a new drug. Every situation is different and depends on the specific facts.
In May 2024, CEL-SCI announced that based on strong safety and efficacy data from CEL-SCI’s completed Phase 3 head and neck cancer study, the FDA indicated CEL-SCI may move forward with a confirmatory Registration Study of Multikine in newly diagnosed advanced primary head and neck cancer patients with no lymph node involvement (determined via PET scan) and with low PD-L1 tumor expression (determined via biopsy).
Through this discussion and agreement with the FDA, CEL-SCI has achieved a tremendous milestone for people who are newly diagnosed with head and neck cancer. The survival benefit was so strong and clear in the target patient population that the confirmatory study needs to enroll only 212 people to confirm what was already achieved in the Phase 3 study. This gives the company a clear path forward.
| · | The FDA agreed to a 212-person confirmatory Registration Study based on the strength of the safety and survival benefit data in the selected target population from the prior 928-person Phase 3 study. The confirmatory study will be a randomized controlled trial with two arms: Multikine treatment plus standard of care versus standard of care alone. As presented at the ESMO cancer conference in October 2023, Multikine-treated patients in the selected group had a 73% 5-year survival vs a 45% 5-year survival in the control group who did not receive Multikine. |
| · | Generally, patient selection for different treatments in newly diagnosed head and neck cancer is done only after surgery. That presented CEL-SCI with a challenge, because Multikine has to be given before surgery. By analyzing Multikine's biological mechanism of action, as supported by the completed Phase 3 study, CEL-SCI developed criteria for selecting, before surgery, those patients who would have the best survival from Multikine. The FDA accepted the selection criteria and the proposed study design, which now permits CEL-SCI to enroll patients in the confirmatory study. |
| | |
| · | CEL-SCI met a very high bar set by the FDA, which requires more stringent analysis for newly-diagnosed patients than for terminal cancer patients. One regulator called these newly-diagnosed cancer patients “much more delicate” and explained that the standard for permitting a new study with these patients has to be more stringent, since they are not all expected to die. |
| | |
| · | CEL-SCI has been advised by statisticians and physicians that the confirmatory study has a high likelihood of success because a large survival benefit has already been demonstrated in the target population in the completed Phase 3 study. The much smaller confirmatory study—less than a quarter the size of the prior study—will focus on the patients who saw the greatest survival benefit when treated with Multikine. |
| | |
| · | If approved as a pre-surgical treatment, Multikine should be added to the standard of care for the target population. |
| | |
| · | The FDA also acknowledged in the meeting that there is a great unmet need in the target population for improved therapies. This is an important factor that weighs in favor of approval for Multikine. |
| | |
| · | CEL-SCI believes that its de-risked value proposition for investors presents a unique opportunity to invest in a Phase 3 oncology company with a large body of data demonstrating not only tumor responses, but also long-term survival, in the target patient population. The goal of our smaller confirmatory study is to confirm these positive results in a prospectively defined target population. |
Liquidity and Capital Resources
Since inception, the Company has financed its operations through the issuance of equity securities, convertible notes, loans and certain research grants. The Company will likely continue to generate net operating losses as it continues the development of Multikine and brings other drug candidates into clinical trials. Until such time as the Company becomes profitable, any or all of these financing vehicles or others may be utilized to assist the Company’s capital requirements.
Capital raised by the Company has been expended primarily for patent applications, research and development, administrative costs, the construction and upgrade of the Company’s manufacturing and laboratory facilities and clinical trials. The Company does not anticipate realizing significant revenues until entering into licensing arrangements for its technology and know-how or until it receives regulatory approval to sell its products (which could take several years). Thus, the Company has been dependent upon the proceeds from the sale of its securities to meet all of the Company’s liquidity and capital requirements and anticipates having to do so in the future.
The Company will be required to raise additional capital or find additional long-term financing to continue with its research efforts. The ability to raise capital may be dependent upon market conditions that are outside the control of the Company. The ability of the Company to complete the necessary clinical trials and obtain FDA approval for the sale of products to be developed on a commercial basis is uncertain. Ultimately, the Company must complete the development of its products, obtain the appropriate regulatory approvals and obtain sufficient revenues to support its cost structure. However, there can be no assurance that the Company will be able to raise sufficient capital to support its operations. Due to recurring losses from operations and future liquidity needs, there is substantial doubt about the Company’s ability to continue as a going concern.
Since the Company launched its Phase 3 clinical trial for Multikine, the Company has incurred expenses of approximately $64.6 million as of March 31, 2024 on direct costs for the Phase 3 clinical trial and the filing of the clinical study report to the FDA. The Company estimates it will incur additional expenses of approximately $0.6 million for the remainder of the Phase 3 clinical trial and the filing of the clinical study report to the FDA. It should be noted that this estimate is based only on the information currently available from the CROs responsible for managing the Phase 3 clinical trial and does not include other related costs, e.g., the manufacturing of the drug.
The Company uses two CROs to manage the global Phase 3 study; ICON and Ergomed, who are both international leaders in managing oncology trials.
Under a co-development agreement, Ergomed agreed to contribute up to $12 million towards the study where it will perform clinical services in exchange for a single digit percentage of milestone and royalty payments, up to a specified maximum amount. Approximately $11.9 million of the committed $12 million contribution has been realized as of March 31, 2024.
During the six months ended March 31, 2024, the Company’s cash increased by approximately $1.2 million. Significant components of this increase included net proceeds from the November 2023 and February 2024 financing of $11.5 million offset by cash used to fund the Company’s regular operations of approximately $9.4 million and approximately $0.9 million in payments on their finance lease obligations.
During the six months ended March 31, 2023, the Company’s cash decreased by approximately $12.6 million. The significant component of this decrease included cash used to fund the Company’s regular operations of approximately $12.1 million, which includes the approximate $2.3 million deposit made to the Company’s landlord as a result of falling below certain cash requirements per the San Tomas lease. Other components of this decrease include approximately $0.2 million used to make leasehold improvements and acquire research and development equipment, and approximately $0.8 million in payments on the Company’s finance leases.
During the six months ended March 31, 2024, no warrants were exercised. During the six months ended March 31, 2023, 217,752 warrants were exercised at a weighted average exercise price of $2.05 for total proceeds of approximately $0.5 million.
Results of Operations and Financial Condition
The Company incurred a net operating loss of approximately $13.6 million for the six months ended March 31, 2024. This net operating loss consists of significant non-cash expenses including approximately $3.2 million in share-based compensation to employees and non-employees, and approximately $2.0 million in depreciation and amortization expense. The Company incurred a net operating loss of approximately $7.1 million for the three months ended March 31, 2024. This net operating loss consists of significant non-cash expenses including approximately $1.6 million in share-based compensation to employees and non-employees, and approximately $1.0 million in depreciation and amortization expense.
During the six months ended March 31, 2024, research and development expenses decreased by approximately $2.5 million, or 22%, compared to the six months ended March 31, 2023. Major components of this decrease include an approximately $0.2 million decrease in costs incurred to prepare for the potential commercial sale of Multikine, an approximately $1.6 million decrease in expenses related to the Phase 3 study, a decrease of approximately $0.6 million of employee stock compensation expense and an approximately $0.1 million decrease in other research and development costs.
During the three months ended March 31, 2024, research and development expenses decreased by approximately $1.5 million, or 24%, compared to the three months ended March 31, 2023. Major components of this decrease include an approximately $1.0 million decrease in expenses related to the Phase 3 study, a decrease of approximately $0.4 million of employee stock compensation expense and an approximately $0.1 million decrease in other research and development costs.
During the six months ended March 31, 2024, general and administrative expenses increased by approximately $0.2 million, or 5%, compared to the six months ended March 31, 2023. This increase is primarily due to an approximately $0.1 million increase in consulting fees and an increase of approximately $0.1 million in other general and administrative costs.
During the three months ended March 31, 2024, general and administrative expenses increased by approximately $0.4 million, or 17%, compared to the three months ended March 31, 2023. This increase is primarily due to an approximately $0.2 million increase in consulting fees, an increase of approximately $0.1 million of employee stock compensation expense related to the accelerated vesting of options for directors, and a net increase of approximately $0.1 million in other general and administrative expenses.
During the six months ended March 31, 2024, net interest expense increased by approximately $0.1 million compared to the six months ended March 31, 2023. While the amount of interest paid on the Company’s lease liabilities remained relatively constant at approximately $0.5 million for the six months ended March 31, 2024 and 2023, the Company earned approximately $0.1 million less in interest income during the six months ended March 31, 2024 compared to the six months ended March 31, 2023. Net interest expense, which consists primarily of interest paid on lease liabilities, remained relatively constant at approximately $0.2 million for the three months ended March 31, 2024 and March 31, 2023.
Research and Development Expenses
The Company’s research and development efforts involve Multikine and LEAPS. The table below shows the research and development expenses associated with each project.
| | Six months ended | | | Three months ended | |
| | March 31, | | | March 31, | |
| | 2024 | | | 2023 | | | 2024 | | | 2023 | |
MULTIKINE | | $ | 8,934,795 | | | $ | 11,258,629 | | | $ | 4,605,543 | | | $ | 5,964,252 | |
LEAPS | | | 46,249 | | | | 217,405 | | | | 22,992 | | | | 119,236 | |
TOTAL | | $ | 8,981,044 | | | | 11,476,034 | | | | 4,628,535 | | | | 6,083,488 | |
Clinical and other studies necessary to obtain regulatory approval of a new drug involve significant costs and require several years to complete. The extent of the Company’s clinical trials and research programs are primarily based upon the amount of capital available to the Company and the extent to which the Company has received regulatory approvals for clinical trials. The inability of the Company to conduct clinical trials or research, whether due to a lack of capital or regulatory approval, will prevent the Company from completing the studies and research required to obtain regulatory approval for any products which the Company is developing. Without regulatory approval, the Company will be unable to sell any of its products. Since all of the Company’s projects are under development, the Company cannot predict when it will be able to generate any revenue from the sale of any of its products.
Critical Accounting Estimates
Management’s discussion and analysis of the Company’s financial condition and results of operations is based on its unaudited condensed financial statements. The preparation of these financial statements is based on the selection of accounting policies and the application of significant accounting estimates, some of which require management to make judgments, estimates and assumptions that affect the amounts reported in the financial statements and notes.
The Company believes some of the more critical estimates that affect its financial condition and results of operations are in the areas of leases and share-based compensation.
The measurement of the finance and operating lease right-of-use asset and lease liabilities requires the determination of an estimated lease term and an incremental borrowing rate, which involves complex judgment by management. Significant judgment is required by management to develop inputs and assumptions used to determine the incremental borrowing rate for lease contracts. The fair value of the stock options is calculated using the Black-Scholes option pricing model which requires various judgmental assumptions including volatility and expected option life. The compensation cost is recognized as expense over the requisite service or vesting period. Performance-based options are valued using a Monte-Carlo simulation model, which requires inputs based on estimates, including the likelihood of the occurrence of performance and market conditions, volatility and expected option life.
For more information regarding the Company’s critical accounting estimates, see Part II, Item 7 of the Company’s Annual Report on Form 10-K for the year ended September 30, 2023. The application of these critical accounting estimates has been discussed with the Audit Committee of the Company’s Board of Directors.
Item 3. QUANTITATIVE AND QUALITATIVE DISCLOSURES ABOUT MARKET RISKS
The Company does not believe that it has any significant exposure to market risk.
Item 4. CONTROLS AND PROCEDURES
Evaluation of Disclosure Controls and Procedures
Under the direction and with the participation of the Company’s management, including the Company’s Chief Executive Officer and Chief Financial Officer, the Company carried out an evaluation of the effectiveness of the design and operation of its disclosure controls and procedures as of March 31, 2024. The Company maintains disclosure controls and procedures that are designed to ensure that information required to be disclosed in its periodic reports with the Securities and Exchange Commission is recorded, processed, summarized and reported within the time periods specified in the SEC’s rules and regulations, and that such information is accumulated and communicated to the Company’s management, including its principal executive officer and principal financial officer, as appropriate, to allow timely decisions regarding required disclosure. The Company’s disclosure controls and procedures are designed to provide a reasonable level of assurance of reaching its desired disclosure control objectives.
The Company’s Chief Executive Officer and Chief Financial Officer has concluded that the Company’s disclosure controls and procedures were not effective as of March 31, 2024 due to the material weaknesses described in the Company's Annual Report on Form 10-K for the year ended September 30, 2023.
Changes in Internal Control over Financial Reporting
There were no changes in the Company’s internal control over financial reporting that occurred during the three months ended March 31, 2024 that have materially affected, or are reasonably likely to materially affect, the Company’s internal control over financial reporting.
PART II
Item 2. Unregistered Sales of Equity Securities and Use of Proceeds.
During the six months ended March 31, 2024, the Company issued 251,317 restricted shares of common stock to consultants for investor relations services.
The Company relied upon the exemption provided by Section 4(a)(2) of the Securities Act of 1933 with respect to the issuance of these shares. The individuals who acquired these shares were sophisticated investors and were provided full information regarding the Company’s business and operations. There was no general solicitation in connection with the offer or sale of these securities. The individuals who acquired these shares acquired them for their own accounts. The certificates representing these shares bear a restricted legend which provides they cannot be sold except pursuant to an effective registration statement or an exemption from registration. No commission or other form of remuneration was given to any person in connection with the issuance of these shares.
Item 5. Other Information
None of our directors or officers adopted or terminated a Rule 10b5-1 trading arrangement or a non-Rule 10b5-1 trading arrangement (as defined in Item 408(c) of Regulation S-K) during the quarterly period ending March 31, 2024.
Item 6. Exhibits
SIGNATURES
Pursuant to the requirements of the Securities Exchange Act of 1934, the Registrant has duly caused this report to be signed on its behalf by the undersigned thereunto duly authorized.
| CEL-SCI CORPORATION | |
| | | |
Date: May 15, 2024 | By: | /s/ Geert Kersten | |
| | Geert Kersten | |
| | Principal Executive Officer* | |
* Also signing in the capacity of the Principal Accounting and Financial Officer.
nullnull
v3.24.1.1.u2
| X |
- DefinitionBoolean flag that is true when the XBRL content amends previously-filed or accepted submission.
| Name: |
dei_AmendmentFlag |
| Namespace Prefix: |
dei_ |
| Data Type: |
xbrli:booleanItemType |
| Balance Type: |
na |
| Period Type: |
duration |
|
| X |
- DefinitionEnd date of current fiscal year in the format --MM-DD.
| Name: |
dei_CurrentFiscalYearEndDate |
| Namespace Prefix: |
dei_ |
| Data Type: |
xbrli:gMonthDayItemType |
| Balance Type: |
na |
| Period Type: |
duration |
|
| X |
- DefinitionFiscal period values are FY, Q1, Q2, and Q3. 1st, 2nd and 3rd quarter 10-Q or 10-QT statements have value Q1, Q2, and Q3 respectively, with 10-K, 10-KT or other fiscal year statements having FY.
| Name: |
dei_DocumentFiscalPeriodFocus |
| Namespace Prefix: |
dei_ |
| Data Type: |
dei:fiscalPeriodItemType |
| Balance Type: |
na |
| Period Type: |
duration |
|
| X |
- DefinitionThis is focus fiscal year of the document report in YYYY format. For a 2006 annual report, which may also provide financial information from prior periods, fiscal 2006 should be given as the fiscal year focus. Example: 2006.
| Name: |
dei_DocumentFiscalYearFocus |
| Namespace Prefix: |
dei_ |
| Data Type: |
xbrli:gYearItemType |
| Balance Type: |
na |
| Period Type: |
duration |
|
| X |
- DefinitionFor the EDGAR submission types of Form 8-K: the date of the report, the date of the earliest event reported; for the EDGAR submission types of Form N-1A: the filing date; for all other submission types: the end of the reporting or transition period. The format of the date is YYYY-MM-DD.
| Name: |
dei_DocumentPeriodEndDate |
| Namespace Prefix: |
dei_ |
| Data Type: |
xbrli:dateItemType |
| Balance Type: |
na |
| Period Type: |
duration |
|
| X |
- DefinitionBoolean flag that is true only for a form used as an quarterly report. Reference 1: http://www.xbrl.org/2003/role/presentationRef
-Publisher SEC
-Name Form 10-Q
-Number 240
-Section 308
-Subsection a
| Name: |
dei_DocumentQuarterlyReport |
| Namespace Prefix: |
dei_ |
| Data Type: |
xbrli:booleanItemType |
| Balance Type: |
na |
| Period Type: |
duration |
|
| X |
- DefinitionBoolean flag that is true only for a form used as a transition report. Reference 1: http://www.xbrl.org/2003/role/presentationRef
-Publisher SEC
-Name Forms 10-K, 10-Q, 20-F
-Number 240
-Section 13
-Subsection a-1
| Name: |
dei_DocumentTransitionReport |
| Namespace Prefix: |
dei_ |
| Data Type: |
xbrli:booleanItemType |
| Balance Type: |
na |
| Period Type: |
duration |
|
| X |
- DefinitionThe type of document being provided (such as 10-K, 10-Q, 485BPOS, etc). The document type is limited to the same value as the supporting SEC submission type, or the word 'Other'.
| Name: |
dei_DocumentType |
| Namespace Prefix: |
dei_ |
| Data Type: |
dei:submissionTypeItemType |
| Balance Type: |
na |
| Period Type: |
duration |
|
| X |
- DefinitionAddress Line 1 such as Attn, Building Name, Street Name
| Name: |
dei_EntityAddressAddressLine1 |
| Namespace Prefix: |
dei_ |
| Data Type: |
xbrli:normalizedStringItemType |
| Balance Type: |
na |
| Period Type: |
duration |
|
| X |
- DefinitionAddress Line 2 such as Street or Suite number
| Name: |
dei_EntityAddressAddressLine2 |
| Namespace Prefix: |
dei_ |
| Data Type: |
xbrli:normalizedStringItemType |
| Balance Type: |
na |
| Period Type: |
duration |
|
| X |
- Definition
+ References
+ Details
| Name: |
dei_EntityAddressCityOrTown |
| Namespace Prefix: |
dei_ |
| Data Type: |
xbrli:normalizedStringItemType |
| Balance Type: |
na |
| Period Type: |
duration |
|
| X |
- DefinitionCode for the postal or zip code
| Name: |
dei_EntityAddressPostalZipCode |
| Namespace Prefix: |
dei_ |
| Data Type: |
xbrli:normalizedStringItemType |
| Balance Type: |
na |
| Period Type: |
duration |
|
| X |
- DefinitionName of the state or province.
| Name: |
dei_EntityAddressStateOrProvince |
| Namespace Prefix: |
dei_ |
| Data Type: |
dei:stateOrProvinceItemType |
| Balance Type: |
na |
| Period Type: |
duration |
|
| X |
- DefinitionA unique 10-digit SEC-issued value to identify entities that have filed disclosures with the SEC. It is commonly abbreviated as CIK. Reference 1: http://www.xbrl.org/2003/role/presentationRef
-Publisher SEC
-Name Exchange Act
-Number 240
-Section 12
-Subsection b-2
| Name: |
dei_EntityCentralIndexKey |
| Namespace Prefix: |
dei_ |
| Data Type: |
dei:centralIndexKeyItemType |
| Balance Type: |
na |
| Period Type: |
duration |
|
| X |
- DefinitionIndicate number of shares or other units outstanding of each of registrant's classes of capital or common stock or other ownership interests, if and as stated on cover of related periodic report. Where multiple classes or units exist define each class/interest by adding class of stock items such as Common Class A [Member], Common Class B [Member] or Partnership Interest [Member] onto the Instrument [Domain] of the Entity Listings, Instrument.
| Name: |
dei_EntityCommonStockSharesOutstanding |
| Namespace Prefix: |
dei_ |
| Data Type: |
xbrli:sharesItemType |
| Balance Type: |
na |
| Period Type: |
instant |
|
| X |
- DefinitionIndicate 'Yes' or 'No' whether registrants (1) have filed all reports required to be filed by Section 13 or 15(d) of the Securities Exchange Act of 1934 during the preceding 12 months (or for such shorter period that registrants were required to file such reports), and (2) have been subject to such filing requirements for the past 90 days. This information should be based on the registrant's current or most recent filing containing the related disclosure.
| Name: |
dei_EntityCurrentReportingStatus |
| Namespace Prefix: |
dei_ |
| Data Type: |
dei:yesNoItemType |
| Balance Type: |
na |
| Period Type: |
duration |
|
| X |
- DefinitionIndicate if registrant meets the emerging growth company criteria. Reference 1: http://www.xbrl.org/2003/role/presentationRef
-Publisher SEC
-Name Exchange Act
-Number 240
-Section 12
-Subsection b-2
| Name: |
dei_EntityEmergingGrowthCompany |
| Namespace Prefix: |
dei_ |
| Data Type: |
xbrli:booleanItemType |
| Balance Type: |
na |
| Period Type: |
duration |
|
| X |
- DefinitionCommission file number. The field allows up to 17 characters. The prefix may contain 1-3 digits, the sequence number may contain 1-8 digits, the optional suffix may contain 1-4 characters, and the fields are separated with a hyphen.
| Name: |
dei_EntityFileNumber |
| Namespace Prefix: |
dei_ |
| Data Type: |
dei:fileNumberItemType |
| Balance Type: |
na |
| Period Type: |
duration |
|
| X |
- DefinitionIndicate whether the registrant is one of the following: Large Accelerated Filer, Accelerated Filer, Non-accelerated Filer. Definitions of these categories are stated in Rule 12b-2 of the Exchange Act. This information should be based on the registrant's current or most recent filing containing the related disclosure. Reference 1: http://www.xbrl.org/2003/role/presentationRef
-Publisher SEC
-Name Exchange Act
-Number 240
-Section 12
-Subsection b-2
| Name: |
dei_EntityFilerCategory |
| Namespace Prefix: |
dei_ |
| Data Type: |
dei:filerCategoryItemType |
| Balance Type: |
na |
| Period Type: |
duration |
|
| X |
- DefinitionTwo-character EDGAR code representing the state or country of incorporation.
| Name: |
dei_EntityIncorporationStateCountryCode |
| Namespace Prefix: |
dei_ |
| Data Type: |
dei:edgarStateCountryItemType |
| Balance Type: |
na |
| Period Type: |
duration |
|
| X |
- DefinitionBoolean flag that is true when the registrant has submitted electronically every Interactive Data File required to be submitted pursuant to Rule 405 of Regulation S-T during the preceding 12 months (or for such shorter period that the registrant was required to submit such files). Reference 1: http://www.xbrl.org/2003/role/presentationRef
-Publisher SEC
-Name Regulation S-T
-Number 232
-Section 405
| Name: |
dei_EntityInteractiveDataCurrent |
| Namespace Prefix: |
dei_ |
| Data Type: |
dei:yesNoItemType |
| Balance Type: |
na |
| Period Type: |
duration |
|
| X |
- DefinitionThe exact name of the entity filing the report as specified in its charter, which is required by forms filed with the SEC. Reference 1: http://www.xbrl.org/2003/role/presentationRef
-Publisher SEC
-Name Exchange Act
-Number 240
-Section 12
-Subsection b-2
| Name: |
dei_EntityRegistrantName |
| Namespace Prefix: |
dei_ |
| Data Type: |
xbrli:normalizedStringItemType |
| Balance Type: |
na |
| Period Type: |
duration |
|
| X |
- DefinitionBoolean flag that is true when the registrant is a shell company as defined in Rule 12b-2 of the Exchange Act. Reference 1: http://www.xbrl.org/2003/role/presentationRef
-Publisher SEC
-Name Exchange Act
-Number 240
-Section 12
-Subsection b-2
| Name: |
dei_EntityShellCompany |
| Namespace Prefix: |
dei_ |
| Data Type: |
xbrli:booleanItemType |
| Balance Type: |
na |
| Period Type: |
duration |
|
| X |
- DefinitionIndicates that the company is a Smaller Reporting Company (SRC). Reference 1: http://www.xbrl.org/2003/role/presentationRef
-Publisher SEC
-Name Exchange Act
-Number 240
-Section 12
-Subsection b-2
| Name: |
dei_EntitySmallBusiness |
| Namespace Prefix: |
dei_ |
| Data Type: |
xbrli:booleanItemType |
| Balance Type: |
na |
| Period Type: |
duration |
|
| X |
- DefinitionThe Tax Identification Number (TIN), also known as an Employer Identification Number (EIN), is a unique 9-digit value assigned by the IRS. Reference 1: http://www.xbrl.org/2003/role/presentationRef
-Publisher SEC
-Name Exchange Act
-Number 240
-Section 12
-Subsection b-2
| Name: |
dei_EntityTaxIdentificationNumber |
| Namespace Prefix: |
dei_ |
| Data Type: |
dei:employerIdItemType |
| Balance Type: |
na |
| Period Type: |
duration |
|
| X |
- DefinitionLocal phone number for entity.
| Name: |
dei_LocalPhoneNumber |
| Namespace Prefix: |
dei_ |
| Data Type: |
xbrli:normalizedStringItemType |
| Balance Type: |
na |
| Period Type: |
duration |
|
| X |
- DefinitionTitle of a 12(b) registered security. Reference 1: http://www.xbrl.org/2003/role/presentationRef
-Publisher SEC
-Name Exchange Act
-Number 240
-Section 12
-Subsection b
| Name: |
dei_Security12bTitle |
| Namespace Prefix: |
dei_ |
| Data Type: |
dei:securityTitleItemType |
| Balance Type: |
na |
| Period Type: |
duration |
|
| X |
- DefinitionName of the Exchange on which a security is registered. Reference 1: http://www.xbrl.org/2003/role/presentationRef
-Publisher SEC
-Name Exchange Act
-Number 240
-Section 12
-Subsection d1-1
| Name: |
dei_SecurityExchangeName |
| Namespace Prefix: |
dei_ |
| Data Type: |
dei:edgarExchangeCodeItemType |
| Balance Type: |
na |
| Period Type: |
duration |
|
| X |
- DefinitionTrading symbol of an instrument as listed on an exchange.
| Name: |
dei_TradingSymbol |
| Namespace Prefix: |
dei_ |
| Data Type: |
dei:tradingSymbolItemType |
| Balance Type: |
na |
| Period Type: |
duration |
|
v3.24.1.1.u2
CONDENSED BALANCE SHEETS - USD ($)
|
Mar. 31, 2024 |
Sep. 30, 2023 |
| Current assets: |
|
|
| Cash and cash equivalents |
$ 5,309,321
|
$ 4,145,735
|
| Prepaid expenses |
696,648
|
520,368
|
| Supplies used for R&D and manufacturing |
2,489,284
|
2,248,072
|
| Deposits |
16,129
|
4,245
|
| Total current assets |
8,511,382
|
6,918,420
|
| Finance lease right of use assets |
8,251,453
|
9,131,987
|
| Operating lease right of use assets |
1,598,879
|
1,698,243
|
| Property and equipment, net |
9,113,284
|
10,188,126
|
| Patent costs, net |
180,482
|
197,704
|
| Deposits |
2,319,101
|
2,319,101
|
| Supplies used for R&D and manufacturing |
73,524
|
74,669
|
| Total assets |
30,048,105
|
30,528,250
|
| Current liabilities: |
|
|
| Accounts payable |
1,015,969
|
2,009,786
|
| Accrued expenses |
1,219,399
|
1,049,581
|
| Due to employees |
751,607
|
557,244
|
| Finance lease obligation, current portion |
1,888,767
|
1,771,804
|
| Operating lease obligation, current portion |
211,275
|
197,431
|
| Total current liabilities |
5,087,017
|
5,585,846
|
| Finance lease obligations, net of current portion |
8,987,319
|
9,949,565
|
| Operating lease obligations, net of current portion |
1,544,126
|
1,652,949
|
| Other liabilities |
125,000
|
125,000
|
| Total liabilities |
15,743,462
|
17,313,360
|
| STOCKHOLDERS' EQUITY |
|
|
| Preferred stock, $.01 par value; 200,000 shares authorized; 0 shares issued and outstanding |
0
|
0
|
| Common stock, $.01 par value; 600,000,000 shares authorized; 54,083,718 and 47,422,304 shares issued and outstanding at March 31, 2024 and September 30, 2023, respectively |
540,837
|
474,223
|
| Additional paid-in capital |
514,809,617
|
499,832,063
|
| Accumulated deficit |
(501,045,811)
|
(487,091,396)
|
| Total stockholders' equity |
14,304,643
|
13,214,890
|
| TOTAL LIABILITIES AND STOCKHOLDERS' EQUITY |
$ 30,048,105
|
$ 30,528,250
|
| X |
- References
+ Details
| Name: |
cvm_DueToEmployeeCurrent |
| Namespace Prefix: |
cvm_ |
| Data Type: |
xbrli:monetaryItemType |
| Balance Type: |
credit |
| Period Type: |
instant |
|
| X |
- References
+ Details
| Name: |
cvm_SuppliesUsedForRDAndManufacturingCurrent |
| Namespace Prefix: |
cvm_ |
| Data Type: |
xbrli:monetaryItemType |
| Balance Type: |
debit |
| Period Type: |
instant |
|
| X |
- References
+ Details
| Name: |
cvm_SuppliesUsedForRDAndManufacturingNonCurrent |
| Namespace Prefix: |
cvm_ |
| Data Type: |
xbrli:monetaryItemType |
| Balance Type: |
debit |
| Period Type: |
instant |
|
| X |
- DefinitionCarrying value as of the balance sheet date of liabilities incurred (and for which invoices have typically been received) and payable to vendors for goods and services received that are used in an entity's business. Used to reflect the current portion of the liabilities (due within one year or within the normal operating cycle if longer). Reference 1: http://www.xbrl.org/2003/role/exampleRef
-Topic 852
-SubTopic 10
-Name Accounting Standards Codification
-Section 55
-Paragraph 10
-Publisher FASB
-URI https://asc.fasb.org//1943274/2147481372/852-10-55-10
Reference 2: http://fasb.org/us-gaap/role/ref/legacyRef
-Name Accounting Standards Codification
-Topic 210
-SubTopic 10
-Section S99
-Paragraph 1
-Subparagraph (SX 210.5-02.19(a))
-Publisher FASB
-URI https://asc.fasb.org//1943274/2147480566/210-10-S99-1
| Name: |
us-gaap_AccountsPayableCurrent |
| Namespace Prefix: |
us-gaap_ |
| Data Type: |
xbrli:monetaryItemType |
| Balance Type: |
credit |
| Period Type: |
instant |
|
| X |
- DefinitionCarrying value as of the balance sheet date of obligations incurred and payable, pertaining to costs that are statutory in nature, are incurred on contractual obligations, or accumulate over time and for which invoices have not yet been received or will not be rendered. Examples include taxes, interest, rent and utilities. Used to reflect the current portion of the liabilities (due within one year or within the normal operating cycle if longer). Reference 1: http://fasb.org/us-gaap/role/ref/legacyRef
-Name Accounting Standards Codification
-Topic 210
-SubTopic 10
-Section S99
-Paragraph 1
-Subparagraph (SX 210.5-02.20)
-Publisher FASB
-URI https://asc.fasb.org//1943274/2147480566/210-10-S99-1
| Name: |
us-gaap_AccruedLiabilitiesCurrent |
| Namespace Prefix: |
us-gaap_ |
| Data Type: |
xbrli:monetaryItemType |
| Balance Type: |
credit |
| Period Type: |
instant |
|
| X |
- DefinitionAmount of excess of issue price over par or stated value of stock and from other transaction involving stock or stockholder. Includes, but is not limited to, additional paid-in capital (APIC) for common and preferred stock. Reference 1: http://www.xbrl.org/2003/role/exampleRef
-Topic 852
-SubTopic 10
-Name Accounting Standards Codification
-Section 55
-Paragraph 10
-Publisher FASB
-URI https://asc.fasb.org//1943274/2147481372/852-10-55-10
Reference 2: http://www.xbrl.org/2009/role/commonPracticeRef
-Topic 946
-SubTopic 210
-Name Accounting Standards Codification
-Section S99
-Paragraph 1
-Subparagraph (SX 210.6-04(18))
-Publisher FASB
-URI https://asc.fasb.org//1943274/2147479617/946-210-S99-1
Reference 3: http://fasb.org/us-gaap/role/ref/legacyRef
-Topic 210
-SubTopic 10
-Name Accounting Standards Codification
-Section S99
-Paragraph 1
-Subparagraph (SX 210.5-02(30)(a)(1))
-Publisher FASB
-URI https://asc.fasb.org//1943274/2147480566/210-10-S99-1
| Name: |
us-gaap_AdditionalPaidInCapital |
| Namespace Prefix: |
us-gaap_ |
| Data Type: |
xbrli:monetaryItemType |
| Balance Type: |
credit |
| Period Type: |
instant |
|
| X |
- DefinitionSum of the carrying amounts as of the balance sheet date of all assets that are recognized. Assets are probable future economic benefits obtained or controlled by an entity as a result of past transactions or events. Reference 1: http://www.xbrl.org/2003/role/disclosureRef
-Topic 810
-SubTopic 10
-Name Accounting Standards Codification
-Section 50
-Paragraph 3
-Subparagraph (bb)
-Publisher FASB
-URI https://asc.fasb.org//1943274/2147481203/810-10-50-3
Reference 2: http://www.xbrl.org/2003/role/disclosureRef
-Topic 810
-SubTopic 10
-Name Accounting Standards Codification
-Section 45
-Paragraph 25
-Subparagraph (a)
-Publisher FASB
-URI https://asc.fasb.org//1943274/2147481231/810-10-45-25
Reference 3: http://www.xbrl.org/2003/role/disclosureRef
-Topic 235
-SubTopic 10
-Name Accounting Standards Codification
-Section S99
-Paragraph 1
-Subparagraph (SX 210.4-08(g)(1)(ii))
-Publisher FASB
-URI https://asc.fasb.org//1943274/2147480678/235-10-S99-1
Reference 4: http://www.xbrl.org/2003/role/disclosureRef
-Topic 323
-SubTopic 10
-Name Accounting Standards Codification
-Section 50
-Paragraph 3
-Subparagraph (c)
-Publisher FASB
-URI https://asc.fasb.org//1943274/2147481687/323-10-50-3
Reference 5: http://www.xbrl.org/2003/role/disclosureRef
-Topic 825
-SubTopic 10
-Name Accounting Standards Codification
-Section 50
-Paragraph 28
-Subparagraph (f)
-Publisher FASB
-URI https://asc.fasb.org//1943274/2147482907/825-10-50-28
Reference 6: http://www.xbrl.org/2003/role/exampleRef
-Topic 852
-SubTopic 10
-Name Accounting Standards Codification
-Section 55
-Paragraph 10
-Publisher FASB
-URI https://asc.fasb.org//1943274/2147481372/852-10-55-10
Reference 7: http://www.xbrl.org/2003/role/exampleRef
-Topic 946
-SubTopic 830
-Name Accounting Standards Codification
-Section 55
-Paragraph 12
-Publisher FASB
-URI https://asc.fasb.org//1943274/2147480167/946-830-55-12
Reference 8: http://www.xbrl.org/2003/role/disclosureRef
-Topic 944
-SubTopic 210
-Name Accounting Standards Codification
-Section S99
-Paragraph 1
-Subparagraph (SX 210.7-03(a)(12))
-Publisher FASB
-URI https://asc.fasb.org//1943274/2147479440/944-210-S99-1
Reference 9: http://www.xbrl.org/2003/role/disclosureRef
-Topic 280
-SubTopic 10
-Name Accounting Standards Codification
-Section 50
-Paragraph 22
-Publisher FASB
-URI https://asc.fasb.org//1943274/2147482810/280-10-50-22
Reference 10: http://www.xbrl.org/2003/role/disclosureRef
-Topic 946
-SubTopic 210
-Name Accounting Standards Codification
-Section S99
-Paragraph 1
-Subparagraph (SX 210.6-04(8))
-Publisher FASB
-URI https://asc.fasb.org//1943274/2147479617/946-210-S99-1
Reference 11: http://www.xbrl.org/2003/role/disclosureRef
-Topic 210
-SubTopic 10
-Name Accounting Standards Codification
-Section S99
-Paragraph 1
-Subparagraph (SX 210.5-02(18))
-Publisher FASB
-URI https://asc.fasb.org//1943274/2147480566/210-10-S99-1
Reference 12: http://www.xbrl.org/2003/role/disclosureRef
-Topic 470
-SubTopic 10
-Name Accounting Standards Codification
-Section S99
-Paragraph 1A
-Subparagraph (SX 210.13-01(a)(4)(i))
-Publisher FASB
-URI https://asc.fasb.org//1943274/2147480097/470-10-S99-1A
Reference 13: http://www.xbrl.org/2009/role/commonPracticeRef
-Topic 470
-SubTopic 10
-Name Accounting Standards Codification
-Section S99
-Paragraph 1A
-Subparagraph (SX 210.13-01(a)(4)(ii))
-Publisher FASB
-URI https://asc.fasb.org//1943274/2147480097/470-10-S99-1A
Reference 14: http://www.xbrl.org/2009/role/commonPracticeRef
-Topic 470
-SubTopic 10
-Name Accounting Standards Codification
-Section S99
-Paragraph 1A
-Subparagraph (SX 210.13-01(a)(4)(iii))
-Publisher FASB
-URI https://asc.fasb.org//1943274/2147480097/470-10-S99-1A
Reference 15: http://www.xbrl.org/2003/role/disclosureRef
-Topic 470
-SubTopic 10
-Name Accounting Standards Codification
-Section S99
-Paragraph 1A
-Subparagraph (SX 210.13-01(a)(4)(iii)(A))
-Publisher FASB
-URI https://asc.fasb.org//1943274/2147480097/470-10-S99-1A
Reference 16: http://www.xbrl.org/2003/role/disclosureRef
-Topic 470
-SubTopic 10
-Name Accounting Standards Codification
-Section S99
-Paragraph 1A
-Subparagraph (SX 210.13-01(a)(4)(iv))
-Publisher FASB
-URI https://asc.fasb.org//1943274/2147480097/470-10-S99-1A
Reference 17: http://www.xbrl.org/2003/role/disclosureRef
-Topic 470
-SubTopic 10
-Name Accounting Standards Codification
-Section S99
-Paragraph 1A
-Subparagraph (SX 210.13-01(a)(5))
-Publisher FASB
-URI https://asc.fasb.org//1943274/2147480097/470-10-S99-1A
Reference 18: http://www.xbrl.org/2003/role/disclosureRef
-Topic 470
-SubTopic 10
-Name Accounting Standards Codification
-Section S99
-Paragraph 1B
-Subparagraph (SX 210.13-02(a)(4)(i))
-Publisher FASB
-URI https://asc.fasb.org//1943274/2147480097/470-10-S99-1B
Reference 19: http://www.xbrl.org/2003/role/disclosureRef
-Topic 470
-SubTopic 10
-Name Accounting Standards Codification
-Section S99
-Paragraph 1B
-Subparagraph (SX 210.13-02(a)(4)(iii)(A))
-Publisher FASB
-URI https://asc.fasb.org//1943274/2147480097/470-10-S99-1B
Reference 20: http://www.xbrl.org/2003/role/disclosureRef
-Topic 470
-SubTopic 10
-Name Accounting Standards Codification
-Section S99
-Paragraph 1B
-Subparagraph (SX 210.13-02(a)(4)(iii)(B))
-Publisher FASB
-URI https://asc.fasb.org//1943274/2147480097/470-10-S99-1B
Reference 21: http://www.xbrl.org/2003/role/disclosureRef
-Topic 470
-SubTopic 10
-Name Accounting Standards Codification
-Section S99
-Paragraph 1B
-Subparagraph (SX 210.13-02(a)(4)(iv))
-Publisher FASB
-URI https://asc.fasb.org//1943274/2147480097/470-10-S99-1B
Reference 22: http://www.xbrl.org/2003/role/disclosureRef
-Topic 470
-SubTopic 10
-Name Accounting Standards Codification
-Section S99
-Paragraph 1B
-Subparagraph (SX 210.13-02(a)(5))
-Publisher FASB
-URI https://asc.fasb.org//1943274/2147480097/470-10-S99-1B
Reference 23: http://www.xbrl.org/2009/role/commonPracticeRef
-Topic 852
-SubTopic 10
-Name Accounting Standards Codification
-Section 50
-Paragraph 7
-Subparagraph (a)
-Publisher FASB
-URI https://asc.fasb.org//1943274/2147481404/852-10-50-7
Reference 24: http://www.xbrl.org/2003/role/disclosureRef
-Topic 280
-SubTopic 10
-Name Accounting Standards Codification
-Section 50
-Paragraph 30
-Subparagraph (c)
-Publisher FASB
-URI https://asc.fasb.org//1943274/2147482810/280-10-50-30
Reference 25: http://www.xbrl.org/2003/role/disclosureRef
-Topic 280
-SubTopic 10
-Name Accounting Standards Codification
-Section 50
-Paragraph 32
-Subparagraph (d)
-Publisher FASB
-URI https://asc.fasb.org//1943274/2147482810/280-10-50-32
Reference 26: http://fasb.org/us-gaap/role/ref/legacyRef
-Topic 942
-SubTopic 210
-Name Accounting Standards Codification
-Section S99
-Paragraph 1
-Subparagraph (SX 210.9-03(11))
-Publisher FASB
-URI https://asc.fasb.org//1943274/2147479853/942-210-S99-1
| Name: |
us-gaap_Assets |
| Namespace Prefix: |
us-gaap_ |
| Data Type: |
xbrli:monetaryItemType |
| Balance Type: |
debit |
| Period Type: |
instant |
|
| X |
- DefinitionSum of the carrying amounts as of the balance sheet date of all assets that are expected to be realized in cash, sold, or consumed within one year (or the normal operating cycle, if longer). Assets are probable future economic benefits obtained or controlled by an entity as a result of past transactions or events. Reference 1: http://www.xbrl.org/2003/role/disclosureRef
-Topic 810
-SubTopic 10
-Name Accounting Standards Codification
-Section 50
-Paragraph 3
-Subparagraph (bb)
-Publisher FASB
-URI https://asc.fasb.org//1943274/2147481203/810-10-50-3
Reference 2: http://www.xbrl.org/2003/role/disclosureRef
-Topic 810
-SubTopic 10
-Name Accounting Standards Codification
-Section 45
-Paragraph 25
-Subparagraph (a)
-Publisher FASB
-URI https://asc.fasb.org//1943274/2147481231/810-10-45-25
Reference 3: http://www.xbrl.org/2003/role/disclosureRef
-Topic 235
-SubTopic 10
-Name Accounting Standards Codification
-Section S99
-Paragraph 1
-Subparagraph (SX 210.4-08(g)(1)(ii))
-Publisher FASB
-URI https://asc.fasb.org//1943274/2147480678/235-10-S99-1
Reference 4: http://www.xbrl.org/2003/role/disclosureRef
-Topic 323
-SubTopic 10
-Name Accounting Standards Codification
-Section 50
-Paragraph 3
-Subparagraph (c)
-Publisher FASB
-URI https://asc.fasb.org//1943274/2147481687/323-10-50-3
Reference 5: http://www.xbrl.org/2003/role/disclosureRef
-Topic 825
-SubTopic 10
-Name Accounting Standards Codification
-Section 50
-Paragraph 28
-Subparagraph (f)
-Publisher FASB
-URI https://asc.fasb.org//1943274/2147482907/825-10-50-28
Reference 6: http://www.xbrl.org/2003/role/exampleRef
-Topic 852
-SubTopic 10
-Name Accounting Standards Codification
-Section 55
-Paragraph 10
-Publisher FASB
-URI https://asc.fasb.org//1943274/2147481372/852-10-55-10
Reference 7: http://www.xbrl.org/2003/role/disclosureRef
-Topic 210
-SubTopic 10
-Name Accounting Standards Codification
-Section 45
-Paragraph 1
-Publisher FASB
-URI https://asc.fasb.org//1943274/2147483467/210-10-45-1
Reference 8: http://www.xbrl.org/2003/role/disclosureRef
-Topic 210
-SubTopic 10
-Name Accounting Standards Codification
-Section S99
-Paragraph 1
-Subparagraph (SX 210.5-02(9))
-Publisher FASB
-URI https://asc.fasb.org//1943274/2147480566/210-10-S99-1
Reference 9: http://www.xbrl.org/2003/role/disclosureRef
-Topic 470
-SubTopic 10
-Name Accounting Standards Codification
-Section S99
-Paragraph 1A
-Subparagraph (SX 210.13-01(a)(4)(i))
-Publisher FASB
-URI https://asc.fasb.org//1943274/2147480097/470-10-S99-1A
Reference 10: http://www.xbrl.org/2009/role/commonPracticeRef
-Topic 470
-SubTopic 10
-Name Accounting Standards Codification
-Section S99
-Paragraph 1A
-Subparagraph (SX 210.13-01(a)(4)(ii))
-Publisher FASB
-URI https://asc.fasb.org//1943274/2147480097/470-10-S99-1A
Reference 11: http://www.xbrl.org/2009/role/commonPracticeRef
-Topic 470
-SubTopic 10
-Name Accounting Standards Codification
-Section S99
-Paragraph 1A
-Subparagraph (SX 210.13-01(a)(4)(iii))
-Publisher FASB
-URI https://asc.fasb.org//1943274/2147480097/470-10-S99-1A
Reference 12: http://www.xbrl.org/2003/role/disclosureRef
-Topic 470
-SubTopic 10
-Name Accounting Standards Codification
-Section S99
-Paragraph 1A
-Subparagraph (SX 210.13-01(a)(4)(iii)(A))
-Publisher FASB
-URI https://asc.fasb.org//1943274/2147480097/470-10-S99-1A
Reference 13: http://www.xbrl.org/2003/role/disclosureRef
-Topic 470
-SubTopic 10
-Name Accounting Standards Codification
-Section S99
-Paragraph 1A
-Subparagraph (SX 210.13-01(a)(4)(iv))
-Publisher FASB
-URI https://asc.fasb.org//1943274/2147480097/470-10-S99-1A
Reference 14: http://www.xbrl.org/2003/role/disclosureRef
-Topic 470
-SubTopic 10
-Name Accounting Standards Codification
-Section S99
-Paragraph 1A
-Subparagraph (SX 210.13-01(a)(5))
-Publisher FASB
-URI https://asc.fasb.org//1943274/2147480097/470-10-S99-1A
Reference 15: http://www.xbrl.org/2003/role/disclosureRef
-Topic 470
-SubTopic 10
-Name Accounting Standards Codification
-Section S99
-Paragraph 1B
-Subparagraph (SX 210.13-02(a)(4)(i))
-Publisher FASB
-URI https://asc.fasb.org//1943274/2147480097/470-10-S99-1B
Reference 16: http://www.xbrl.org/2003/role/disclosureRef
-Topic 470
-SubTopic 10
-Name Accounting Standards Codification
-Section S99
-Paragraph 1B
-Subparagraph (SX 210.13-02(a)(4)(iii)(A))
-Publisher FASB
-URI https://asc.fasb.org//1943274/2147480097/470-10-S99-1B
Reference 17: http://www.xbrl.org/2003/role/disclosureRef
-Topic 470
-SubTopic 10
-Name Accounting Standards Codification
-Section S99
-Paragraph 1B
-Subparagraph (SX 210.13-02(a)(4)(iii)(B))
-Publisher FASB
-URI https://asc.fasb.org//1943274/2147480097/470-10-S99-1B
Reference 18: http://www.xbrl.org/2003/role/disclosureRef
-Topic 470
-SubTopic 10
-Name Accounting Standards Codification
-Section S99
-Paragraph 1B
-Subparagraph (SX 210.13-02(a)(4)(iv))
-Publisher FASB
-URI https://asc.fasb.org//1943274/2147480097/470-10-S99-1B
Reference 19: http://www.xbrl.org/2003/role/disclosureRef
-Topic 470
-SubTopic 10
-Name Accounting Standards Codification
-Section S99
-Paragraph 1B
-Subparagraph (SX 210.13-02(a)(5))
-Publisher FASB
-URI https://asc.fasb.org//1943274/2147480097/470-10-S99-1B
Reference 20: http://www.xbrl.org/2009/role/commonPracticeRef
-Topic 852
-SubTopic 10
-Name Accounting Standards Codification
-Section 50
-Paragraph 7
-Subparagraph (a)
-Publisher FASB
-URI https://asc.fasb.org//1943274/2147481404/852-10-50-7
| Name: |
us-gaap_AssetsCurrent |
| Namespace Prefix: |
us-gaap_ |
| Data Type: |
xbrli:monetaryItemType |
| Balance Type: |
debit |
| Period Type: |
instant |
|
| X |
- References
+ Details
| Name: |
us-gaap_AssetsCurrentAbstract |
| Namespace Prefix: |
us-gaap_ |
| Data Type: |
xbrli:stringItemType |
| Balance Type: |
na |
| Period Type: |
duration |
|
| X |
- DefinitionAmount of cash and cash equivalents, and cash and cash equivalents restricted to withdrawal or usage. Excludes amount for disposal group and discontinued operations. Cash includes, but is not limited to, currency on hand, demand deposits with banks or financial institutions, and other accounts with general characteristics of demand deposits. Cash equivalents include, but are not limited to, short-term, highly liquid investments that are both readily convertible to known amounts of cash and so near their maturity that they present insignificant risk of changes in value because of changes in interest rates. Reference 1: http://www.xbrl.org/2003/role/disclosureRef
-Topic 230
-SubTopic 10
-Name Accounting Standards Codification
-Section 50
-Paragraph 8
-Publisher FASB
-URI https://asc.fasb.org//1943274/2147482913/230-10-50-8
Reference 2: http://fasb.org/us-gaap/role/ref/legacyRef
-Topic 230
-SubTopic 10
-Name Accounting Standards Codification
-Section 45
-Paragraph 24
-Publisher FASB
-URI https://asc.fasb.org//1943274/2147482740/230-10-45-24
Reference 3: http://fasb.org/us-gaap/role/ref/legacyRef
-Name Accounting Standards Codification
-Topic 230
-SubTopic 10
-Section 45
-Paragraph 4
-Publisher FASB
-URI https://asc.fasb.org//1943274/2147482740/230-10-45-4
| Name: |
us-gaap_CashCashEquivalentsRestrictedCashAndRestrictedCashEquivalents |
| Namespace Prefix: |
us-gaap_ |
| Data Type: |
xbrli:monetaryItemType |
| Balance Type: |
debit |
| Period Type: |
instant |
|
| X |
- DefinitionAggregate par or stated value of issued nonredeemable common stock (or common stock redeemable solely at the option of the issuer). This item includes treasury stock repurchased by the entity. Note: elements for number of nonredeemable common shares, par value and other disclosure concepts are in another section within stockholders' equity. Reference 1: http://www.xbrl.org/2003/role/exampleRef
-Topic 852
-SubTopic 10
-Name Accounting Standards Codification
-Section 55
-Paragraph 10
-Publisher FASB
-URI https://asc.fasb.org//1943274/2147481372/852-10-55-10
Reference 2: http://www.xbrl.org/2003/role/disclosureRef
-Topic 944
-SubTopic 210
-Name Accounting Standards Codification
-Section S99
-Paragraph 1
-Subparagraph (SX 210.7-03(a)(22))
-Publisher FASB
-URI https://asc.fasb.org//1943274/2147479440/944-210-S99-1
Reference 3: http://fasb.org/us-gaap/role/ref/legacyRef
-Topic 210
-SubTopic 10
-Name Accounting Standards Codification
-Section S99
-Paragraph 1
-Subparagraph (SX 210.5-02(29))
-Publisher FASB
-URI https://asc.fasb.org//1943274/2147480566/210-10-S99-1
| Name: |
us-gaap_CommonStockValue |
| Namespace Prefix: |
us-gaap_ |
| Data Type: |
xbrli:monetaryItemType |
| Balance Type: |
credit |
| Period Type: |
instant |
|
| X |
- DefinitionCarrying value of amounts transferred to third parties for security purposes that are expected to be returned or applied towards payment in the future. Reference 1: http://www.xbrl.org/2009/role/commonPracticeRef
-Topic 210
-SubTopic 10
-Name Accounting Standards Codification
-Section S99
-Paragraph 1
-Subparagraph (SX 210.5-02(17))
-Publisher FASB
-URI https://asc.fasb.org//1943274/2147480566/210-10-S99-1
| Name: |
us-gaap_DepositsAssets |
| Namespace Prefix: |
us-gaap_ |
| Data Type: |
xbrli:monetaryItemType |
| Balance Type: |
debit |
| Period Type: |
instant |
|
| X |
- DefinitionCarrying value of amounts transferred to third parties for security purposes that are expected to be returned or applied towards payment within one year or during the operating cycle, if shorter. Reference 1: http://www.xbrl.org/2009/role/commonPracticeRef
-Topic 210
-SubTopic 10
-Name Accounting Standards Codification
-Section S99
-Paragraph 1
-Subparagraph (SX 210.5-02(8))
-Publisher FASB
-URI https://asc.fasb.org//1943274/2147480566/210-10-S99-1
| Name: |
us-gaap_DepositsAssetsCurrent |
| Namespace Prefix: |
us-gaap_ |
| Data Type: |
xbrli:monetaryItemType |
| Balance Type: |
debit |
| Period Type: |
instant |
|
| X |
- DefinitionPresent value of lessee's discounted obligation for lease payments from finance lease, classified as current. Reference 1: http://www.xbrl.org/2003/role/disclosureRef
-Topic 842
-SubTopic 20
-Name Accounting Standards Codification
-Section 45
-Paragraph 1
-Subparagraph (b)
-Publisher FASB
-URI https://asc.fasb.org//1943274/2147479041/842-20-45-1
| Name: |
us-gaap_FinanceLeaseLiabilityCurrent |
| Namespace Prefix: |
us-gaap_ |
| Data Type: |
xbrli:monetaryItemType |
| Balance Type: |
credit |
| Period Type: |
instant |
|
| X |
- DefinitionPresent value of lessee's discounted obligation for lease payments from finance lease, classified as noncurrent. Reference 1: http://www.xbrl.org/2003/role/disclosureRef
-Topic 842
-SubTopic 20
-Name Accounting Standards Codification
-Section 45
-Paragraph 1
-Subparagraph (b)
-Publisher FASB
-URI https://asc.fasb.org//1943274/2147479041/842-20-45-1
| Name: |
us-gaap_FinanceLeaseLiabilityNoncurrent |
| Namespace Prefix: |
us-gaap_ |
| Data Type: |
xbrli:monetaryItemType |
| Balance Type: |
credit |
| Period Type: |
instant |
|
| X |
- DefinitionAmount, after accumulated amortization, of right-of-use asset from finance lease. Reference 1: http://www.xbrl.org/2003/role/disclosureRef
-Topic 842
-SubTopic 20
-Name Accounting Standards Codification
-Section 45
-Paragraph 1
-Subparagraph (a)
-Publisher FASB
-URI https://asc.fasb.org//1943274/2147479041/842-20-45-1
| Name: |
us-gaap_FinanceLeaseRightOfUseAsset |
| Namespace Prefix: |
us-gaap_ |
| Data Type: |
xbrli:monetaryItemType |
| Balance Type: |
debit |
| Period Type: |
instant |
|
| X |
- DefinitionAmount after amortization of assets, excluding financial assets and goodwill, lacking physical substance with a finite life. Reference 1: http://www.xbrl.org/2003/role/disclosureRef
-Topic 926
-SubTopic 20
-Name Accounting Standards Codification
-Section 50
-Paragraph 5
-Publisher FASB
-URI https://asc.fasb.org//1943274/2147483154/926-20-50-5
Reference 2: http://fasb.org/us-gaap/role/ref/legacyRef
-Topic 350
-SubTopic 30
-Name Accounting Standards Codification
-Section 50
-Paragraph 2
-Subparagraph (a)(1)
-Publisher FASB
-URI https://asc.fasb.org//1943274/2147482665/350-30-50-2
| Name: |
us-gaap_FiniteLivedIntangibleAssetsNet |
| Namespace Prefix: |
us-gaap_ |
| Data Type: |
xbrli:monetaryItemType |
| Balance Type: |
debit |
| Period Type: |
instant |
|
| X |
- DefinitionSum of the carrying amounts as of the balance sheet date of all liabilities that are recognized. Liabilities are probable future sacrifices of economic benefits arising from present obligations of an entity to transfer assets or provide services to other entities in the future. Reference 1: http://www.xbrl.org/2003/role/disclosureRef
-Topic 810
-SubTopic 10
-Name Accounting Standards Codification
-Section 50
-Paragraph 3
-Subparagraph (c)
-Publisher FASB
-URI https://asc.fasb.org//1943274/2147481203/810-10-50-3
Reference 2: http://www.xbrl.org/2003/role/disclosureRef
-Topic 810
-SubTopic 10
-Name Accounting Standards Codification
-Section 45
-Paragraph 25
-Subparagraph (b)
-Publisher FASB
-URI https://asc.fasb.org//1943274/2147481231/810-10-45-25
Reference 3: http://www.xbrl.org/2003/role/disclosureRef
-Topic 810
-SubTopic 10
-Name Accounting Standards Codification
-Section 50
-Paragraph 3
-Subparagraph (bb)
-Publisher FASB
-URI https://asc.fasb.org//1943274/2147481203/810-10-50-3
Reference 4: http://www.xbrl.org/2003/role/disclosureRef
-Topic 235
-SubTopic 10
-Name Accounting Standards Codification
-Section S99
-Paragraph 1
-Subparagraph (SX 210.4-08(g)(1)(ii))
-Publisher FASB
-URI https://asc.fasb.org//1943274/2147480678/235-10-S99-1
Reference 5: http://www.xbrl.org/2003/role/disclosureRef
-Topic 323
-SubTopic 10
-Name Accounting Standards Codification
-Section 50
-Paragraph 3
-Subparagraph (c)
-Publisher FASB
-URI https://asc.fasb.org//1943274/2147481687/323-10-50-3
Reference 6: http://www.xbrl.org/2003/role/disclosureRef
-Topic 825
-SubTopic 10
-Name Accounting Standards Codification
-Section 50
-Paragraph 28
-Subparagraph (f)
-Publisher FASB
-URI https://asc.fasb.org//1943274/2147482907/825-10-50-28
Reference 7: http://www.xbrl.org/2003/role/exampleRef
-Topic 946
-SubTopic 830
-Name Accounting Standards Codification
-Section 55
-Paragraph 12
-Publisher FASB
-URI https://asc.fasb.org//1943274/2147480167/946-830-55-12
Reference 8: http://www.xbrl.org/2003/role/disclosureRef
-Topic 946
-SubTopic 210
-Name Accounting Standards Codification
-Section S99
-Paragraph 1
-Subparagraph (SX 210.6-04(14))
-Publisher FASB
-URI https://asc.fasb.org//1943274/2147479617/946-210-S99-1
Reference 9: http://www.xbrl.org/2003/role/disclosureRef
-Topic 470
-SubTopic 10
-Name Accounting Standards Codification
-Section S99
-Paragraph 1A
-Subparagraph (SX 210.13-01(a)(4)(i))
-Publisher FASB
-URI https://asc.fasb.org//1943274/2147480097/470-10-S99-1A
Reference 10: http://www.xbrl.org/2009/role/commonPracticeRef
-Topic 470
-SubTopic 10
-Name Accounting Standards Codification
-Section S99
-Paragraph 1A
-Subparagraph (SX 210.13-01(a)(4)(ii))
-Publisher FASB
-URI https://asc.fasb.org//1943274/2147480097/470-10-S99-1A
Reference 11: http://www.xbrl.org/2003/role/disclosureRef
-Topic 470
-SubTopic 10
-Name Accounting Standards Codification
-Section S99
-Paragraph 1A
-Subparagraph (SX 210.13-01(a)(4)(iii)(A))
-Publisher FASB
-URI https://asc.fasb.org//1943274/2147480097/470-10-S99-1A
Reference 12: http://www.xbrl.org/2003/role/disclosureRef
-Topic 470
-SubTopic 10
-Name Accounting Standards Codification
-Section S99
-Paragraph 1A
-Subparagraph (SX 210.13-01(a)(4)(iv))
-Publisher FASB
-URI https://asc.fasb.org//1943274/2147480097/470-10-S99-1A
Reference 13: http://www.xbrl.org/2003/role/disclosureRef
-Topic 470
-SubTopic 10
-Name Accounting Standards Codification
-Section S99
-Paragraph 1A
-Subparagraph (SX 210.13-01(a)(5))
-Publisher FASB
-URI https://asc.fasb.org//1943274/2147480097/470-10-S99-1A
Reference 14: http://www.xbrl.org/2003/role/disclosureRef
-Topic 470
-SubTopic 10
-Name Accounting Standards Codification
-Section S99
-Paragraph 1B
-Subparagraph (SX 210.13-02(a)(4)(i))
-Publisher FASB
-URI https://asc.fasb.org//1943274/2147480097/470-10-S99-1B
Reference 15: http://www.xbrl.org/2003/role/disclosureRef
-Topic 470
-SubTopic 10
-Name Accounting Standards Codification
-Section S99
-Paragraph 1B
-Subparagraph (SX 210.13-02(a)(4)(iii)(A))
-Publisher FASB
-URI https://asc.fasb.org//1943274/2147480097/470-10-S99-1B
Reference 16: http://www.xbrl.org/2003/role/disclosureRef
-Topic 470
-SubTopic 10
-Name Accounting Standards Codification
-Section S99
-Paragraph 1B
-Subparagraph (SX 210.13-02(a)(4)(iii)(B))
-Publisher FASB
-URI https://asc.fasb.org//1943274/2147480097/470-10-S99-1B
Reference 17: http://www.xbrl.org/2003/role/disclosureRef
-Topic 470
-SubTopic 10
-Name Accounting Standards Codification
-Section S99
-Paragraph 1B
-Subparagraph (SX 210.13-02(a)(4)(iv))
-Publisher FASB
-URI https://asc.fasb.org//1943274/2147480097/470-10-S99-1B
Reference 18: http://www.xbrl.org/2003/role/disclosureRef
-Topic 470
-SubTopic 10
-Name Accounting Standards Codification
-Section S99
-Paragraph 1B
-Subparagraph (SX 210.13-02(a)(5))
-Publisher FASB
-URI https://asc.fasb.org//1943274/2147480097/470-10-S99-1B
Reference 19: http://www.xbrl.org/2009/role/commonPracticeRef
-Topic 852
-SubTopic 10
-Name Accounting Standards Codification
-Section 50
-Paragraph 7
-Subparagraph (a)
-Publisher FASB
-URI https://asc.fasb.org//1943274/2147481404/852-10-50-7
Reference 20: http://www.xbrl.org/2009/role/commonPracticeRef
-Topic 852
-SubTopic 10
-Name Accounting Standards Codification
-Section 50
-Paragraph 7
-Subparagraph (b)
-Publisher FASB
-URI https://asc.fasb.org//1943274/2147481404/852-10-50-7
Reference 21: http://www.xbrl.org/2003/role/exampleRef
-Topic 280
-SubTopic 10
-Name Accounting Standards Codification
-Section 50
-Paragraph 30
-Subparagraph (d)
-Publisher FASB
-URI https://asc.fasb.org//1943274/2147482810/280-10-50-30
Reference 22: http://fasb.org/us-gaap/role/ref/legacyRef
-Name Accounting Standards Codification
-Topic 210
-SubTopic 10
-Section S99
-Paragraph 1
-Subparagraph (SX 210.5-02.19-26)
-Publisher FASB
-URI https://asc.fasb.org//1943274/2147480566/210-10-S99-1
| Name: |
us-gaap_Liabilities |
| Namespace Prefix: |
us-gaap_ |
| Data Type: |
xbrli:monetaryItemType |
| Balance Type: |
credit |
| Period Type: |
instant |
|
| X |
- DefinitionAmount of liabilities and equity items, including the portion of equity attributable to noncontrolling interests, if any. Reference 1: http://www.xbrl.org/2003/role/exampleRef
-Topic 852
-SubTopic 10
-Name Accounting Standards Codification
-Section 55
-Paragraph 10
-Publisher FASB
-URI https://asc.fasb.org//1943274/2147481372/852-10-55-10
Reference 2: http://www.xbrl.org/2003/role/disclosureRef
-Topic 944
-SubTopic 210
-Name Accounting Standards Codification
-Section S99
-Paragraph 1
-Subparagraph (SX 210.7-03(a)(25))
-Publisher FASB
-URI https://asc.fasb.org//1943274/2147479440/944-210-S99-1
Reference 3: http://www.xbrl.org/2009/role/commonPracticeRef
-Topic 235
-SubTopic 10
-Name Accounting Standards Codification
-Section S99
-Paragraph 1
-Subparagraph (SX 210.4-08(g)(1)(ii))
-Publisher FASB
-URI https://asc.fasb.org//1943274/2147480678/235-10-S99-1
Reference 4: http://www.xbrl.org/2009/role/commonPracticeRef
-Topic 323
-SubTopic 10
-Name Accounting Standards Codification
-Section 50
-Paragraph 3
-Subparagraph (c)
-Publisher FASB
-URI https://asc.fasb.org//1943274/2147481687/323-10-50-3
Reference 5: http://www.xbrl.org/2009/role/commonPracticeRef
-Topic 825
-SubTopic 10
-Name Accounting Standards Codification
-Section 50
-Paragraph 28
-Subparagraph (f)
-Publisher FASB
-URI https://asc.fasb.org//1943274/2147482907/825-10-50-28
Reference 6: http://fasb.org/us-gaap/role/ref/legacyRef
-Topic 942
-SubTopic 210
-Name Accounting Standards Codification
-Section S99
-Paragraph 1
-Subparagraph (SX 210.9-03(23))
-Publisher FASB
-URI https://asc.fasb.org//1943274/2147479853/942-210-S99-1
Reference 7: http://fasb.org/us-gaap/role/ref/legacyRef
-Topic 210
-SubTopic 10
-Name Accounting Standards Codification
-Section S99
-Paragraph 1
-Subparagraph (SX 210.5-02(32))
-Publisher FASB
-URI https://asc.fasb.org//1943274/2147480566/210-10-S99-1
| Name: |
us-gaap_LiabilitiesAndStockholdersEquity |
| Namespace Prefix: |
us-gaap_ |
| Data Type: |
xbrli:monetaryItemType |
| Balance Type: |
credit |
| Period Type: |
instant |
|
| X |
- DefinitionTotal obligations incurred as part of normal operations that are expected to be paid during the following twelve months or within one business cycle, if longer. Reference 1: http://www.xbrl.org/2003/role/disclosureRef
-Topic 810
-SubTopic 10
-Name Accounting Standards Codification
-Section 50
-Paragraph 3
-Subparagraph (c)
-Publisher FASB
-URI https://asc.fasb.org//1943274/2147481203/810-10-50-3
Reference 2: http://www.xbrl.org/2003/role/disclosureRef
-Topic 810
-SubTopic 10
-Name Accounting Standards Codification
-Section 45
-Paragraph 25
-Subparagraph (b)
-Publisher FASB
-URI https://asc.fasb.org//1943274/2147481231/810-10-45-25
Reference 3: http://www.xbrl.org/2003/role/disclosureRef
-Topic 810
-SubTopic 10
-Name Accounting Standards Codification
-Section 50
-Paragraph 3
-Subparagraph (bb)
-Publisher FASB
-URI https://asc.fasb.org//1943274/2147481203/810-10-50-3
Reference 4: http://www.xbrl.org/2003/role/disclosureRef
-Topic 235
-SubTopic 10
-Name Accounting Standards Codification
-Section S99
-Paragraph 1
-Subparagraph (SX 210.4-08(g)(1)(ii))
-Publisher FASB
-URI https://asc.fasb.org//1943274/2147480678/235-10-S99-1
Reference 5: http://www.xbrl.org/2003/role/disclosureRef
-Topic 323
-SubTopic 10
-Name Accounting Standards Codification
-Section 50
-Paragraph 3
-Subparagraph (c)
-Publisher FASB
-URI https://asc.fasb.org//1943274/2147481687/323-10-50-3
Reference 6: http://www.xbrl.org/2003/role/disclosureRef
-Topic 825
-SubTopic 10
-Name Accounting Standards Codification
-Section 50
-Paragraph 28
-Subparagraph (f)
-Publisher FASB
-URI https://asc.fasb.org//1943274/2147482907/825-10-50-28
Reference 7: http://www.xbrl.org/2003/role/exampleRef
-Topic 852
-SubTopic 10
-Name Accounting Standards Codification
-Section 55
-Paragraph 10
-Publisher FASB
-URI https://asc.fasb.org//1943274/2147481372/852-10-55-10
Reference 8: http://www.xbrl.org/2003/role/disclosureRef
-Topic 210
-SubTopic 10
-Name Accounting Standards Codification
-Section 45
-Paragraph 5
-Publisher FASB
-URI https://asc.fasb.org//1943274/2147483467/210-10-45-5
Reference 9: http://www.xbrl.org/2003/role/disclosureRef
-Topic 470
-SubTopic 10
-Name Accounting Standards Codification
-Section S99
-Paragraph 1A
-Subparagraph (SX 210.13-01(a)(4)(i))
-Publisher FASB
-URI https://asc.fasb.org//1943274/2147480097/470-10-S99-1A
Reference 10: http://www.xbrl.org/2009/role/commonPracticeRef
-Topic 470
-SubTopic 10
-Name Accounting Standards Codification
-Section S99
-Paragraph 1A
-Subparagraph (SX 210.13-01(a)(4)(ii))
-Publisher FASB
-URI https://asc.fasb.org//1943274/2147480097/470-10-S99-1A
Reference 11: http://www.xbrl.org/2003/role/disclosureRef
-Topic 470
-SubTopic 10
-Name Accounting Standards Codification
-Section S99
-Paragraph 1A
-Subparagraph (SX 210.13-01(a)(4)(iii)(A))
-Publisher FASB
-URI https://asc.fasb.org//1943274/2147480097/470-10-S99-1A
Reference 12: http://www.xbrl.org/2003/role/disclosureRef
-Topic 470
-SubTopic 10
-Name Accounting Standards Codification
-Section S99
-Paragraph 1A
-Subparagraph (SX 210.13-01(a)(4)(iv))
-Publisher FASB
-URI https://asc.fasb.org//1943274/2147480097/470-10-S99-1A
Reference 13: http://www.xbrl.org/2003/role/disclosureRef
-Topic 470
-SubTopic 10
-Name Accounting Standards Codification
-Section S99
-Paragraph 1A
-Subparagraph (SX 210.13-01(a)(5))
-Publisher FASB
-URI https://asc.fasb.org//1943274/2147480097/470-10-S99-1A
Reference 14: http://www.xbrl.org/2003/role/disclosureRef
-Topic 470
-SubTopic 10
-Name Accounting Standards Codification
-Section S99
-Paragraph 1B
-Subparagraph (SX 210.13-02(a)(4)(i))
-Publisher FASB
-URI https://asc.fasb.org//1943274/2147480097/470-10-S99-1B
Reference 15: http://www.xbrl.org/2003/role/disclosureRef
-Topic 470
-SubTopic 10
-Name Accounting Standards Codification
-Section S99
-Paragraph 1B
-Subparagraph (SX 210.13-02(a)(4)(iii)(A))
-Publisher FASB
-URI https://asc.fasb.org//1943274/2147480097/470-10-S99-1B
Reference 16: http://www.xbrl.org/2003/role/disclosureRef
-Topic 470
-SubTopic 10
-Name Accounting Standards Codification
-Section S99
-Paragraph 1B
-Subparagraph (SX 210.13-02(a)(4)(iii)(B))
-Publisher FASB
-URI https://asc.fasb.org//1943274/2147480097/470-10-S99-1B
Reference 17: http://www.xbrl.org/2003/role/disclosureRef
-Topic 470
-SubTopic 10
-Name Accounting Standards Codification
-Section S99
-Paragraph 1B
-Subparagraph (SX 210.13-02(a)(4)(iv))
-Publisher FASB
-URI https://asc.fasb.org//1943274/2147480097/470-10-S99-1B
Reference 18: http://www.xbrl.org/2003/role/disclosureRef
-Topic 470
-SubTopic 10
-Name Accounting Standards Codification
-Section S99
-Paragraph 1B
-Subparagraph (SX 210.13-02(a)(5))
-Publisher FASB
-URI https://asc.fasb.org//1943274/2147480097/470-10-S99-1B
Reference 19: http://www.xbrl.org/2009/role/commonPracticeRef
-Topic 852
-SubTopic 10
-Name Accounting Standards Codification
-Section 50
-Paragraph 7
-Subparagraph (a)
-Publisher FASB
-URI https://asc.fasb.org//1943274/2147481404/852-10-50-7
Reference 20: http://www.xbrl.org/2009/role/commonPracticeRef
-Topic 852
-SubTopic 10
-Name Accounting Standards Codification
-Section 50
-Paragraph 7
-Subparagraph (b)
-Publisher FASB
-URI https://asc.fasb.org//1943274/2147481404/852-10-50-7
Reference 21: http://fasb.org/us-gaap/role/ref/legacyRef
-Name Accounting Standards Codification
-Topic 210
-SubTopic 10
-Section S99
-Paragraph 1
-Subparagraph (SX 210.5-02.21)
-Publisher FASB
-URI https://asc.fasb.org//1943274/2147480566/210-10-S99-1
| Name: |
us-gaap_LiabilitiesCurrent |
| Namespace Prefix: |
us-gaap_ |
| Data Type: |
xbrli:monetaryItemType |
| Balance Type: |
credit |
| Period Type: |
instant |
|
| X |
- References
+ Details
| Name: |
us-gaap_LiabilitiesCurrentAbstract |
| Namespace Prefix: |
us-gaap_ |
| Data Type: |
xbrli:stringItemType |
| Balance Type: |
na |
| Period Type: |
duration |
|
| X |
- DefinitionPresent value of lessee's discounted obligation for lease payments from operating lease, classified as current. Reference 1: http://www.xbrl.org/2003/role/disclosureRef
-Topic 842
-SubTopic 20
-Name Accounting Standards Codification
-Section 45
-Paragraph 1
-Subparagraph (b)
-Publisher FASB
-URI https://asc.fasb.org//1943274/2147479041/842-20-45-1
| Name: |
us-gaap_OperatingLeaseLiabilityCurrent |
| Namespace Prefix: |
us-gaap_ |
| Data Type: |
xbrli:monetaryItemType |
| Balance Type: |
credit |
| Period Type: |
instant |
|
| X |
- DefinitionPresent value of lessee's discounted obligation for lease payments from operating lease, classified as noncurrent. Reference 1: http://www.xbrl.org/2003/role/disclosureRef
-Topic 842
-SubTopic 20
-Name Accounting Standards Codification
-Section 45
-Paragraph 1
-Subparagraph (b)
-Publisher FASB
-URI https://asc.fasb.org//1943274/2147479041/842-20-45-1
| Name: |
us-gaap_OperatingLeaseLiabilityNoncurrent |
| Namespace Prefix: |
us-gaap_ |
| Data Type: |
xbrli:monetaryItemType |
| Balance Type: |
credit |
| Period Type: |
instant |
|
| X |
- DefinitionAmount of lessee's right to use underlying asset under operating lease. Reference 1: http://www.xbrl.org/2003/role/disclosureRef
-Topic 842
-SubTopic 20
-Name Accounting Standards Codification
-Section 45
-Paragraph 1
-Subparagraph (a)
-Publisher FASB
-URI https://asc.fasb.org//1943274/2147479041/842-20-45-1
| Name: |
us-gaap_OperatingLeaseRightOfUseAsset |
| Namespace Prefix: |
us-gaap_ |
| Data Type: |
xbrli:monetaryItemType |
| Balance Type: |
debit |
| Period Type: |
instant |
|
| X |
- DefinitionAmount of liabilities classified as other, due after one year or the normal operating cycle, if longer. Reference 1: http://fasb.org/us-gaap/role/ref/legacyRef
-Name Accounting Standards Codification
-Topic 210
-SubTopic 10
-Section S99
-Paragraph 1
-Subparagraph (SX 210.5-02.24)
-Publisher FASB
-URI https://asc.fasb.org//1943274/2147480566/210-10-S99-1
| Name: |
us-gaap_OtherLiabilitiesNoncurrent |
| Namespace Prefix: |
us-gaap_ |
| Data Type: |
xbrli:monetaryItemType |
| Balance Type: |
credit |
| Period Type: |
instant |
|
| X |
- DefinitionAggregate par or stated value of issued nonredeemable preferred stock (or preferred stock redeemable solely at the option of the issuer). This item includes treasury stock repurchased by the entity. Note: elements for number of nonredeemable preferred shares, par value and other disclosure concepts are in another section within stockholders' equity. Reference 1: http://www.xbrl.org/2003/role/exampleRef
-Topic 852
-SubTopic 10
-Name Accounting Standards Codification
-Section 55
-Paragraph 10
-Publisher FASB
-URI https://asc.fasb.org//1943274/2147481372/852-10-55-10
Reference 2: http://www.xbrl.org/2003/role/disclosureRef
-Topic 944
-SubTopic 210
-Name Accounting Standards Codification
-Section S99
-Paragraph 1
-Subparagraph (SX 210.7-03(a)(21))
-Publisher FASB
-URI https://asc.fasb.org//1943274/2147479440/944-210-S99-1
Reference 3: http://fasb.org/us-gaap/role/ref/legacyRef
-Topic 210
-SubTopic 10
-Name Accounting Standards Codification
-Section S99
-Paragraph 1
-Subparagraph (SX 210.5-02(28))
-Publisher FASB
-URI https://asc.fasb.org//1943274/2147480566/210-10-S99-1
| Name: |
us-gaap_PreferredStockValue |
| Namespace Prefix: |
us-gaap_ |
| Data Type: |
xbrli:monetaryItemType |
| Balance Type: |
credit |
| Period Type: |
instant |
|
| X |
- DefinitionAmount of asset related to consideration paid in advance for costs that provide economic benefits within a future period of one year or the normal operating cycle, if longer. Reference 1: http://www.xbrl.org/2003/role/exampleRef
-Topic 210
-SubTopic 10
-Name Accounting Standards Codification
-Section 45
-Paragraph 1
-Subparagraph (g)
-Publisher FASB
-URI https://asc.fasb.org//1943274/2147483467/210-10-45-1
Reference 2: http://www.xbrl.org/2003/role/disclosureRef
-Topic 210
-SubTopic 10
-Name Accounting Standards Codification
-Section S99
-Paragraph 1
-Subparagraph (SX 210.5-02(7))
-Publisher FASB
-URI https://asc.fasb.org//1943274/2147480566/210-10-S99-1
Reference 3: http://www.xbrl.org/2003/role/disclosureRef
-Topic 340
-SubTopic 10
-Name Accounting Standards Codification
-Section 05
-Paragraph 5
-Publisher FASB
-URI https://asc.fasb.org//1943274/2147482955/340-10-05-5
Reference 4: http://www.xbrl.org/2003/role/disclosureRef
-Topic 340
-SubTopic 10
-Name Accounting Standards Codification
-Section 45
-Paragraph 1
-Publisher FASB
-URI https://asc.fasb.org//1943274/2147483032/340-10-45-1
| Name: |
us-gaap_PrepaidExpenseCurrent |
| Namespace Prefix: |
us-gaap_ |
| Data Type: |
xbrli:monetaryItemType |
| Balance Type: |
debit |
| Period Type: |
instant |
|
| X |
- DefinitionAmount after accumulated depreciation, depletion and amortization of physical assets used in the normal conduct of business to produce goods and services and not intended for resale. Examples include, but are not limited to, land, buildings, machinery and equipment, office equipment, and furniture and fixtures. Reference 1: http://fasb.org/us-gaap/role/ref/legacyRef
-Name Accounting Standards Codification
-Section 50
-Paragraph 1
-SubTopic 10
-Topic 360
-Publisher FASB
-URI https://asc.fasb.org//1943274/2147482099/360-10-50-1
Reference 2: http://www.xbrl.org/2003/role/exampleRef
-Topic 852
-SubTopic 10
-Name Accounting Standards Codification
-Section 55
-Paragraph 10
-Publisher FASB
-URI https://asc.fasb.org//1943274/2147481372/852-10-55-10
Reference 3: http://www.xbrl.org/2003/role/disclosureRef
-Topic 944
-SubTopic 210
-Name Accounting Standards Codification
-Section S99
-Paragraph 1
-Subparagraph (SX 210.7-03(a)(8))
-Publisher FASB
-URI https://asc.fasb.org//1943274/2147479440/944-210-S99-1
Reference 4: http://www.xbrl.org/2003/role/disclosureRef
-Topic 942
-SubTopic 360
-Name Accounting Standards Codification
-Section 50
-Paragraph 1
-Publisher FASB
-URI https://asc.fasb.org//1943274/2147480842/942-360-50-1
| Name: |
us-gaap_PropertyPlantAndEquipmentNet |
| Namespace Prefix: |
us-gaap_ |
| Data Type: |
xbrli:monetaryItemType |
| Balance Type: |
debit |
| Period Type: |
instant |
|
| X |
- DefinitionAmount of accumulated undistributed earnings (deficit). Reference 1: http://www.xbrl.org/2003/role/exampleRef
-Topic 852
-SubTopic 10
-Name Accounting Standards Codification
-Section 55
-Paragraph 10
-Publisher FASB
-URI https://asc.fasb.org//1943274/2147481372/852-10-55-10
Reference 2: http://www.xbrl.org/2003/role/disclosureRef
-Topic 944
-SubTopic 40
-Name Accounting Standards Codification
-Section 65
-Paragraph 2
-Subparagraph (g)(2)(i)
-Publisher FASB
-URI https://asc.fasb.org//1943274/2147480016/944-40-65-2
Reference 3: http://www.xbrl.org/2003/role/disclosureRef
-Topic 944
-SubTopic 40
-Name Accounting Standards Codification
-Section 65
-Paragraph 2
-Subparagraph (h)(2)
-Publisher FASB
-URI https://asc.fasb.org//1943274/2147480016/944-40-65-2
Reference 4: http://www.xbrl.org/2003/role/disclosureRef
-Topic 946
-SubTopic 20
-Name Accounting Standards Codification
-Section 50
-Paragraph 11
-Publisher FASB
-URI https://asc.fasb.org//1943274/2147480990/946-20-50-11
Reference 5: http://www.xbrl.org/2003/role/disclosureRef
-Topic 944
-SubTopic 210
-Name Accounting Standards Codification
-Section S99
-Paragraph 1
-Subparagraph (SX 210.7-03(a)(23)(a)(4))
-Publisher FASB
-URI https://asc.fasb.org//1943274/2147479440/944-210-S99-1
Reference 6: http://www.xbrl.org/2003/role/disclosureRef
-Topic 946
-SubTopic 210
-Name Accounting Standards Codification
-Section S99
-Paragraph 1
-Subparagraph (SX 210.6-04(17))
-Publisher FASB
-URI https://asc.fasb.org//1943274/2147479617/946-210-S99-1
Reference 7: http://fasb.org/us-gaap/role/ref/legacyRef
-Topic 505
-SubTopic 10
-Name Accounting Standards Codification
-Section S99
-Paragraph 1
-Subparagraph (SX 210.3-04)
-Publisher FASB
-URI https://asc.fasb.org//1943274/2147480008/505-10-S99-1
Reference 8: http://fasb.org/us-gaap/role/ref/legacyRef
-Topic 210
-SubTopic 10
-Name Accounting Standards Codification
-Section S99
-Paragraph 1
-Subparagraph (SX 210.5-02(30)(a)(3))
-Publisher FASB
-URI https://asc.fasb.org//1943274/2147480566/210-10-S99-1
| Name: |
us-gaap_RetainedEarningsAccumulatedDeficit |
| Namespace Prefix: |
us-gaap_ |
| Data Type: |
xbrli:monetaryItemType |
| Balance Type: |
credit |
| Period Type: |
instant |
|
| X |
- DefinitionAmount of equity (deficit) attributable to parent. Excludes temporary equity and equity attributable to noncontrolling interest. Reference 1: http://www.xbrl.org/2003/role/exampleRef
-Topic 852
-SubTopic 10
-Name Accounting Standards Codification
-Section 55
-Paragraph 10
-Publisher FASB
-URI https://asc.fasb.org//1943274/2147481372/852-10-55-10
Reference 2: http://www.xbrl.org/2003/role/exampleRef
-Topic 946
-SubTopic 830
-Name Accounting Standards Codification
-Section 55
-Paragraph 12
-Publisher FASB
-URI https://asc.fasb.org//1943274/2147480167/946-830-55-12
Reference 3: http://www.xbrl.org/2003/role/disclosureRef
-Topic 946
-SubTopic 210
-Name Accounting Standards Codification
-Section S99
-Paragraph 1
-Subparagraph (SX 210.6-04(19))
-Publisher FASB
-URI https://asc.fasb.org//1943274/2147479617/946-210-S99-1
Reference 4: http://www.xbrl.org/2003/role/disclosureRef
-Topic 946
-SubTopic 210
-Name Accounting Standards Codification
-Section S99
-Paragraph 2
-Subparagraph (SX 210.6-05(4))
-Publisher FASB
-URI https://asc.fasb.org//1943274/2147479617/946-210-S99-2
Reference 5: http://www.xbrl.org/2009/role/commonPracticeRef
-Topic 946
-SubTopic 220
-Name Accounting Standards Codification
-Section S99
-Paragraph 3
-Subparagraph (SX 210.6-09(4)(b))
-Publisher FASB
-URI https://asc.fasb.org//1943274/2147483575/946-220-S99-3
Reference 6: http://www.xbrl.org/2003/role/disclosureRef
-Topic 946
-SubTopic 220
-Name Accounting Standards Codification
-Section S99
-Paragraph 3
-Subparagraph (SX 210.6-09(6))
-Publisher FASB
-URI https://asc.fasb.org//1943274/2147483575/946-220-S99-3
Reference 7: http://www.xbrl.org/2003/role/disclosureRef
-Topic 946
-SubTopic 220
-Name Accounting Standards Codification
-Section S99
-Paragraph 3
-Subparagraph (SX 210.6-09(7))
-Publisher FASB
-URI https://asc.fasb.org//1943274/2147483575/946-220-S99-3
Reference 8: http://www.xbrl.org/2009/role/commonPracticeRef
-Topic 235
-SubTopic 10
-Name Accounting Standards Codification
-Section S99
-Paragraph 1
-Subparagraph (SX 210.4-08(g)(1)(ii))
-Publisher FASB
-URI https://asc.fasb.org//1943274/2147480678/235-10-S99-1
Reference 9: http://www.xbrl.org/2009/role/commonPracticeRef
-Topic 323
-SubTopic 10
-Name Accounting Standards Codification
-Section 50
-Paragraph 3
-Subparagraph (c)
-Publisher FASB
-URI https://asc.fasb.org//1943274/2147481687/323-10-50-3
Reference 10: http://www.xbrl.org/2009/role/commonPracticeRef
-Topic 825
-SubTopic 10
-Name Accounting Standards Codification
-Section 50
-Paragraph 28
-Subparagraph (f)
-Publisher FASB
-URI https://asc.fasb.org//1943274/2147482907/825-10-50-28
Reference 11: http://fasb.org/us-gaap/role/ref/legacyRef
-Topic 210
-SubTopic 10
-Name Accounting Standards Codification
-Section S99
-Paragraph 1
-Subparagraph (SX 210.5-02(29))
-Publisher FASB
-URI https://asc.fasb.org//1943274/2147480566/210-10-S99-1
Reference 12: http://fasb.org/us-gaap/role/ref/legacyRef
-Topic 210
-SubTopic 10
-Name Accounting Standards Codification
-Section S99
-Paragraph 1
-Subparagraph (SX 210.5-02(31))
-Publisher FASB
-URI https://asc.fasb.org//1943274/2147480566/210-10-S99-1
Reference 13: http://fasb.org/us-gaap/role/ref/legacyRef
-Topic 210
-SubTopic 10
-Name Accounting Standards Codification
-Section S99
-Paragraph 1
-Subparagraph (SX 210.5-02(30))
-Publisher FASB
-URI https://asc.fasb.org//1943274/2147480566/210-10-S99-1
Reference 14: http://fasb.org/us-gaap/role/ref/legacyRef
-Topic 310
-SubTopic 10
-Name Accounting Standards Codification
-Section S99
-Paragraph 2
-Subparagraph (SAB Topic 4.E)
-Publisher FASB
-URI https://asc.fasb.org//1943274/2147480418/310-10-S99-2
| Name: |
us-gaap_StockholdersEquity |
| Namespace Prefix: |
us-gaap_ |
| Data Type: |
xbrli:monetaryItemType |
| Balance Type: |
credit |
| Period Type: |
instant |
|
| X |
- References
+ Details
| Name: |
us-gaap_StockholdersEquityAbstract |
| Namespace Prefix: |
us-gaap_ |
| Data Type: |
xbrli:stringItemType |
| Balance Type: |
na |
| Period Type: |
duration |
|
v3.24.1.1.u2
CONDENSED BALANCE SHEETS (Parenthetical) - $ / shares
|
Mar. 31, 2024 |
Sep. 30, 2023 |
| CONDENSED BALANCE SHEETS |
|
|
| Preferred stock, par value |
$ 0.01
|
$ 0.01
|
| Preferred stock, shares authorized |
200,000
|
200,000
|
| Preferred stock, shares issued |
0
|
0
|
| Preferred stock, shares outstanding |
0
|
0
|
| Common stock, par value |
$ 0.01
|
$ 0.01
|
| Common stock, shares authorized |
600,000,000
|
600,000,000
|
| Common stock, shares issued |
54,083,718
|
47,422,304
|
| Common stock, shares outstanding |
54,083,718
|
47,422,304
|
| X |
- DefinitionFace amount or stated value per share of common stock. Reference 1: http://fasb.org/us-gaap/role/ref/legacyRef
-Topic 210
-SubTopic 10
-Name Accounting Standards Codification
-Section S99
-Paragraph 1
-Subparagraph (SX 210.5-02(29))
-Publisher FASB
-URI https://asc.fasb.org//1943274/2147480566/210-10-S99-1
| Name: |
us-gaap_CommonStockParOrStatedValuePerShare |
| Namespace Prefix: |
us-gaap_ |
| Data Type: |
dtr-types:perShareItemType |
| Balance Type: |
na |
| Period Type: |
instant |
|
| X |
- DefinitionThe maximum number of common shares permitted to be issued by an entity's charter and bylaws. Reference 1: http://www.xbrl.org/2003/role/disclosureRef
-Topic 946
-SubTopic 210
-Name Accounting Standards Codification
-Section S99
-Paragraph 1
-Subparagraph (SX 210.6-04(16)(a))
-Publisher FASB
-URI https://asc.fasb.org//1943274/2147479617/946-210-S99-1
Reference 2: http://fasb.org/us-gaap/role/ref/legacyRef
-Topic 210
-SubTopic 10
-Name Accounting Standards Codification
-Section S99
-Paragraph 1
-Subparagraph (SX 210.5-02(29))
-Publisher FASB
-URI https://asc.fasb.org//1943274/2147480566/210-10-S99-1
| Name: |
us-gaap_CommonStockSharesAuthorized |
| Namespace Prefix: |
us-gaap_ |
| Data Type: |
xbrli:sharesItemType |
| Balance Type: |
na |
| Period Type: |
instant |
|
| X |
- DefinitionTotal number of common shares of an entity that have been sold or granted to shareholders (includes common shares that were issued, repurchased and remain in the treasury). These shares represent capital invested by the firm's shareholders and owners, and may be all or only a portion of the number of shares authorized. Shares issued include shares outstanding and shares held in the treasury. Reference 1: http://fasb.org/us-gaap/role/ref/legacyRef
-Topic 210
-SubTopic 10
-Name Accounting Standards Codification
-Section S99
-Paragraph 1
-Subparagraph (SX 210.5-02(29))
-Publisher FASB
-URI https://asc.fasb.org//1943274/2147480566/210-10-S99-1
| Name: |
us-gaap_CommonStockSharesIssued |
| Namespace Prefix: |
us-gaap_ |
| Data Type: |
xbrli:sharesItemType |
| Balance Type: |
na |
| Period Type: |
instant |
|
| X |
- DefinitionNumber of shares of common stock outstanding. Common stock represent the ownership interest in a corporation. Reference 1: http://fasb.org/us-gaap/role/ref/legacyRef
-Name Accounting Standards Codification
-Section 50
-Paragraph 2
-SubTopic 10
-Topic 505
-Publisher FASB
-URI https://asc.fasb.org//1943274/2147481112/505-10-50-2
Reference 2: http://www.xbrl.org/2003/role/disclosureRef
-Topic 946
-SubTopic 210
-Name Accounting Standards Codification
-Section S99
-Paragraph 2
-Subparagraph (SX 210.6-05(4))
-Publisher FASB
-URI https://asc.fasb.org//1943274/2147479617/946-210-S99-2
Reference 3: http://www.xbrl.org/2009/role/commonPracticeRef
-Topic 946
-SubTopic 220
-Name Accounting Standards Codification
-Section S99
-Paragraph 3
-Subparagraph (SX 210.6-09(4)(b))
-Publisher FASB
-URI https://asc.fasb.org//1943274/2147483575/946-220-S99-3
Reference 4: http://www.xbrl.org/2003/role/disclosureRef
-Topic 946
-SubTopic 210
-Name Accounting Standards Codification
-Section S99
-Paragraph 1
-Subparagraph (SX 210.6-04(16)(a))
-Publisher FASB
-URI https://asc.fasb.org//1943274/2147479617/946-210-S99-1
Reference 5: http://www.xbrl.org/2009/role/commonPracticeRef
-Topic 946
-SubTopic 220
-Name Accounting Standards Codification
-Section S99
-Paragraph 3
-Subparagraph (SX 210.6-09(7))
-Publisher FASB
-URI https://asc.fasb.org//1943274/2147483575/946-220-S99-3
Reference 6: http://fasb.org/us-gaap/role/ref/legacyRef
-Topic 210
-SubTopic 10
-Name Accounting Standards Codification
-Section S99
-Paragraph 1
-Subparagraph (SX 210.5-02(29))
-Publisher FASB
-URI https://asc.fasb.org//1943274/2147480566/210-10-S99-1
| Name: |
us-gaap_CommonStockSharesOutstanding |
| Namespace Prefix: |
us-gaap_ |
| Data Type: |
xbrli:sharesItemType |
| Balance Type: |
na |
| Period Type: |
instant |
|
| X |
- DefinitionFace amount or stated value per share of preferred stock nonredeemable or redeemable solely at the option of the issuer. Reference 1: http://www.xbrl.org/2003/role/disclosureRef
-Topic 505
-SubTopic 10
-Name Accounting Standards Codification
-Section 50
-Paragraph 13
-Subparagraph (a)
-Publisher FASB
-URI https://asc.fasb.org//1943274/2147481112/505-10-50-13
Reference 2: http://fasb.org/us-gaap/role/ref/legacyRef
-Topic 210
-SubTopic 10
-Name Accounting Standards Codification
-Section S99
-Paragraph 1
-Subparagraph (SX 210.5-02(28))
-Publisher FASB
-URI https://asc.fasb.org//1943274/2147480566/210-10-S99-1
| Name: |
us-gaap_PreferredStockParOrStatedValuePerShare |
| Namespace Prefix: |
us-gaap_ |
| Data Type: |
dtr-types:perShareItemType |
| Balance Type: |
na |
| Period Type: |
instant |
|
| X |
- DefinitionThe maximum number of nonredeemable preferred shares (or preferred stock redeemable solely at the option of the issuer) permitted to be issued by an entity's charter and bylaws. Reference 1: http://www.xbrl.org/2003/role/disclosureRef
-Topic 946
-SubTopic 210
-Name Accounting Standards Codification
-Section S99
-Paragraph 1
-Subparagraph (SX 210.6-04(16)(a))
-Publisher FASB
-URI https://asc.fasb.org//1943274/2147479617/946-210-S99-1
Reference 2: http://fasb.org/us-gaap/role/ref/legacyRef
-Topic 210
-SubTopic 10
-Name Accounting Standards Codification
-Section S99
-Paragraph 1
-Subparagraph (SX 210.5-02(28))
-Publisher FASB
-URI https://asc.fasb.org//1943274/2147480566/210-10-S99-1
| Name: |
us-gaap_PreferredStockSharesAuthorized |
| Namespace Prefix: |
us-gaap_ |
| Data Type: |
xbrli:sharesItemType |
| Balance Type: |
na |
| Period Type: |
instant |
|
| X |
- DefinitionTotal number of nonredeemable preferred shares (or preferred stock redeemable solely at the option of the issuer) issued to shareholders (includes related preferred shares that were issued, repurchased, and remain in the treasury). May be all or portion of the number of preferred shares authorized. Excludes preferred shares that are classified as debt. Reference 1: http://www.xbrl.org/2003/role/disclosureRef
-Topic 505
-SubTopic 10
-Name Accounting Standards Codification
-Section 50
-Paragraph 13
-Subparagraph (a)
-Publisher FASB
-URI https://asc.fasb.org//1943274/2147481112/505-10-50-13
Reference 2: http://fasb.org/us-gaap/role/ref/legacyRef
-Topic 210
-SubTopic 10
-Name Accounting Standards Codification
-Section S99
-Paragraph 1
-Subparagraph (SX 210.5-02(28))
-Publisher FASB
-URI https://asc.fasb.org//1943274/2147480566/210-10-S99-1
| Name: |
us-gaap_PreferredStockSharesIssued |
| Namespace Prefix: |
us-gaap_ |
| Data Type: |
xbrli:sharesItemType |
| Balance Type: |
na |
| Period Type: |
instant |
|
| X |
- DefinitionAggregate share number for all nonredeemable preferred stock (or preferred stock redeemable solely at the option of the issuer) held by stockholders. Does not include preferred shares that have been repurchased. Reference 1: http://www.xbrl.org/2003/role/disclosureRef
-Topic 946
-SubTopic 210
-Name Accounting Standards Codification
-Section S99
-Paragraph 2
-Subparagraph (SX 210.6-05(4))
-Publisher FASB
-URI https://asc.fasb.org//1943274/2147479617/946-210-S99-2
Reference 2: http://www.xbrl.org/2009/role/commonPracticeRef
-Topic 946
-SubTopic 220
-Name Accounting Standards Codification
-Section S99
-Paragraph 3
-Subparagraph (SX 210.6-09(4)(b))
-Publisher FASB
-URI https://asc.fasb.org//1943274/2147483575/946-220-S99-3
Reference 3: http://www.xbrl.org/2003/role/disclosureRef
-Topic 946
-SubTopic 210
-Name Accounting Standards Codification
-Section S99
-Paragraph 1
-Subparagraph (SX 210.6-04(16)(a))
-Publisher FASB
-URI https://asc.fasb.org//1943274/2147479617/946-210-S99-1
Reference 4: http://www.xbrl.org/2009/role/commonPracticeRef
-Topic 946
-SubTopic 220
-Name Accounting Standards Codification
-Section S99
-Paragraph 3
-Subparagraph (SX 210.6-09(7))
-Publisher FASB
-URI https://asc.fasb.org//1943274/2147483575/946-220-S99-3
Reference 5: http://fasb.org/us-gaap/role/ref/legacyRef
-Topic 210
-SubTopic 10
-Name Accounting Standards Codification
-Section S99
-Paragraph 1
-Subparagraph (SX 210.5-02(28))
-Publisher FASB
-URI https://asc.fasb.org//1943274/2147480566/210-10-S99-1
| Name: |
us-gaap_PreferredStockSharesOutstanding |
| Namespace Prefix: |
us-gaap_ |
| Data Type: |
xbrli:sharesItemType |
| Balance Type: |
na |
| Period Type: |
instant |
|
| X |
- References
+ Details
| Name: |
us-gaap_StatementOfFinancialPositionAbstract |
| Namespace Prefix: |
us-gaap_ |
| Data Type: |
xbrli:stringItemType |
| Balance Type: |
na |
| Period Type: |
duration |
|
v3.24.1.1.u2
CONDENSED STATEMENTS OF OPERATIONS (UNAUDITED) - USD ($)
|
3 Months Ended |
6 Months Ended |
Mar. 31, 2024 |
Mar. 31, 2023 |
Mar. 31, 2024 |
Mar. 31, 2023 |
| CONDENSED STATEMENTS OF OPERATIONS (UNAUDITED) |
|
|
|
|
| Research and development |
$ 4,628,535
|
$ 6,083,488
|
$ 8,981,044
|
$ 11,476,034
|
| General and administrative |
2,447,413
|
2,092,758
|
4,580,791
|
4,350,761
|
| Total operating expenses |
7,075,948
|
8,176,246
|
13,561,835
|
15,826,795
|
| Operating loss |
(7,075,948)
|
(8,176,246)
|
(13,561,835)
|
(15,826,795)
|
| Interest expense, net |
(182,701)
|
(159,063)
|
(380,397)
|
(311,852)
|
| Other expense |
(13,758)
|
(7,500)
|
(12,183)
|
(57,671)
|
| Net loss |
(7,244,891)
|
(8,342,809)
|
(13,954,415)
|
(16,196,318)
|
| Modification of warrants |
|
|
0
|
(171,552)
|
| Net loss available to common shareholders |
$ (7,244,891)
|
$ (8,342,809)
|
$ (13,954,415)
|
$ (16,367,870)
|
| Net loss per common share - basic and diluted |
$ (0.14)
|
$ (0.19)
|
$ (0.28)
|
$ (0.38)
|
| Weighted average common shares outstanding - basic and diluted |
52,006,442
|
43,588,381
|
50,228,860
|
43,513,571
|
| X |
- References
+ Details
| Name: |
cvm_EarningPerShareBasicAndDiluted |
| Namespace Prefix: |
cvm_ |
| Data Type: |
num:perShareItemType |
| Balance Type: |
na |
| Period Type: |
duration |
|
| X |
- References
+ Details
| Name: |
cvm_ModificationOfWarrants |
| Namespace Prefix: |
cvm_ |
| Data Type: |
xbrli:monetaryItemType |
| Balance Type: |
credit |
| Period Type: |
duration |
|
| X |
- References
+ Details
| Name: |
cvm_WeightedAverageNumberOfCommonSharesOutstandingBasicAndDiluted |
| Namespace Prefix: |
cvm_ |
| Data Type: |
xbrli:sharesItemType |
| Balance Type: |
na |
| Period Type: |
duration |
|
| X |
- DefinitionThe aggregate total of expenses of managing and administering the affairs of an entity, including affiliates of the reporting entity, which are not directly or indirectly associated with the manufacture, sale or creation of a product or product line. Reference 1: http://www.xbrl.org/2003/role/disclosureRef
-Topic 946
-SubTopic 220
-Name Accounting Standards Codification
-Section S99
-Paragraph 1
-Subparagraph (SX 210.6-07(2)(a))
-Publisher FASB
-URI https://asc.fasb.org//1943274/2147483575/946-220-S99-1
Reference 2: http://fasb.org/us-gaap/role/ref/legacyRef
-Topic 220
-SubTopic 10
-Name Accounting Standards Codification
-Section S99
-Paragraph 2
-Subparagraph (SX 210.5-03.4)
-Publisher FASB
-URI https://asc.fasb.org//1943274/2147483621/220-10-S99-2
| Name: |
us-gaap_GeneralAndAdministrativeExpense |
| Namespace Prefix: |
us-gaap_ |
| Data Type: |
xbrli:monetaryItemType |
| Balance Type: |
debit |
| Period Type: |
duration |
|
| X |
- References
+ Details
| Name: |
us-gaap_IncomeStatementAbstract |
| Namespace Prefix: |
us-gaap_ |
| Data Type: |
xbrli:stringItemType |
| Balance Type: |
na |
| Period Type: |
duration |
|
| X |
- DefinitionThe net amount of operating interest income (expense). Reference 1: http://fasb.org/us-gaap/role/ref/legacyRef
-Topic 942
-SubTopic 220
-Name Accounting Standards Codification
-Section S99
-Paragraph 1
-Subparagraph (SX 210.9-04.10)
-Publisher FASB
-URI https://asc.fasb.org//1943274/2147483589/942-220-S99-1
| Name: |
us-gaap_InterestIncomeExpenseNet |
| Namespace Prefix: |
us-gaap_ |
| Data Type: |
xbrli:monetaryItemType |
| Balance Type: |
credit |
| Period Type: |
duration |
|
| X |
- DefinitionThe portion of profit or loss for the period, net of income taxes, which is attributable to the parent. Reference 1: http://www.xbrl.org/2003/role/disclosureRef
-Topic 235
-SubTopic 10
-Name Accounting Standards Codification
-Section S99
-Paragraph 1
-Subparagraph (SX 210.4-08(g)(1)(ii))
-Publisher FASB
-URI https://asc.fasb.org//1943274/2147480678/235-10-S99-1
Reference 2: http://www.xbrl.org/2003/role/disclosureRef
-Topic 323
-SubTopic 10
-Name Accounting Standards Codification
-Section 50
-Paragraph 3
-Subparagraph (c)
-Publisher FASB
-URI https://asc.fasb.org//1943274/2147481687/323-10-50-3
Reference 3: http://www.xbrl.org/2003/role/disclosureRef
-Topic 825
-SubTopic 10
-Name Accounting Standards Codification
-Section 50
-Paragraph 28
-Subparagraph (f)
-Publisher FASB
-URI https://asc.fasb.org//1943274/2147482907/825-10-50-28
Reference 4: http://www.xbrl.org/2003/role/disclosureRef
-Topic 220
-SubTopic 10
-Name Accounting Standards Codification
-Section 50
-Paragraph 6
-Publisher FASB
-URI https://asc.fasb.org//1943274/2147482765/220-10-50-6
Reference 5: http://www.xbrl.org/2003/role/disclosureRef
-Topic 250
-SubTopic 10
-Name Accounting Standards Codification
-Section 50
-Paragraph 3
-Publisher FASB
-URI https://asc.fasb.org//1943274/2147483443/250-10-50-3
Reference 6: http://www.xbrl.org/2003/role/disclosureRef
-Topic 250
-SubTopic 10
-Name Accounting Standards Codification
-Section 50
-Paragraph 1
-Subparagraph (b)(2)
-Publisher FASB
-URI https://asc.fasb.org//1943274/2147483443/250-10-50-1
Reference 7: http://www.xbrl.org/2003/role/disclosureRef
-Topic 815
-SubTopic 40
-Name Accounting Standards Codification
-Section 65
-Paragraph 1
-Subparagraph (f)
-Publisher FASB
-URI https://asc.fasb.org//1943274/2147480175/815-40-65-1
Reference 8: http://www.xbrl.org/2003/role/disclosureRef
-Topic 250
-SubTopic 10
-Name Accounting Standards Codification
-Section 50
-Paragraph 8
-Publisher FASB
-URI https://asc.fasb.org//1943274/2147483443/250-10-50-8
Reference 9: http://www.xbrl.org/2003/role/disclosureRef
-Topic 250
-SubTopic 10
-Name Accounting Standards Codification
-Section 50
-Paragraph 9
-Publisher FASB
-URI https://asc.fasb.org//1943274/2147483443/250-10-50-9
Reference 10: http://www.xbrl.org/2003/role/disclosureRef
-Topic 250
-SubTopic 10
-Name Accounting Standards Codification
-Section 50
-Paragraph 11
-Subparagraph (a)
-Publisher FASB
-URI https://asc.fasb.org//1943274/2147483443/250-10-50-11
Reference 11: http://www.xbrl.org/2003/role/disclosureRef
-Topic 250
-SubTopic 10
-Name Accounting Standards Codification
-Section 50
-Paragraph 11
-Subparagraph (b)
-Publisher FASB
-URI https://asc.fasb.org//1943274/2147483443/250-10-50-11
Reference 12: http://www.xbrl.org/2003/role/disclosureRef
-Topic 250
-SubTopic 10
-Name Accounting Standards Codification
-Section 50
-Paragraph 4
-Publisher FASB
-URI https://asc.fasb.org//1943274/2147483443/250-10-50-4
Reference 13: http://www.xbrl.org/2003/role/exampleRef
-Topic 946
-SubTopic 830
-Name Accounting Standards Codification
-Section 55
-Paragraph 10
-Publisher FASB
-URI https://asc.fasb.org//1943274/2147480167/946-830-55-10
Reference 14: http://www.xbrl.org/2003/role/disclosureRef
-Topic 946
-SubTopic 220
-Name Accounting Standards Codification
-Section 45
-Paragraph 7
-Publisher FASB
-URI https://asc.fasb.org//1943274/2147483581/946-220-45-7
Reference 15: http://www.xbrl.org/2003/role/disclosureRef
-Topic 944
-SubTopic 220
-Name Accounting Standards Codification
-Section S99
-Paragraph 1
-Subparagraph (SX 210.7-04(18))
-Publisher FASB
-URI https://asc.fasb.org//1943274/2147483586/944-220-S99-1
Reference 16: http://www.xbrl.org/2003/role/disclosureRef
-Topic 280
-SubTopic 10
-Name Accounting Standards Codification
-Section 50
-Paragraph 22
-Publisher FASB
-URI https://asc.fasb.org//1943274/2147482810/280-10-50-22
Reference 17: http://www.xbrl.org/2003/role/disclosureRef
-Topic 946
-SubTopic 220
-Name Accounting Standards Codification
-Section S99
-Paragraph 1
-Subparagraph (SX 210.6-07(9))
-Publisher FASB
-URI https://asc.fasb.org//1943274/2147483575/946-220-S99-1
Reference 18: http://www.xbrl.org/2003/role/disclosureRef
-Topic 946
-SubTopic 220
-Name Accounting Standards Codification
-Section S99
-Paragraph 3
-Subparagraph (SX 210.6-09(1)(d))
-Publisher FASB
-URI https://asc.fasb.org//1943274/2147483575/946-220-S99-3
Reference 19: http://www.xbrl.org/2003/role/disclosureRef
-Topic 470
-SubTopic 10
-Name Accounting Standards Codification
-Section S99
-Paragraph 1A
-Subparagraph (SX 210.13-01(a)(4)(i))
-Publisher FASB
-URI https://asc.fasb.org//1943274/2147480097/470-10-S99-1A
Reference 20: http://www.xbrl.org/2009/role/commonPracticeRef
-Topic 470
-SubTopic 10
-Name Accounting Standards Codification
-Section S99
-Paragraph 1A
-Subparagraph (SX 210.13-01(a)(4)(ii))
-Publisher FASB
-URI https://asc.fasb.org//1943274/2147480097/470-10-S99-1A
Reference 21: http://www.xbrl.org/2003/role/disclosureRef
-Topic 470
-SubTopic 10
-Name Accounting Standards Codification
-Section S99
-Paragraph 1A
-Subparagraph (SX 210.13-01(a)(4)(iii)(A))
-Publisher FASB
-URI https://asc.fasb.org//1943274/2147480097/470-10-S99-1A
Reference 22: http://www.xbrl.org/2003/role/disclosureRef
-Topic 470
-SubTopic 10
-Name Accounting Standards Codification
-Section S99
-Paragraph 1A
-Subparagraph (SX 210.13-01(a)(4)(iv))
-Publisher FASB
-URI https://asc.fasb.org//1943274/2147480097/470-10-S99-1A
Reference 23: http://www.xbrl.org/2003/role/disclosureRef
-Topic 470
-SubTopic 10
-Name Accounting Standards Codification
-Section S99
-Paragraph 1A
-Subparagraph (SX 210.13-01(a)(5))
-Publisher FASB
-URI https://asc.fasb.org//1943274/2147480097/470-10-S99-1A
Reference 24: http://www.xbrl.org/2003/role/disclosureRef
-Topic 470
-SubTopic 10
-Name Accounting Standards Codification
-Section S99
-Paragraph 1B
-Subparagraph (SX 210.13-02(a)(4)(i))
-Publisher FASB
-URI https://asc.fasb.org//1943274/2147480097/470-10-S99-1B
Reference 25: http://www.xbrl.org/2003/role/disclosureRef
-Topic 470
-SubTopic 10
-Name Accounting Standards Codification
-Section S99
-Paragraph 1B
-Subparagraph (SX 210.13-02(a)(4)(iii)(A))
-Publisher FASB
-URI https://asc.fasb.org//1943274/2147480097/470-10-S99-1B
Reference 26: http://www.xbrl.org/2003/role/disclosureRef
-Topic 470
-SubTopic 10
-Name Accounting Standards Codification
-Section S99
-Paragraph 1B
-Subparagraph (SX 210.13-02(a)(4)(iii)(B))
-Publisher FASB
-URI https://asc.fasb.org//1943274/2147480097/470-10-S99-1B
Reference 27: http://www.xbrl.org/2003/role/disclosureRef
-Topic 470
-SubTopic 10
-Name Accounting Standards Codification
-Section S99
-Paragraph 1B
-Subparagraph (SX 210.13-02(a)(4)(iv))
-Publisher FASB
-URI https://asc.fasb.org//1943274/2147480097/470-10-S99-1B
Reference 28: http://www.xbrl.org/2003/role/disclosureRef
-Topic 470
-SubTopic 10
-Name Accounting Standards Codification
-Section S99
-Paragraph 1B
-Subparagraph (SX 210.13-02(a)(5))
-Publisher FASB
-URI https://asc.fasb.org//1943274/2147480097/470-10-S99-1B
Reference 29: http://www.xbrl.org/2003/role/disclosureRef
-Topic 280
-SubTopic 10
-Name Accounting Standards Codification
-Section 50
-Paragraph 30
-Subparagraph (b)
-Publisher FASB
-URI https://asc.fasb.org//1943274/2147482810/280-10-50-30
Reference 30: http://www.xbrl.org/2003/role/disclosureRef
-Topic 280
-SubTopic 10
-Name Accounting Standards Codification
-Section 50
-Paragraph 32
-Subparagraph (f)
-Publisher FASB
-URI https://asc.fasb.org//1943274/2147482810/280-10-50-32
Reference 31: http://www.xbrl.org/2003/role/disclosureRef
-Topic 260
-SubTopic 10
-Name Accounting Standards Codification
-Section 45
-Paragraph 60B
-Subparagraph (a)
-Publisher FASB
-URI https://asc.fasb.org//1943274/2147482689/260-10-45-60B
Reference 32: http://www.xbrl.org/2003/role/exampleRef
-Topic 280
-SubTopic 10
-Name Accounting Standards Codification
-Section 50
-Paragraph 31
-Publisher FASB
-URI https://asc.fasb.org//1943274/2147482810/280-10-50-31
Reference 33: http://www.xbrl.org/2003/role/disclosureRef
-Topic 280
-SubTopic 10
-Name Accounting Standards Codification
-Section 50
-Paragraph 32
-Subparagraph (c)
-Publisher FASB
-URI https://asc.fasb.org//1943274/2147482810/280-10-50-32
Reference 34: http://www.xbrl.org/2003/role/disclosureRef
-Topic 205
-SubTopic 20
-Name Accounting Standards Codification
-Section 50
-Paragraph 7
-Publisher FASB
-URI https://asc.fasb.org//1943274/2147483499/205-20-50-7
Reference 35: http://fasb.org/us-gaap/role/ref/legacyRef
-Topic 230
-SubTopic 10
-Name Accounting Standards Codification
-Section 45
-Paragraph 28
-Publisher FASB
-URI https://asc.fasb.org//1943274/2147482740/230-10-45-28
Reference 36: http://www.xbrl.org/2003/role/disclosureRef
-Topic 220
-SubTopic 10
-Name Accounting Standards Codification
-Section 45
-Paragraph 1A
-Subparagraph (a)
-Publisher FASB
-URI https://asc.fasb.org//1943274/2147482790/220-10-45-1A
Reference 37: http://www.xbrl.org/2003/role/disclosureRef
-Topic 220
-SubTopic 10
-Name Accounting Standards Codification
-Section 45
-Paragraph 1B
-Subparagraph (a)
-Publisher FASB
-URI https://asc.fasb.org//1943274/2147482790/220-10-45-1B
Reference 38: http://fasb.org/us-gaap/role/ref/legacyRef
-Topic 220
-SubTopic 10
-Name Accounting Standards Codification
-Section S99
-Paragraph 2
-Subparagraph (SX 210.5-03(20))
-Publisher FASB
-URI https://asc.fasb.org//1943274/2147483621/220-10-S99-2
Reference 39: http://fasb.org/us-gaap/role/ref/legacyRef
-Topic 942
-SubTopic 220
-Name Accounting Standards Codification
-Section S99
-Paragraph 1
-Subparagraph (SX 210.9-04(22))
-Publisher FASB
-URI https://asc.fasb.org//1943274/2147483589/942-220-S99-1
| Name: |
us-gaap_NetIncomeLoss |
| Namespace Prefix: |
us-gaap_ |
| Data Type: |
xbrli:monetaryItemType |
| Balance Type: |
credit |
| Period Type: |
duration |
|
| X |
- DefinitionAmount, after deduction of tax, noncontrolling interests, dividends on preferred stock and participating securities; of income (loss) available to common shareholders. Reference 1: http://www.xbrl.org/2003/role/disclosureRef
-Topic 250
-SubTopic 10
-Name Accounting Standards Codification
-Section 50
-Paragraph 3
-Publisher FASB
-URI https://asc.fasb.org//1943274/2147483443/250-10-50-3
Reference 2: http://www.xbrl.org/2003/role/disclosureRef
-Topic 250
-SubTopic 10
-Name Accounting Standards Codification
-Section 50
-Paragraph 11
-Subparagraph (a)
-Publisher FASB
-URI https://asc.fasb.org//1943274/2147483443/250-10-50-11
Reference 3: http://www.xbrl.org/2003/role/disclosureRef
-Topic 250
-SubTopic 10
-Name Accounting Standards Codification
-Section 50
-Paragraph 11
-Subparagraph (b)
-Publisher FASB
-URI https://asc.fasb.org//1943274/2147483443/250-10-50-11
Reference 4: http://www.xbrl.org/2003/role/disclosureRef
-Topic 250
-SubTopic 10
-Name Accounting Standards Codification
-Section 50
-Paragraph 4
-Publisher FASB
-URI https://asc.fasb.org//1943274/2147483443/250-10-50-4
Reference 5: http://www.xbrl.org/2003/role/disclosureRef
-Topic 220
-SubTopic 10
-Name Accounting Standards Codification
-Section S99
-Paragraph 5
-Subparagraph (SAB Topic 6.B)
-Publisher FASB
-URI https://asc.fasb.org//1943274/2147483621/220-10-S99-5
Reference 6: http://www.xbrl.org/2003/role/disclosureRef
-Topic 280
-SubTopic 10
-Name Accounting Standards Codification
-Section 50
-Paragraph 22
-Publisher FASB
-URI https://asc.fasb.org//1943274/2147482810/280-10-50-22
Reference 7: http://www.xbrl.org/2003/role/disclosureRef
-Topic 260
-SubTopic 10
-Name Accounting Standards Codification
-Section 50
-Paragraph 1
-Subparagraph (a)
-Publisher FASB
-URI https://asc.fasb.org//1943274/2147482662/260-10-50-1
Reference 8: http://www.xbrl.org/2003/role/disclosureRef
-Topic 280
-SubTopic 10
-Name Accounting Standards Codification
-Section 50
-Paragraph 30
-Subparagraph (b)
-Publisher FASB
-URI https://asc.fasb.org//1943274/2147482810/280-10-50-30
Reference 9: http://www.xbrl.org/2003/role/disclosureRef
-Topic 280
-SubTopic 10
-Name Accounting Standards Codification
-Section 50
-Paragraph 32
-Subparagraph (f)
-Publisher FASB
-URI https://asc.fasb.org//1943274/2147482810/280-10-50-32
Reference 10: http://www.xbrl.org/2003/role/disclosureRef
-Topic 260
-SubTopic 10
-Name Accounting Standards Codification
-Section 45
-Paragraph 10
-Publisher FASB
-URI https://asc.fasb.org//1943274/2147482689/260-10-45-10
Reference 11: http://www.xbrl.org/2003/role/exampleRef
-Topic 280
-SubTopic 10
-Name Accounting Standards Codification
-Section 50
-Paragraph 31
-Publisher FASB
-URI https://asc.fasb.org//1943274/2147482810/280-10-50-31
Reference 12: http://www.xbrl.org/2003/role/disclosureRef
-Topic 280
-SubTopic 10
-Name Accounting Standards Codification
-Section 50
-Paragraph 32
-Subparagraph (c)
-Publisher FASB
-URI https://asc.fasb.org//1943274/2147482810/280-10-50-32
Reference 13: http://www.xbrl.org/2003/role/disclosureRef
-Topic 260
-SubTopic 10
-Name Accounting Standards Codification
-Section 45
-Paragraph 11
-Publisher FASB
-URI https://asc.fasb.org//1943274/2147482689/260-10-45-11
Reference 14: http://www.xbrl.org/2003/role/disclosureRef
-Topic 260
-SubTopic 10
-Name Accounting Standards Codification
-Section 45
-Paragraph 60B
-Subparagraph (c)
-Publisher FASB
-URI https://asc.fasb.org//1943274/2147482689/260-10-45-60B
| Name: |
us-gaap_NetIncomeLossAvailableToCommonStockholdersBasic |
| Namespace Prefix: |
us-gaap_ |
| Data Type: |
xbrli:monetaryItemType |
| Balance Type: |
credit |
| Period Type: |
duration |
|
| X |
- DefinitionGenerally recurring costs associated with normal operations except for the portion of these expenses which can be clearly related to production and included in cost of sales or services. Includes selling, general and administrative expense.
| Name: |
us-gaap_OperatingExpenses |
| Namespace Prefix: |
us-gaap_ |
| Data Type: |
xbrli:monetaryItemType |
| Balance Type: |
debit |
| Period Type: |
duration |
|
| X |
- DefinitionThe net result for the period of deducting operating expenses from operating revenues. Reference 1: http://www.xbrl.org/2003/role/disclosureRef
-Topic 280
-SubTopic 10
-Name Accounting Standards Codification
-Section 50
-Paragraph 22
-Publisher FASB
-URI https://asc.fasb.org//1943274/2147482810/280-10-50-22
Reference 2: http://www.xbrl.org/2003/role/disclosureRef
-Topic 280
-SubTopic 10
-Name Accounting Standards Codification
-Section 50
-Paragraph 30
-Subparagraph (b)
-Publisher FASB
-URI https://asc.fasb.org//1943274/2147482810/280-10-50-30
Reference 3: http://www.xbrl.org/2003/role/disclosureRef
-Topic 280
-SubTopic 10
-Name Accounting Standards Codification
-Section 50
-Paragraph 32
-Subparagraph (f)
-Publisher FASB
-URI https://asc.fasb.org//1943274/2147482810/280-10-50-32
Reference 4: http://www.xbrl.org/2003/role/exampleRef
-Topic 280
-SubTopic 10
-Name Accounting Standards Codification
-Section 50
-Paragraph 31
-Publisher FASB
-URI https://asc.fasb.org//1943274/2147482810/280-10-50-31
Reference 5: http://www.xbrl.org/2003/role/disclosureRef
-Topic 280
-SubTopic 10
-Name Accounting Standards Codification
-Section 50
-Paragraph 32
-Subparagraph (c)
-Publisher FASB
-URI https://asc.fasb.org//1943274/2147482810/280-10-50-32
| Name: |
us-gaap_OperatingIncomeLoss |
| Namespace Prefix: |
us-gaap_ |
| Data Type: |
xbrli:monetaryItemType |
| Balance Type: |
credit |
| Period Type: |
duration |
|
| X |
- DefinitionAmount of expense related to nonoperating activities, classified as other. Reference 1: http://fasb.org/us-gaap/role/ref/legacyRef
-Topic 220
-SubTopic 10
-Name Accounting Standards Codification
-Section S99
-Paragraph 2
-Subparagraph (SX 210.5-03.9)
-Publisher FASB
-URI https://asc.fasb.org//1943274/2147483621/220-10-S99-2
| Name: |
us-gaap_OtherNonoperatingExpense |
| Namespace Prefix: |
us-gaap_ |
| Data Type: |
xbrli:monetaryItemType |
| Balance Type: |
debit |
| Period Type: |
duration |
|
| X |
- DefinitionThe aggregate costs incurred (1) in a planned search or critical investigation aimed at discovery of new knowledge with the hope that such knowledge will be useful in developing a new product or service, a new process or technique, or in bringing about a significant improvement to an existing product or process; or (2) to translate research findings or other knowledge into a plan or design for a new product or process or for a significant improvement to an existing product or process whether intended for sale or the entity's use, during the reporting period charged to research and development projects, including the costs of developing computer software up to the point in time of achieving technological feasibility, and costs allocated in accounting for a business combination to in-process projects deemed to have no alternative future use. Reference 1: http://www.xbrl.org/2003/role/disclosureRef
-Topic 730
-SubTopic 10
-Name Accounting Standards Codification
-Section 50
-Paragraph 1
-Publisher FASB
-URI https://asc.fasb.org//1943274/2147482916/730-10-50-1
Reference 2: http://www.xbrl.org/2009/role/commonPracticeRef
-Topic 912
-SubTopic 730
-Name Accounting Standards Codification
-Section 25
-Paragraph 1
-Publisher FASB
-URI https://asc.fasb.org//1943274/2147482517/912-730-25-1
Reference 3: http://fasb.org/us-gaap/role/ref/legacyRef
-Name Accounting Standards Codification
-Topic 985
-SubTopic 20
-Section 50
-Paragraph 1
-Publisher FASB
-URI https://asc.fasb.org//1943274/2147481283/985-20-50-1
| Name: |
us-gaap_ResearchAndDevelopmentExpense |
| Namespace Prefix: |
us-gaap_ |
| Data Type: |
xbrli:monetaryItemType |
| Balance Type: |
debit |
| Period Type: |
duration |
|
v3.24.1.1.u2
STATEMENTS OF STOCKHOLDERS EQUITY (UNAUDITED) - USD ($)
|
Total |
Common Stock |
Additional Paid-In Capital |
Retained Earnings (Accumulated Deficit) |
| Balance, shares at Sep. 30, 2022 |
|
43,448,317
|
|
|
| Balance, amount at Sep. 30, 2022 |
$ 32,163,207
|
$ 434,484
|
$ 486,625,816
|
$ (454,897,093)
|
| Warrant exercises, shares |
|
217,752
|
|
|
| Warrant exercises, amount |
447,291
|
$ 2,177
|
445,114
|
0
|
| Equity based compensation - employees |
1,703,931
|
$ 0
|
1,703,931
|
0
|
| 401(k) contributions paid in common stock, shares |
|
21,331
|
|
|
| 401(k) contributions paid in common stock, amount |
50,178
|
$ 213
|
49,965
|
0
|
| Stock issued to nonemployees for service, shares |
|
40,236
|
|
|
| Stock issued to nonemployees for service, amount |
91,623
|
$ 402
|
91,221
|
0
|
| 2014 incentive stock forfeited, shares |
|
(2,000)
|
|
|
| 2014 incentive stock forfeited, amount |
(11,100)
|
$ (20)
|
(11,080)
|
0
|
| Net loss |
(7,853,509)
|
$ 0
|
0
|
(7,853,509)
|
| Balance, shares at Dec. 31, 2022 |
|
43,725,636
|
|
|
| Balance, amount at Dec. 31, 2022 |
26,591,621
|
$ 437,256
|
488,904,967
|
(462,750,602)
|
| Balance, shares at Sep. 30, 2022 |
|
43,448,317
|
|
|
| Balance, amount at Sep. 30, 2022 |
32,163,207
|
$ 434,484
|
486,625,816
|
(454,897,093)
|
| Net loss |
(16,196,318)
|
|
|
|
| Balance, shares at Mar. 31, 2023 |
|
43,787,825
|
|
|
| Balance, amount at Mar. 31, 2023 |
20,147,600
|
$ 437,878
|
490,803,133
|
(471,093,411)
|
| Balance, shares at Dec. 31, 2022 |
|
43,725,636
|
|
|
| Balance, amount at Dec. 31, 2022 |
26,591,621
|
$ 437,256
|
488,904,967
|
(462,750,602)
|
| Equity based compensation - employees |
1,743,288
|
$ 0
|
1,743,288
|
0
|
| 401(k) contributions paid in common stock, shares |
|
23,627
|
|
|
| 401(k) contributions paid in common stock, amount |
54,865
|
$ 236
|
54,629
|
0
|
| Stock issued to nonemployees for service, shares |
|
38,562
|
|
|
| Stock issued to nonemployees for service, amount |
100,635
|
$ 386
|
100,249
|
0
|
| Net loss |
(8,342,809)
|
$ 0
|
0
|
(8,342,809)
|
| Balance, shares at Mar. 31, 2023 |
|
43,787,825
|
|
|
| Balance, amount at Mar. 31, 2023 |
20,147,600
|
$ 437,878
|
490,803,133
|
(471,093,411)
|
| Balance, shares at Sep. 30, 2023 |
|
47,422,304
|
|
|
| Balance, amount at Sep. 30, 2023 |
13,214,890
|
$ 474,223
|
499,832,063
|
(487,091,396)
|
| Equity based compensation - employees |
1,383,909
|
$ 0
|
1,383,909
|
0
|
| 401(k) contributions paid in common stock, shares |
|
17,724
|
|
|
| 401(k) contributions paid in common stock, amount |
48,907
|
$ 177
|
48,730
|
0
|
| Stock issued to nonemployees for service, shares |
|
88,573
|
|
|
| Stock issued to nonemployees for service, amount |
202,307
|
$ 886
|
201,421
|
0
|
| Net loss |
(6,709,524)
|
$ 0
|
0
|
(6,709,524)
|
| Proceeds from the sale of common stock, shares |
|
2,490,000
|
|
|
| Proceeds from the sale of common stock, amount |
4,980,000
|
$ 24,900
|
4,955,100
|
0
|
| Share issuance costs |
(470,229)
|
$ 0
|
(470,229)
|
0
|
| Balance, shares at Dec. 31, 2023 |
|
50,018,601
|
|
|
| Balance, amount at Dec. 31, 2023 |
12,650,260
|
$ 500,186
|
505,950,994
|
(493,800,920)
|
| Balance, shares at Sep. 30, 2023 |
|
47,422,304
|
|
|
| Balance, amount at Sep. 30, 2023 |
13,214,890
|
$ 474,223
|
499,832,063
|
(487,091,396)
|
| Net loss |
(13,954,415)
|
|
|
|
| Balance, shares at Mar. 31, 2024 |
|
54,083,718
|
|
|
| Balance, amount at Mar. 31, 2024 |
14,304,643
|
$ 540,837
|
514,809,617
|
(501,045,811)
|
| Balance, shares at Dec. 31, 2023 |
|
50,018,601
|
|
|
| Balance, amount at Dec. 31, 2023 |
12,650,260
|
$ 500,186
|
505,950,994
|
(493,800,920)
|
| Equity based compensation - employees |
1,432,540
|
$ 0
|
1,432,540
|
0
|
| 401(k) contributions paid in common stock, shares |
|
27,373
|
|
|
| 401(k) contributions paid in common stock, amount |
53,485
|
$ 274
|
53,211
|
0
|
| Stock issued to nonemployees for service, shares |
|
162,744
|
|
|
| Stock issued to nonemployees for service, amount |
380,870
|
$ 1,627
|
379,243
|
0
|
| Net loss |
(7,244,891)
|
$ 0
|
0
|
(7,244,891)
|
| Proceeds from the sale of common stock, shares |
|
3,875,000
|
|
|
| Proceeds from the sale of common stock, amount |
7,750,000
|
$ 38,750
|
7,711,250
|
0
|
| Share issuance costs |
(717,621)
|
$ 0
|
(717,621)
|
0
|
| Balance, shares at Mar. 31, 2024 |
|
54,083,718
|
|
|
| Balance, amount at Mar. 31, 2024 |
$ 14,304,643
|
$ 540,837
|
$ 514,809,617
|
$ (501,045,811)
|
| X |
- References
+ Details
| Name: |
cvm_IncentiveStockForfeitedAmount |
| Namespace Prefix: |
cvm_ |
| Data Type: |
xbrli:monetaryItemType |
| Balance Type: |
debit |
| Period Type: |
duration |
|
| X |
- References
+ Details
| Name: |
cvm_IncentiveStockForfeitedShares |
| Namespace Prefix: |
cvm_ |
| Data Type: |
xbrli:sharesItemType |
| Balance Type: |
na |
| Period Type: |
duration |
|
| X |
- DefinitionAmount of expense for amortization of deferred issuance costs associated with an own-share lending arrangement.
| Name: |
cvm_ShareIssuanceCosts |
| Namespace Prefix: |
cvm_ |
| Data Type: |
xbrli:monetaryItemType |
| Balance Type: |
debit |
| Period Type: |
duration |
|
| X |
- References
+ Details
| Name: |
cvm_WarrantExercisesAmount |
| Namespace Prefix: |
cvm_ |
| Data Type: |
xbrli:monetaryItemType |
| Balance Type: |
debit |
| Period Type: |
duration |
|
| X |
- References
+ Details
| Name: |
cvm_WarrantExercisesShares |
| Namespace Prefix: |
cvm_ |
| Data Type: |
xbrli:sharesItemType |
| Balance Type: |
na |
| Period Type: |
duration |
|
| X |
- DefinitionThe portion of profit or loss for the period, net of income taxes, which is attributable to the parent. Reference 1: http://www.xbrl.org/2003/role/disclosureRef
-Topic 235
-SubTopic 10
-Name Accounting Standards Codification
-Section S99
-Paragraph 1
-Subparagraph (SX 210.4-08(g)(1)(ii))
-Publisher FASB
-URI https://asc.fasb.org//1943274/2147480678/235-10-S99-1
Reference 2: http://www.xbrl.org/2003/role/disclosureRef
-Topic 323
-SubTopic 10
-Name Accounting Standards Codification
-Section 50
-Paragraph 3
-Subparagraph (c)
-Publisher FASB
-URI https://asc.fasb.org//1943274/2147481687/323-10-50-3
Reference 3: http://www.xbrl.org/2003/role/disclosureRef
-Topic 825
-SubTopic 10
-Name Accounting Standards Codification
-Section 50
-Paragraph 28
-Subparagraph (f)
-Publisher FASB
-URI https://asc.fasb.org//1943274/2147482907/825-10-50-28
Reference 4: http://www.xbrl.org/2003/role/disclosureRef
-Topic 220
-SubTopic 10
-Name Accounting Standards Codification
-Section 50
-Paragraph 6
-Publisher FASB
-URI https://asc.fasb.org//1943274/2147482765/220-10-50-6
Reference 5: http://www.xbrl.org/2003/role/disclosureRef
-Topic 250
-SubTopic 10
-Name Accounting Standards Codification
-Section 50
-Paragraph 3
-Publisher FASB
-URI https://asc.fasb.org//1943274/2147483443/250-10-50-3
Reference 6: http://www.xbrl.org/2003/role/disclosureRef
-Topic 250
-SubTopic 10
-Name Accounting Standards Codification
-Section 50
-Paragraph 1
-Subparagraph (b)(2)
-Publisher FASB
-URI https://asc.fasb.org//1943274/2147483443/250-10-50-1
Reference 7: http://www.xbrl.org/2003/role/disclosureRef
-Topic 815
-SubTopic 40
-Name Accounting Standards Codification
-Section 65
-Paragraph 1
-Subparagraph (f)
-Publisher FASB
-URI https://asc.fasb.org//1943274/2147480175/815-40-65-1
Reference 8: http://www.xbrl.org/2003/role/disclosureRef
-Topic 250
-SubTopic 10
-Name Accounting Standards Codification
-Section 50
-Paragraph 8
-Publisher FASB
-URI https://asc.fasb.org//1943274/2147483443/250-10-50-8
Reference 9: http://www.xbrl.org/2003/role/disclosureRef
-Topic 250
-SubTopic 10
-Name Accounting Standards Codification
-Section 50
-Paragraph 9
-Publisher FASB
-URI https://asc.fasb.org//1943274/2147483443/250-10-50-9
Reference 10: http://www.xbrl.org/2003/role/disclosureRef
-Topic 250
-SubTopic 10
-Name Accounting Standards Codification
-Section 50
-Paragraph 11
-Subparagraph (a)
-Publisher FASB
-URI https://asc.fasb.org//1943274/2147483443/250-10-50-11
Reference 11: http://www.xbrl.org/2003/role/disclosureRef
-Topic 250
-SubTopic 10
-Name Accounting Standards Codification
-Section 50
-Paragraph 11
-Subparagraph (b)
-Publisher FASB
-URI https://asc.fasb.org//1943274/2147483443/250-10-50-11
Reference 12: http://www.xbrl.org/2003/role/disclosureRef
-Topic 250
-SubTopic 10
-Name Accounting Standards Codification
-Section 50
-Paragraph 4
-Publisher FASB
-URI https://asc.fasb.org//1943274/2147483443/250-10-50-4
Reference 13: http://www.xbrl.org/2003/role/exampleRef
-Topic 946
-SubTopic 830
-Name Accounting Standards Codification
-Section 55
-Paragraph 10
-Publisher FASB
-URI https://asc.fasb.org//1943274/2147480167/946-830-55-10
Reference 14: http://www.xbrl.org/2003/role/disclosureRef
-Topic 946
-SubTopic 220
-Name Accounting Standards Codification
-Section 45
-Paragraph 7
-Publisher FASB
-URI https://asc.fasb.org//1943274/2147483581/946-220-45-7
Reference 15: http://www.xbrl.org/2003/role/disclosureRef
-Topic 944
-SubTopic 220
-Name Accounting Standards Codification
-Section S99
-Paragraph 1
-Subparagraph (SX 210.7-04(18))
-Publisher FASB
-URI https://asc.fasb.org//1943274/2147483586/944-220-S99-1
Reference 16: http://www.xbrl.org/2003/role/disclosureRef
-Topic 280
-SubTopic 10
-Name Accounting Standards Codification
-Section 50
-Paragraph 22
-Publisher FASB
-URI https://asc.fasb.org//1943274/2147482810/280-10-50-22
Reference 17: http://www.xbrl.org/2003/role/disclosureRef
-Topic 946
-SubTopic 220
-Name Accounting Standards Codification
-Section S99
-Paragraph 1
-Subparagraph (SX 210.6-07(9))
-Publisher FASB
-URI https://asc.fasb.org//1943274/2147483575/946-220-S99-1
Reference 18: http://www.xbrl.org/2003/role/disclosureRef
-Topic 946
-SubTopic 220
-Name Accounting Standards Codification
-Section S99
-Paragraph 3
-Subparagraph (SX 210.6-09(1)(d))
-Publisher FASB
-URI https://asc.fasb.org//1943274/2147483575/946-220-S99-3
Reference 19: http://www.xbrl.org/2003/role/disclosureRef
-Topic 470
-SubTopic 10
-Name Accounting Standards Codification
-Section S99
-Paragraph 1A
-Subparagraph (SX 210.13-01(a)(4)(i))
-Publisher FASB
-URI https://asc.fasb.org//1943274/2147480097/470-10-S99-1A
Reference 20: http://www.xbrl.org/2009/role/commonPracticeRef
-Topic 470
-SubTopic 10
-Name Accounting Standards Codification
-Section S99
-Paragraph 1A
-Subparagraph (SX 210.13-01(a)(4)(ii))
-Publisher FASB
-URI https://asc.fasb.org//1943274/2147480097/470-10-S99-1A
Reference 21: http://www.xbrl.org/2003/role/disclosureRef
-Topic 470
-SubTopic 10
-Name Accounting Standards Codification
-Section S99
-Paragraph 1A
-Subparagraph (SX 210.13-01(a)(4)(iii)(A))
-Publisher FASB
-URI https://asc.fasb.org//1943274/2147480097/470-10-S99-1A
Reference 22: http://www.xbrl.org/2003/role/disclosureRef
-Topic 470
-SubTopic 10
-Name Accounting Standards Codification
-Section S99
-Paragraph 1A
-Subparagraph (SX 210.13-01(a)(4)(iv))
-Publisher FASB
-URI https://asc.fasb.org//1943274/2147480097/470-10-S99-1A
Reference 23: http://www.xbrl.org/2003/role/disclosureRef
-Topic 470
-SubTopic 10
-Name Accounting Standards Codification
-Section S99
-Paragraph 1A
-Subparagraph (SX 210.13-01(a)(5))
-Publisher FASB
-URI https://asc.fasb.org//1943274/2147480097/470-10-S99-1A
Reference 24: http://www.xbrl.org/2003/role/disclosureRef
-Topic 470
-SubTopic 10
-Name Accounting Standards Codification
-Section S99
-Paragraph 1B
-Subparagraph (SX 210.13-02(a)(4)(i))
-Publisher FASB
-URI https://asc.fasb.org//1943274/2147480097/470-10-S99-1B
Reference 25: http://www.xbrl.org/2003/role/disclosureRef
-Topic 470
-SubTopic 10
-Name Accounting Standards Codification
-Section S99
-Paragraph 1B
-Subparagraph (SX 210.13-02(a)(4)(iii)(A))
-Publisher FASB
-URI https://asc.fasb.org//1943274/2147480097/470-10-S99-1B
Reference 26: http://www.xbrl.org/2003/role/disclosureRef
-Topic 470
-SubTopic 10
-Name Accounting Standards Codification
-Section S99
-Paragraph 1B
-Subparagraph (SX 210.13-02(a)(4)(iii)(B))
-Publisher FASB
-URI https://asc.fasb.org//1943274/2147480097/470-10-S99-1B
Reference 27: http://www.xbrl.org/2003/role/disclosureRef
-Topic 470
-SubTopic 10
-Name Accounting Standards Codification
-Section S99
-Paragraph 1B
-Subparagraph (SX 210.13-02(a)(4)(iv))
-Publisher FASB
-URI https://asc.fasb.org//1943274/2147480097/470-10-S99-1B
Reference 28: http://www.xbrl.org/2003/role/disclosureRef
-Topic 470
-SubTopic 10
-Name Accounting Standards Codification
-Section S99
-Paragraph 1B
-Subparagraph (SX 210.13-02(a)(5))
-Publisher FASB
-URI https://asc.fasb.org//1943274/2147480097/470-10-S99-1B
Reference 29: http://www.xbrl.org/2003/role/disclosureRef
-Topic 280
-SubTopic 10
-Name Accounting Standards Codification
-Section 50
-Paragraph 30
-Subparagraph (b)
-Publisher FASB
-URI https://asc.fasb.org//1943274/2147482810/280-10-50-30
Reference 30: http://www.xbrl.org/2003/role/disclosureRef
-Topic 280
-SubTopic 10
-Name Accounting Standards Codification
-Section 50
-Paragraph 32
-Subparagraph (f)
-Publisher FASB
-URI https://asc.fasb.org//1943274/2147482810/280-10-50-32
Reference 31: http://www.xbrl.org/2003/role/disclosureRef
-Topic 260
-SubTopic 10
-Name Accounting Standards Codification
-Section 45
-Paragraph 60B
-Subparagraph (a)
-Publisher FASB
-URI https://asc.fasb.org//1943274/2147482689/260-10-45-60B
Reference 32: http://www.xbrl.org/2003/role/exampleRef
-Topic 280
-SubTopic 10
-Name Accounting Standards Codification
-Section 50
-Paragraph 31
-Publisher FASB
-URI https://asc.fasb.org//1943274/2147482810/280-10-50-31
Reference 33: http://www.xbrl.org/2003/role/disclosureRef
-Topic 280
-SubTopic 10
-Name Accounting Standards Codification
-Section 50
-Paragraph 32
-Subparagraph (c)
-Publisher FASB
-URI https://asc.fasb.org//1943274/2147482810/280-10-50-32
Reference 34: http://www.xbrl.org/2003/role/disclosureRef
-Topic 205
-SubTopic 20
-Name Accounting Standards Codification
-Section 50
-Paragraph 7
-Publisher FASB
-URI https://asc.fasb.org//1943274/2147483499/205-20-50-7
Reference 35: http://fasb.org/us-gaap/role/ref/legacyRef
-Topic 230
-SubTopic 10
-Name Accounting Standards Codification
-Section 45
-Paragraph 28
-Publisher FASB
-URI https://asc.fasb.org//1943274/2147482740/230-10-45-28
Reference 36: http://www.xbrl.org/2003/role/disclosureRef
-Topic 220
-SubTopic 10
-Name Accounting Standards Codification
-Section 45
-Paragraph 1A
-Subparagraph (a)
-Publisher FASB
-URI https://asc.fasb.org//1943274/2147482790/220-10-45-1A
Reference 37: http://www.xbrl.org/2003/role/disclosureRef
-Topic 220
-SubTopic 10
-Name Accounting Standards Codification
-Section 45
-Paragraph 1B
-Subparagraph (a)
-Publisher FASB
-URI https://asc.fasb.org//1943274/2147482790/220-10-45-1B
Reference 38: http://fasb.org/us-gaap/role/ref/legacyRef
-Topic 220
-SubTopic 10
-Name Accounting Standards Codification
-Section S99
-Paragraph 2
-Subparagraph (SX 210.5-03(20))
-Publisher FASB
-URI https://asc.fasb.org//1943274/2147483621/220-10-S99-2
Reference 39: http://fasb.org/us-gaap/role/ref/legacyRef
-Topic 942
-SubTopic 220
-Name Accounting Standards Codification
-Section S99
-Paragraph 1
-Subparagraph (SX 210.9-04(22))
-Publisher FASB
-URI https://asc.fasb.org//1943274/2147483589/942-220-S99-1
| Name: |
us-gaap_NetIncomeLoss |
| Namespace Prefix: |
us-gaap_ |
| Data Type: |
xbrli:monetaryItemType |
| Balance Type: |
credit |
| Period Type: |
duration |
|
| X |
- DefinitionNumber of shares of stock issued as of the balance sheet date, including shares that had been issued and were previously outstanding but which are now held in the treasury. Reference 1: http://fasb.org/us-gaap/role/ref/legacyRef
-Name Accounting Standards Codification
-Section 50
-Paragraph 2
-SubTopic 10
-Topic 505
-Publisher FASB
-URI https://asc.fasb.org//1943274/2147481112/505-10-50-2
| Name: |
us-gaap_SharesIssued |
| Namespace Prefix: |
us-gaap_ |
| Data Type: |
xbrli:sharesItemType |
| Balance Type: |
na |
| Period Type: |
instant |
|
| X |
- DefinitionNumber of shares issued during the period to an employee benefit plan, such as a defined contribution or defined benefit plan.
| Name: |
us-gaap_StockIssuedDuringPeriodSharesEmployeeBenefitPlan |
| Namespace Prefix: |
us-gaap_ |
| Data Type: |
xbrli:sharesItemType |
| Balance Type: |
na |
| Period Type: |
duration |
|
| X |
- DefinitionNumber of shares issued in lieu of cash for services contributed to the entity. Number of shares includes, but is not limited to, shares issued for services contributed by vendors and founders.
| Name: |
us-gaap_StockIssuedDuringPeriodSharesIssuedForServices |
| Namespace Prefix: |
us-gaap_ |
| Data Type: |
xbrli:sharesItemType |
| Balance Type: |
na |
| Period Type: |
duration |
|
| X |
- DefinitionNumber of new stock issued during the period. Reference 1: http://fasb.org/us-gaap/role/ref/legacyRef
-Name Accounting Standards Codification
-Section 50
-Paragraph 2
-SubTopic 10
-Topic 505
-Publisher FASB
-URI https://asc.fasb.org//1943274/2147481112/505-10-50-2
Reference 2: http://www.xbrl.org/2003/role/disclosureRef
-Topic 946
-SubTopic 505
-Name Accounting Standards Codification
-Section 50
-Paragraph 2
-Subparagraph (a)
-Publisher FASB
-URI https://asc.fasb.org//1943274/2147481004/946-505-50-2
Reference 3: http://www.xbrl.org/2003/role/disclosureRef
-Topic 946
-SubTopic 220
-Name Accounting Standards Codification
-Section S99
-Paragraph 3
-Subparagraph (SX 210.6-09(4)(b))
-Publisher FASB
-URI https://asc.fasb.org//1943274/2147483575/946-220-S99-3
Reference 4: http://www.xbrl.org/2003/role/disclosureRef
-Topic 946
-SubTopic 10
-Name Accounting Standards Codification
-Section S99
-Paragraph 3
-Subparagraph (SX 210.6-03(i)(1))
-Publisher FASB
-URI https://asc.fasb.org//1943274/2147479886/946-10-S99-3
Reference 5: http://fasb.org/us-gaap/role/ref/legacyRef
-Topic 210
-SubTopic 10
-Name Accounting Standards Codification
-Section S99
-Paragraph 1
-Subparagraph (SX 210.5-02(28))
-Publisher FASB
-URI https://asc.fasb.org//1943274/2147480566/210-10-S99-1
Reference 6: http://fasb.org/us-gaap/role/ref/legacyRef
-Topic 505
-SubTopic 10
-Name Accounting Standards Codification
-Section S99
-Paragraph 1
-Subparagraph (SX 210.3-04)
-Publisher FASB
-URI https://asc.fasb.org//1943274/2147480008/505-10-S99-1
Reference 7: http://fasb.org/us-gaap/role/ref/legacyRef
-Topic 210
-SubTopic 10
-Name Accounting Standards Codification
-Section S99
-Paragraph 1
-Subparagraph (SX 210.5-02(29))
-Publisher FASB
-URI https://asc.fasb.org//1943274/2147480566/210-10-S99-1
| Name: |
us-gaap_StockIssuedDuringPeriodSharesNewIssues |
| Namespace Prefix: |
us-gaap_ |
| Data Type: |
xbrli:sharesItemType |
| Balance Type: |
na |
| Period Type: |
duration |
|
| X |
- DefinitionValue of shares issued during the period to an employee benefit plan, such as a defined contribution or defined benefit plan.
| Name: |
us-gaap_StockIssuedDuringPeriodValueEmployeeBenefitPlan |
| Namespace Prefix: |
us-gaap_ |
| Data Type: |
xbrli:monetaryItemType |
| Balance Type: |
credit |
| Period Type: |
duration |
|
| X |
- DefinitionValue of stock issued in lieu of cash for services contributed to the entity. Value of the stock issued includes, but is not limited to, services contributed by vendors and founders.
| Name: |
us-gaap_StockIssuedDuringPeriodValueIssuedForServices |
| Namespace Prefix: |
us-gaap_ |
| Data Type: |
xbrli:monetaryItemType |
| Balance Type: |
credit |
| Period Type: |
duration |
|
| X |
- DefinitionEquity impact of the value of new stock issued during the period. Includes shares issued in an initial public offering or a secondary public offering. Reference 1: http://fasb.org/us-gaap/role/ref/legacyRef
-Name Accounting Standards Codification
-Section 50
-Paragraph 2
-SubTopic 10
-Topic 505
-Publisher FASB
-URI https://asc.fasb.org//1943274/2147481112/505-10-50-2
Reference 2: http://www.xbrl.org/2003/role/exampleRef
-Topic 946
-SubTopic 830
-Name Accounting Standards Codification
-Section 55
-Paragraph 11
-Publisher FASB
-URI https://asc.fasb.org//1943274/2147480167/946-830-55-11
Reference 3: http://www.xbrl.org/2003/role/disclosureRef
-Topic 946
-SubTopic 205
-Name Accounting Standards Codification
-Section 45
-Paragraph 4
-Subparagraph (a)
-Publisher FASB
-URI https://asc.fasb.org//1943274/2147480767/946-205-45-4
Reference 4: http://www.xbrl.org/2003/role/disclosureRef
-Topic 946
-SubTopic 505
-Name Accounting Standards Codification
-Section 50
-Paragraph 2
-Subparagraph (a)
-Publisher FASB
-URI https://asc.fasb.org//1943274/2147481004/946-505-50-2
Reference 5: http://www.xbrl.org/2003/role/disclosureRef
-Topic 946
-SubTopic 220
-Name Accounting Standards Codification
-Section S99
-Paragraph 3
-Subparagraph (SX 210.6-09(4)(b))
-Publisher FASB
-URI https://asc.fasb.org//1943274/2147483575/946-220-S99-3
Reference 6: http://fasb.org/us-gaap/role/ref/legacyRef
-Topic 210
-SubTopic 10
-Name Accounting Standards Codification
-Section S99
-Paragraph 1
-Subparagraph (SX 210.5-02(28))
-Publisher FASB
-URI https://asc.fasb.org//1943274/2147480566/210-10-S99-1
Reference 7: http://fasb.org/us-gaap/role/ref/legacyRef
-Topic 505
-SubTopic 10
-Name Accounting Standards Codification
-Section S99
-Paragraph 1
-Subparagraph (SX 210.3-04)
-Publisher FASB
-URI https://asc.fasb.org//1943274/2147480008/505-10-S99-1
Reference 8: http://fasb.org/us-gaap/role/ref/legacyRef
-Topic 210
-SubTopic 10
-Name Accounting Standards Codification
-Section S99
-Paragraph 1
-Subparagraph (SX 210.5-02(29))
-Publisher FASB
-URI https://asc.fasb.org//1943274/2147480566/210-10-S99-1
| Name: |
us-gaap_StockIssuedDuringPeriodValueNewIssues |
| Namespace Prefix: |
us-gaap_ |
| Data Type: |
xbrli:monetaryItemType |
| Balance Type: |
credit |
| Period Type: |
duration |
|
| X |
- DefinitionValue, after forfeiture, of shares issued under share-based payment arrangement. Excludes employee stock ownership plan (ESOP). Reference 1: http://fasb.org/us-gaap/role/ref/legacyRef
-Topic 210
-SubTopic 10
-Name Accounting Standards Codification
-Section S99
-Paragraph 1
-Subparagraph (SX 210.5-02(28))
-Publisher FASB
-URI https://asc.fasb.org//1943274/2147480566/210-10-S99-1
Reference 2: http://fasb.org/us-gaap/role/ref/legacyRef
-Topic 505
-SubTopic 10
-Name Accounting Standards Codification
-Section S99
-Paragraph 1
-Subparagraph (SX 210.3-04)
-Publisher FASB
-URI https://asc.fasb.org//1943274/2147480008/505-10-S99-1
Reference 3: http://fasb.org/us-gaap/role/ref/legacyRef
-Topic 210
-SubTopic 10
-Name Accounting Standards Codification
-Section S99
-Paragraph 1
-Subparagraph (SX 210.5-02(29))
-Publisher FASB
-URI https://asc.fasb.org//1943274/2147480566/210-10-S99-1
Reference 4: http://fasb.org/us-gaap/role/ref/legacyRef
-Name Accounting Standards Codification
-Topic 718
-SubTopic 10
-Section 50
-Paragraph 2
-Subparagraph (d)(1)
-Publisher FASB
-URI https://asc.fasb.org//1943274/2147480429/718-10-50-2
| Name: |
us-gaap_StockIssuedDuringPeriodValueShareBasedCompensation |
| Namespace Prefix: |
us-gaap_ |
| Data Type: |
xbrli:monetaryItemType |
| Balance Type: |
credit |
| Period Type: |
duration |
|
| X |
- DefinitionAmount of equity (deficit) attributable to parent. Excludes temporary equity and equity attributable to noncontrolling interest. Reference 1: http://www.xbrl.org/2003/role/exampleRef
-Topic 852
-SubTopic 10
-Name Accounting Standards Codification
-Section 55
-Paragraph 10
-Publisher FASB
-URI https://asc.fasb.org//1943274/2147481372/852-10-55-10
Reference 2: http://www.xbrl.org/2003/role/exampleRef
-Topic 946
-SubTopic 830
-Name Accounting Standards Codification
-Section 55
-Paragraph 12
-Publisher FASB
-URI https://asc.fasb.org//1943274/2147480167/946-830-55-12
Reference 3: http://www.xbrl.org/2003/role/disclosureRef
-Topic 946
-SubTopic 210
-Name Accounting Standards Codification
-Section S99
-Paragraph 1
-Subparagraph (SX 210.6-04(19))
-Publisher FASB
-URI https://asc.fasb.org//1943274/2147479617/946-210-S99-1
Reference 4: http://www.xbrl.org/2003/role/disclosureRef
-Topic 946
-SubTopic 210
-Name Accounting Standards Codification
-Section S99
-Paragraph 2
-Subparagraph (SX 210.6-05(4))
-Publisher FASB
-URI https://asc.fasb.org//1943274/2147479617/946-210-S99-2
Reference 5: http://www.xbrl.org/2009/role/commonPracticeRef
-Topic 946
-SubTopic 220
-Name Accounting Standards Codification
-Section S99
-Paragraph 3
-Subparagraph (SX 210.6-09(4)(b))
-Publisher FASB
-URI https://asc.fasb.org//1943274/2147483575/946-220-S99-3
Reference 6: http://www.xbrl.org/2003/role/disclosureRef
-Topic 946
-SubTopic 220
-Name Accounting Standards Codification
-Section S99
-Paragraph 3
-Subparagraph (SX 210.6-09(6))
-Publisher FASB
-URI https://asc.fasb.org//1943274/2147483575/946-220-S99-3
Reference 7: http://www.xbrl.org/2003/role/disclosureRef
-Topic 946
-SubTopic 220
-Name Accounting Standards Codification
-Section S99
-Paragraph 3
-Subparagraph (SX 210.6-09(7))
-Publisher FASB
-URI https://asc.fasb.org//1943274/2147483575/946-220-S99-3
Reference 8: http://www.xbrl.org/2009/role/commonPracticeRef
-Topic 235
-SubTopic 10
-Name Accounting Standards Codification
-Section S99
-Paragraph 1
-Subparagraph (SX 210.4-08(g)(1)(ii))
-Publisher FASB
-URI https://asc.fasb.org//1943274/2147480678/235-10-S99-1
Reference 9: http://www.xbrl.org/2009/role/commonPracticeRef
-Topic 323
-SubTopic 10
-Name Accounting Standards Codification
-Section 50
-Paragraph 3
-Subparagraph (c)
-Publisher FASB
-URI https://asc.fasb.org//1943274/2147481687/323-10-50-3
Reference 10: http://www.xbrl.org/2009/role/commonPracticeRef
-Topic 825
-SubTopic 10
-Name Accounting Standards Codification
-Section 50
-Paragraph 28
-Subparagraph (f)
-Publisher FASB
-URI https://asc.fasb.org//1943274/2147482907/825-10-50-28
Reference 11: http://fasb.org/us-gaap/role/ref/legacyRef
-Topic 210
-SubTopic 10
-Name Accounting Standards Codification
-Section S99
-Paragraph 1
-Subparagraph (SX 210.5-02(29))
-Publisher FASB
-URI https://asc.fasb.org//1943274/2147480566/210-10-S99-1
Reference 12: http://fasb.org/us-gaap/role/ref/legacyRef
-Topic 210
-SubTopic 10
-Name Accounting Standards Codification
-Section S99
-Paragraph 1
-Subparagraph (SX 210.5-02(31))
-Publisher FASB
-URI https://asc.fasb.org//1943274/2147480566/210-10-S99-1
Reference 13: http://fasb.org/us-gaap/role/ref/legacyRef
-Topic 210
-SubTopic 10
-Name Accounting Standards Codification
-Section S99
-Paragraph 1
-Subparagraph (SX 210.5-02(30))
-Publisher FASB
-URI https://asc.fasb.org//1943274/2147480566/210-10-S99-1
Reference 14: http://fasb.org/us-gaap/role/ref/legacyRef
-Topic 310
-SubTopic 10
-Name Accounting Standards Codification
-Section S99
-Paragraph 2
-Subparagraph (SAB Topic 4.E)
-Publisher FASB
-URI https://asc.fasb.org//1943274/2147480418/310-10-S99-2
| Name: |
us-gaap_StockholdersEquity |
| Namespace Prefix: |
us-gaap_ |
| Data Type: |
xbrli:monetaryItemType |
| Balance Type: |
credit |
| Period Type: |
instant |
|
v3.24.1.1.u2
CONDENSED STATEMENTS OF CASH FLOWS (UNAUDITED) - USD ($)
|
6 Months Ended |
Mar. 31, 2024 |
Mar. 31, 2023 |
| CONDENSED STATEMENTS OF CASH FLOWS (UNAUDITED) |
|
|
| Net loss |
$ (13,954,415)
|
$ (16,196,318)
|
| Adjustments to reconcile net loss to net cash used in operating activities: |
|
|
| Depreciation and amortization |
1,993,395
|
1,973,982
|
| Non-cash lease expense |
4,383
|
9,545
|
| Share-based payments for services |
547,893
|
285,722
|
| Equity-based compensation |
2,816,449
|
3,436,119
|
| Common stock contributed to 401(k) plan |
102,392
|
105,043
|
| (Increase)/decrease in assets: |
|
|
| Prepaid expenses |
(30,996)
|
180,222
|
| Supplies used for R&D and manufacturing |
240,067
|
170,434
|
| Deposits |
(11,884)
|
(2,354,723)
|
| Increase/(decrease) in liabilities: |
|
|
| Accounts payable |
(896,939)
|
102,841
|
| Accrued expenses |
59,818
|
111,515
|
| Due to employees |
194,363
|
37,798
|
| Net cash used in operating activities |
(9,415,608)
|
(12,137,820)
|
| CASH FLOWS FROM INVESTING ACTIVITIES: |
|
|
| Purchases of property and equipment |
(51,650)
|
(165,032)
|
| Expenditures for patent costs |
(13,211)
|
0
|
| Net cash used in investing activities |
(64,861)
|
(165,032)
|
| CASH FLOWS FROM FINANCING ACTIVITIES: |
|
|
| Proceeds from issuance of common stock |
12,730,000
|
0
|
| Payments of stock issuance costs |
(1,218,937)
|
(9,010)
|
| Proceeds from the exercise of warrants |
0
|
447,291
|
| Payments on obligations under finance leases |
(867,008)
|
(761,223)
|
| Net cash provided by (used in) financing activities |
10,644,055
|
(322,942)
|
| NET INCREASE (DECREASE) IN CASH AND CASH EQUIVALENTS |
1,163,586
|
(12,625,794)
|
| CASH AND CASH EQUIVALENTS, BEGINNING OF PERIOD |
4,145,735
|
22,672,138
|
| CASH AND CASH EQUIVALENTS, END OF PERIOD |
5,309,321
|
10,046,344
|
| Property and equipment purchases included in current liabilities |
0
|
176,743
|
| Assets purchased under finance leases |
20,797
|
0
|
| Finance lease obligation included in accounts payable |
522
|
1,402
|
| Consulting services paid with issuance of common stock |
583,177
|
192,258
|
| Accrued consulting services to be paid with common stock |
165,000
|
165,000
|
| Financing costs included in current liabilities |
46,616
|
0
|
| Cash paid for interest |
$ 480,044
|
$ 547,765
|
| X |
- References
+ Details
| Name: |
cvm_AccruedConsultingServicesToBePaidWithCommonStock |
| Namespace Prefix: |
cvm_ |
| Data Type: |
xbrli:monetaryItemType |
| Balance Type: |
credit |
| Period Type: |
duration |
|
| X |
- References
+ Details
| Name: |
cvm_AssetsPurchasedUnderFinanceLeases |
| Namespace Prefix: |
cvm_ |
| Data Type: |
xbrli:monetaryItemType |
| Balance Type: |
credit |
| Period Type: |
duration |
|
| X |
- References
+ Details
| Name: |
cvm_CommonStockContributedToEmployeeBenefitPlan |
| Namespace Prefix: |
cvm_ |
| Data Type: |
xbrli:monetaryItemType |
| Balance Type: |
debit |
| Period Type: |
duration |
|
| X |
- References
+ Details
| Name: |
cvm_ConsultingServicesPaidWithIssuanceOfCommonStock |
| Namespace Prefix: |
cvm_ |
| Data Type: |
xbrli:monetaryItemType |
| Balance Type: |
credit |
| Period Type: |
duration |
|
| X |
- References
+ Details
| Name: |
cvm_FinanceLeaseObligationIncludedInAccountsPayable |
| Namespace Prefix: |
cvm_ |
| Data Type: |
xbrli:monetaryItemType |
| Balance Type: |
credit |
| Period Type: |
duration |
|
| X |
- References
+ Details
| Name: |
cvm_FinancingCostsIncludedInCurrentLiabilities |
| Namespace Prefix: |
cvm_ |
| Data Type: |
xbrli:monetaryItemType |
| Balance Type: |
credit |
| Period Type: |
duration |
|
| X |
- References
+ Details
| Name: |
cvm_IncreaseDecreaseInDepositAssets |
| Namespace Prefix: |
cvm_ |
| Data Type: |
xbrli:monetaryItemType |
| Balance Type: |
credit |
| Period Type: |
duration |
|
| X |
- References
+ Details
| Name: |
cvm_PropertyAndEquipmentPurchasesIncludedInCurrentLiabilities |
| Namespace Prefix: |
cvm_ |
| Data Type: |
xbrli:monetaryItemType |
| Balance Type: |
credit |
| Period Type: |
duration |
|
| X |
- References
+ Details
| Name: |
us-gaap_AdjustmentsToReconcileNetIncomeLossToCashProvidedByUsedInOperatingActivitiesAbstract |
| Namespace Prefix: |
us-gaap_ |
| Data Type: |
xbrli:stringItemType |
| Balance Type: |
na |
| Period Type: |
duration |
|
| X |
- DefinitionAmount of cash and cash equivalents, and cash and cash equivalents restricted to withdrawal or usage. Excludes amount for disposal group and discontinued operations. Cash includes, but is not limited to, currency on hand, demand deposits with banks or financial institutions, and other accounts with general characteristics of demand deposits. Cash equivalents include, but are not limited to, short-term, highly liquid investments that are both readily convertible to known amounts of cash and so near their maturity that they present insignificant risk of changes in value because of changes in interest rates. Reference 1: http://www.xbrl.org/2003/role/disclosureRef
-Topic 230
-SubTopic 10
-Name Accounting Standards Codification
-Section 50
-Paragraph 8
-Publisher FASB
-URI https://asc.fasb.org//1943274/2147482913/230-10-50-8
Reference 2: http://fasb.org/us-gaap/role/ref/legacyRef
-Topic 230
-SubTopic 10
-Name Accounting Standards Codification
-Section 45
-Paragraph 24
-Publisher FASB
-URI https://asc.fasb.org//1943274/2147482740/230-10-45-24
Reference 3: http://fasb.org/us-gaap/role/ref/legacyRef
-Name Accounting Standards Codification
-Topic 230
-SubTopic 10
-Section 45
-Paragraph 4
-Publisher FASB
-URI https://asc.fasb.org//1943274/2147482740/230-10-45-4
| Name: |
us-gaap_CashCashEquivalentsRestrictedCashAndRestrictedCashEquivalents |
| Namespace Prefix: |
us-gaap_ |
| Data Type: |
xbrli:monetaryItemType |
| Balance Type: |
debit |
| Period Type: |
instant |
|
| X |
- DefinitionAmount of increase (decrease) in cash and cash equivalents, and cash and cash equivalents restricted to withdrawal or usage; excluding effect from exchange rate change. Cash includes, but is not limited to, currency on hand, demand deposits with banks or financial institutions, and other accounts with general characteristics of demand deposits. Cash equivalents include, but are not limited to, short-term, highly liquid investments that are both readily convertible to known amounts of cash and so near their maturity that they present insignificant risk of changes in value because of changes in interest rates. Reference 1: http://fasb.org/us-gaap/role/ref/legacyRef
-Topic 230
-SubTopic 10
-Name Accounting Standards Codification
-Section 45
-Paragraph 24
-Publisher FASB
-URI https://asc.fasb.org//1943274/2147482740/230-10-45-24
Reference 2: http://fasb.org/us-gaap/role/ref/legacyRef
-Name Accounting Standards Codification
-Section 45
-Paragraph 1
-SubTopic 230
-Topic 830
-Publisher FASB
-URI https://asc.fasb.org//1943274/2147481877/830-230-45-1
| Name: |
us-gaap_CashCashEquivalentsRestrictedCashAndRestrictedCashEquivalentsPeriodIncreaseDecreaseExcludingExchangeRateEffect |
| Namespace Prefix: |
us-gaap_ |
| Data Type: |
xbrli:monetaryItemType |
| Balance Type: |
debit |
| Period Type: |
duration |
|
| X |
- DefinitionThe current period expense charged against earnings on long-lived, physical assets not used in production, and which are not intended for resale, to allocate or recognize the cost of such assets over their useful lives; or to record the reduction in book value of an intangible asset over the benefit period of such asset; or to reflect consumption during the period of an asset that is not used in production. Reference 1: http://fasb.org/us-gaap/role/ref/legacyRef
-Name Accounting Standards Codification
-Section 45
-Paragraph 28
-Subparagraph (b)
-SubTopic 10
-Topic 230
-Publisher FASB
-URI https://asc.fasb.org//1943274/2147482740/230-10-45-28
Reference 2: http://fasb.org/us-gaap/role/ref/legacyRef
-Name Accounting Standards Codification
-Topic 360
-SubTopic 10
-Section 50
-Paragraph 1
-Subparagraph (a)
-Publisher FASB
-URI https://asc.fasb.org//1943274/2147482099/360-10-50-1
| Name: |
us-gaap_DepreciationAndAmortization |
| Namespace Prefix: |
us-gaap_ |
| Data Type: |
xbrli:monetaryItemType |
| Balance Type: |
debit |
| Period Type: |
duration |
|
| X |
- DefinitionThe increase (decrease) during the reporting period in the aggregate amount of liabilities incurred (and for which invoices have typically been received) and payable to vendors for goods and services received that are used in an entity's business. Reference 1: http://fasb.org/us-gaap/role/ref/legacyRef
-Name Accounting Standards Codification
-Section 45
-Paragraph 28
-Subparagraph (a)
-SubTopic 10
-Topic 230
-Publisher FASB
-URI https://asc.fasb.org//1943274/2147482740/230-10-45-28
| Name: |
us-gaap_IncreaseDecreaseInAccountsPayable |
| Namespace Prefix: |
us-gaap_ |
| Data Type: |
xbrli:monetaryItemType |
| Balance Type: |
debit |
| Period Type: |
duration |
|
| X |
- DefinitionThe increase (decrease) during the reporting period in the aggregate amount of expenses incurred but not yet paid. Reference 1: http://fasb.org/us-gaap/role/ref/legacyRef
-Name Accounting Standards Codification
-Section 45
-Paragraph 28
-Subparagraph (a)
-SubTopic 10
-Topic 230
-Publisher FASB
-URI https://asc.fasb.org//1943274/2147482740/230-10-45-28
| Name: |
us-gaap_IncreaseDecreaseInAccruedLiabilities |
| Namespace Prefix: |
us-gaap_ |
| Data Type: |
xbrli:monetaryItemType |
| Balance Type: |
debit |
| Period Type: |
duration |
|
| X |
- DefinitionThe increase (decrease) during the reporting period in the aggregate value of all inventory held by the reporting entity, associated with underlying transactions that are classified as operating activities. Reference 1: http://fasb.org/us-gaap/role/ref/legacyRef
-Name Accounting Standards Codification
-Section 45
-Paragraph 28
-Subparagraph (a)
-SubTopic 10
-Topic 230
-Publisher FASB
-URI https://asc.fasb.org//1943274/2147482740/230-10-45-28
| Name: |
us-gaap_IncreaseDecreaseInInventories |
| Namespace Prefix: |
us-gaap_ |
| Data Type: |
xbrli:monetaryItemType |
| Balance Type: |
credit |
| Period Type: |
duration |
|
| X |
- References
+ Details
| Name: |
us-gaap_IncreaseDecreaseInOperatingAssetsAbstract |
| Namespace Prefix: |
us-gaap_ |
| Data Type: |
xbrli:stringItemType |
| Balance Type: |
na |
| Period Type: |
duration |
|
| X |
- References
+ Details
| Name: |
us-gaap_IncreaseDecreaseInOperatingLiabilitiesAbstract |
| Namespace Prefix: |
us-gaap_ |
| Data Type: |
xbrli:stringItemType |
| Balance Type: |
na |
| Period Type: |
duration |
|
| X |
- DefinitionThe increase (decrease) during the reporting period in the amount of outstanding money paid in advance for goods or services that bring economic benefits for future periods. Reference 1: http://fasb.org/us-gaap/role/ref/legacyRef
-Name Accounting Standards Codification
-Section 45
-Paragraph 28
-Subparagraph (a)
-SubTopic 10
-Topic 230
-Publisher FASB
-URI https://asc.fasb.org//1943274/2147482740/230-10-45-28
| Name: |
us-gaap_IncreaseDecreaseInPrepaidExpense |
| Namespace Prefix: |
us-gaap_ |
| Data Type: |
xbrli:monetaryItemType |
| Balance Type: |
credit |
| Period Type: |
duration |
|
| X |
- DefinitionAmount of cash paid for interest, excluding capitalized interest, classified as operating activity. Includes, but is not limited to, payment to settle zero-coupon bond for accreted interest of debt discount and debt instrument with insignificant coupon interest rate in relation to effective interest rate of borrowing attributable to accreted interest of debt discount. Reference 1: http://www.xbrl.org/2003/role/disclosureRef
-Topic 230
-SubTopic 10
-Name Accounting Standards Codification
-Section 45
-Paragraph 17
-Subparagraph (d)
-Publisher FASB
-URI https://asc.fasb.org//1943274/2147482740/230-10-45-17
Reference 2: http://www.xbrl.org/2003/role/disclosureRef
-Topic 230
-SubTopic 10
-Name Accounting Standards Codification
-Section 45
-Paragraph 25
-Subparagraph (e)
-Publisher FASB
-URI https://asc.fasb.org//1943274/2147482740/230-10-45-25
Reference 3: http://www.xbrl.org/2003/role/disclosureRef
-Topic 230
-SubTopic 10
-Name Accounting Standards Codification
-Section 50
-Paragraph 2
-Publisher FASB
-URI https://asc.fasb.org//1943274/2147482913/230-10-50-2
| Name: |
us-gaap_InterestPaidNet |
| Namespace Prefix: |
us-gaap_ |
| Data Type: |
xbrli:monetaryItemType |
| Balance Type: |
credit |
| Period Type: |
duration |
|
| X |
- DefinitionFair value of share-based compensation granted to nonemployees as payment for services rendered or acknowledged claims. Reference 1: http://fasb.org/us-gaap/role/ref/legacyRef
-Name Accounting Standards Codification
-Section 45
-Paragraph 28
-Subparagraph (b)
-SubTopic 10
-Topic 230
-Publisher FASB
-URI https://asc.fasb.org//1943274/2147482740/230-10-45-28
| Name: |
us-gaap_IssuanceOfStockAndWarrantsForServicesOrClaims |
| Namespace Prefix: |
us-gaap_ |
| Data Type: |
xbrli:monetaryItemType |
| Balance Type: |
debit |
| Period Type: |
duration |
|
| X |
- DefinitionAmount of cash inflow (outflow) from financing activities, including discontinued operations. Financing activity cash flows include obtaining resources from owners and providing them with a return on, and a return of, their investment; borrowing money and repaying amounts borrowed, or settling the obligation; and obtaining and paying for other resources obtained from creditors on long-term credit. Reference 1: http://www.xbrl.org/2003/role/disclosureRef
-Topic 230
-SubTopic 10
-Name Accounting Standards Codification
-Section 45
-Paragraph 24
-Publisher FASB
-URI https://asc.fasb.org//1943274/2147482740/230-10-45-24
| Name: |
us-gaap_NetCashProvidedByUsedInFinancingActivities |
| Namespace Prefix: |
us-gaap_ |
| Data Type: |
xbrli:monetaryItemType |
| Balance Type: |
debit |
| Period Type: |
duration |
|
| X |
- References
+ Details
| Name: |
us-gaap_NetCashProvidedByUsedInFinancingActivitiesAbstract |
| Namespace Prefix: |
us-gaap_ |
| Data Type: |
xbrli:stringItemType |
| Balance Type: |
na |
| Period Type: |
duration |
|
| X |
- DefinitionAmount of cash inflow (outflow) from investing activities, including discontinued operations. Investing activity cash flows include making and collecting loans and acquiring and disposing of debt or equity instruments and property, plant, and equipment and other productive assets. Reference 1: http://www.xbrl.org/2003/role/disclosureRef
-Topic 230
-SubTopic 10
-Name Accounting Standards Codification
-Section 45
-Paragraph 24
-Publisher FASB
-URI https://asc.fasb.org//1943274/2147482740/230-10-45-24
| Name: |
us-gaap_NetCashProvidedByUsedInInvestingActivities |
| Namespace Prefix: |
us-gaap_ |
| Data Type: |
xbrli:monetaryItemType |
| Balance Type: |
debit |
| Period Type: |
duration |
|
| X |
- References
+ Details
| Name: |
us-gaap_NetCashProvidedByUsedInInvestingActivitiesAbstract |
| Namespace Prefix: |
us-gaap_ |
| Data Type: |
xbrli:stringItemType |
| Balance Type: |
na |
| Period Type: |
duration |
|
| X |
- DefinitionAmount of cash inflow (outflow) from operating activities, including discontinued operations. Operating activity cash flows include transactions, adjustments, and changes in value not defined as investing or financing activities. Reference 1: http://fasb.org/us-gaap/role/ref/legacyRef
-Topic 230
-SubTopic 10
-Name Accounting Standards Codification
-Section 45
-Paragraph 28
-Publisher FASB
-URI https://asc.fasb.org//1943274/2147482740/230-10-45-28
Reference 2: http://fasb.org/us-gaap/role/ref/legacyRef
-Topic 230
-SubTopic 10
-Name Accounting Standards Codification
-Section 45
-Paragraph 24
-Publisher FASB
-URI https://asc.fasb.org//1943274/2147482740/230-10-45-24
Reference 3: http://fasb.org/us-gaap/role/ref/legacyRef
-Topic 230
-SubTopic 10
-Name Accounting Standards Codification
-Section 45
-Paragraph 25
-Publisher FASB
-URI https://asc.fasb.org//1943274/2147482740/230-10-45-25
| Name: |
us-gaap_NetCashProvidedByUsedInOperatingActivities |
| Namespace Prefix: |
us-gaap_ |
| Data Type: |
xbrli:monetaryItemType |
| Balance Type: |
na |
| Period Type: |
duration |
|
| X |
- DefinitionAmount of expense or loss included in net income that result in no cash flow, classified as other. Reference 1: http://fasb.org/us-gaap/role/ref/legacyRef
-Topic 230
-SubTopic 10
-Name Accounting Standards Codification
-Section 45
-Paragraph 28
-Publisher FASB
-URI https://asc.fasb.org//1943274/2147482740/230-10-45-28
| Name: |
us-gaap_OtherNoncashExpense |
| Namespace Prefix: |
us-gaap_ |
| Data Type: |
xbrli:monetaryItemType |
| Balance Type: |
debit |
| Period Type: |
duration |
|
| X |
- DefinitionThe cash outflow for cost incurred directly with the issuance of an equity security. Reference 1: http://fasb.org/us-gaap/role/ref/legacyRef
-Name Accounting Standards Codification
-Topic 230
-SubTopic 10
-Section 45
-Paragraph 15
-Publisher FASB
-URI https://asc.fasb.org//1943274/2147482740/230-10-45-15
| Name: |
us-gaap_PaymentsOfStockIssuanceCosts |
| Namespace Prefix: |
us-gaap_ |
| Data Type: |
xbrli:monetaryItemType |
| Balance Type: |
credit |
| Period Type: |
duration |
|
| X |
- DefinitionThe cash outflow to acquire asset without physical form usually arising from contractual or other legal rights, excluding goodwill. Reference 1: http://fasb.org/us-gaap/role/ref/legacyRef
-Topic 230
-SubTopic 10
-Name Accounting Standards Codification
-Section 45
-Paragraph 13
-Subparagraph (c)
-Publisher FASB
-URI https://asc.fasb.org//1943274/2147482740/230-10-45-13
| Name: |
us-gaap_PaymentsToAcquireIntangibleAssets |
| Namespace Prefix: |
us-gaap_ |
| Data Type: |
xbrli:monetaryItemType |
| Balance Type: |
credit |
| Period Type: |
duration |
|
| X |
- DefinitionThe cash outflow associated with the acquisition of long-lived, physical assets that are used in the normal conduct of business to produce goods and services and not intended for resale; includes cash outflows to pay for construction of self-constructed assets. Reference 1: http://fasb.org/us-gaap/role/ref/legacyRef
-Topic 230
-SubTopic 10
-Name Accounting Standards Codification
-Section 45
-Paragraph 13
-Subparagraph (c)
-Publisher FASB
-URI https://asc.fasb.org//1943274/2147482740/230-10-45-13
| Name: |
us-gaap_PaymentsToAcquirePropertyPlantAndEquipment |
| Namespace Prefix: |
us-gaap_ |
| Data Type: |
xbrli:monetaryItemType |
| Balance Type: |
credit |
| Period Type: |
duration |
|
| X |
- DefinitionThe cash inflow from the additional capital contribution to the entity. Reference 1: http://fasb.org/us-gaap/role/ref/legacyRef
-Name Accounting Standards Codification
-Section 45
-Paragraph 14
-Subparagraph (a)
-SubTopic 10
-Topic 230
-Publisher FASB
-URI https://asc.fasb.org//1943274/2147482740/230-10-45-14
| Name: |
us-gaap_ProceedsFromIssuanceOfCommonStock |
| Namespace Prefix: |
us-gaap_ |
| Data Type: |
xbrli:monetaryItemType |
| Balance Type: |
debit |
| Period Type: |
duration |
|
| X |
- DefinitionThe cash inflow associated with the amount received from holders exercising their stock warrants. Reference 1: http://www.xbrl.org/2009/role/commonPracticeRef
-Topic 230
-SubTopic 10
-Name Accounting Standards Codification
-Section 45
-Paragraph 14
-Subparagraph (a)
-Publisher FASB
-URI https://asc.fasb.org//1943274/2147482740/230-10-45-14
| Name: |
us-gaap_ProceedsFromWarrantExercises |
| Namespace Prefix: |
us-gaap_ |
| Data Type: |
xbrli:monetaryItemType |
| Balance Type: |
debit |
| Period Type: |
duration |
|
| X |
- DefinitionThe consolidated profit or loss for the period, net of income taxes, including the portion attributable to the noncontrolling interest. Reference 1: http://www.xbrl.org/2003/role/disclosureRef
-Topic 235
-SubTopic 10
-Name Accounting Standards Codification
-Section S99
-Paragraph 1
-Subparagraph (SX 210.4-08(g)(1)(ii))
-Publisher FASB
-URI https://asc.fasb.org//1943274/2147480678/235-10-S99-1
Reference 2: http://www.xbrl.org/2003/role/disclosureRef
-Topic 323
-SubTopic 10
-Name Accounting Standards Codification
-Section 50
-Paragraph 3
-Subparagraph (c)
-Publisher FASB
-URI https://asc.fasb.org//1943274/2147481687/323-10-50-3
Reference 3: http://www.xbrl.org/2003/role/disclosureRef
-Topic 825
-SubTopic 10
-Name Accounting Standards Codification
-Section 50
-Paragraph 28
-Subparagraph (f)
-Publisher FASB
-URI https://asc.fasb.org//1943274/2147482907/825-10-50-28
Reference 4: http://www.xbrl.org/2003/role/disclosureRef
-Topic 250
-SubTopic 10
-Name Accounting Standards Codification
-Section 50
-Paragraph 1
-Subparagraph (b)(2)
-Publisher FASB
-URI https://asc.fasb.org//1943274/2147483443/250-10-50-1
Reference 5: http://www.xbrl.org/2003/role/disclosureRef
-Topic 815
-SubTopic 40
-Name Accounting Standards Codification
-Section 65
-Paragraph 1
-Subparagraph (f)
-Publisher FASB
-URI https://asc.fasb.org//1943274/2147480175/815-40-65-1
Reference 6: http://www.xbrl.org/2003/role/disclosureRef
-Topic 250
-SubTopic 10
-Name Accounting Standards Codification
-Section 50
-Paragraph 8
-Publisher FASB
-URI https://asc.fasb.org//1943274/2147483443/250-10-50-8
Reference 7: http://www.xbrl.org/2003/role/disclosureRef
-Topic 250
-SubTopic 10
-Name Accounting Standards Codification
-Section 50
-Paragraph 9
-Publisher FASB
-URI https://asc.fasb.org//1943274/2147483443/250-10-50-9
Reference 8: http://www.xbrl.org/2003/role/exampleRef
-Topic 946
-SubTopic 830
-Name Accounting Standards Codification
-Section 55
-Paragraph 11
-Publisher FASB
-URI https://asc.fasb.org//1943274/2147480167/946-830-55-11
Reference 9: http://www.xbrl.org/2003/role/disclosureRef
-Topic 946
-SubTopic 205
-Name Accounting Standards Codification
-Section 45
-Paragraph 3
-Subparagraph (a)
-Publisher FASB
-URI https://asc.fasb.org//1943274/2147480767/946-205-45-3
Reference 10: http://www.xbrl.org/2003/role/disclosureRef
-Topic 946
-SubTopic 220
-Name Accounting Standards Codification
-Section 45
-Paragraph 7
-Publisher FASB
-URI https://asc.fasb.org//1943274/2147483581/946-220-45-7
Reference 11: http://www.xbrl.org/2003/role/disclosureRef
-Topic 944
-SubTopic 220
-Name Accounting Standards Codification
-Section S99
-Paragraph 1
-Subparagraph (SX 210.7-04(16))
-Publisher FASB
-URI https://asc.fasb.org//1943274/2147483586/944-220-S99-1
Reference 12: http://www.xbrl.org/2003/role/disclosureRef
-Topic 280
-SubTopic 10
-Name Accounting Standards Codification
-Section 50
-Paragraph 22
-Publisher FASB
-URI https://asc.fasb.org//1943274/2147482810/280-10-50-22
Reference 13: http://www.xbrl.org/2003/role/disclosureRef
-Topic 946
-SubTopic 220
-Name Accounting Standards Codification
-Section S99
-Paragraph 1
-Subparagraph (SX 210.6-07(9))
-Publisher FASB
-URI https://asc.fasb.org//1943274/2147483575/946-220-S99-1
Reference 14: http://www.xbrl.org/2003/role/disclosureRef
-Topic 946
-SubTopic 220
-Name Accounting Standards Codification
-Section S99
-Paragraph 3
-Subparagraph (SX 210.6-09(1)(d))
-Publisher FASB
-URI https://asc.fasb.org//1943274/2147483575/946-220-S99-3
Reference 15: http://www.xbrl.org/2003/role/disclosureRef
-Topic 810
-SubTopic 10
-Name Accounting Standards Codification
-Section 45
-Paragraph 19
-Publisher FASB
-URI https://asc.fasb.org//1943274/2147481231/810-10-45-19
Reference 16: http://www.xbrl.org/2009/role/commonPracticeRef
-Topic 220
-SubTopic 10
-Name Accounting Standards Codification
-Section 50
-Paragraph 6
-Publisher FASB
-URI https://asc.fasb.org//1943274/2147482765/220-10-50-6
Reference 17: http://www.xbrl.org/2003/role/disclosureRef
-Topic 470
-SubTopic 10
-Name Accounting Standards Codification
-Section S99
-Paragraph 1A
-Subparagraph (SX 210.13-01(a)(4)(i))
-Publisher FASB
-URI https://asc.fasb.org//1943274/2147480097/470-10-S99-1A
Reference 18: http://www.xbrl.org/2009/role/commonPracticeRef
-Topic 470
-SubTopic 10
-Name Accounting Standards Codification
-Section S99
-Paragraph 1A
-Subparagraph (SX 210.13-01(a)(4)(ii))
-Publisher FASB
-URI https://asc.fasb.org//1943274/2147480097/470-10-S99-1A
Reference 19: http://www.xbrl.org/2003/role/disclosureRef
-Topic 470
-SubTopic 10
-Name Accounting Standards Codification
-Section S99
-Paragraph 1A
-Subparagraph (SX 210.13-01(a)(4)(iii)(A))
-Publisher FASB
-URI https://asc.fasb.org//1943274/2147480097/470-10-S99-1A
Reference 20: http://www.xbrl.org/2003/role/disclosureRef
-Topic 470
-SubTopic 10
-Name Accounting Standards Codification
-Section S99
-Paragraph 1A
-Subparagraph (SX 210.13-01(a)(4)(iv))
-Publisher FASB
-URI https://asc.fasb.org//1943274/2147480097/470-10-S99-1A
Reference 21: http://www.xbrl.org/2003/role/disclosureRef
-Topic 470
-SubTopic 10
-Name Accounting Standards Codification
-Section S99
-Paragraph 1A
-Subparagraph (SX 210.13-01(a)(5))
-Publisher FASB
-URI https://asc.fasb.org//1943274/2147480097/470-10-S99-1A
Reference 22: http://www.xbrl.org/2003/role/disclosureRef
-Topic 470
-SubTopic 10
-Name Accounting Standards Codification
-Section S99
-Paragraph 1B
-Subparagraph (SX 210.13-02(a)(4)(i))
-Publisher FASB
-URI https://asc.fasb.org//1943274/2147480097/470-10-S99-1B
Reference 23: http://www.xbrl.org/2003/role/disclosureRef
-Topic 470
-SubTopic 10
-Name Accounting Standards Codification
-Section S99
-Paragraph 1B
-Subparagraph (SX 210.13-02(a)(4)(iii)(A))
-Publisher FASB
-URI https://asc.fasb.org//1943274/2147480097/470-10-S99-1B
Reference 24: http://www.xbrl.org/2003/role/disclosureRef
-Topic 470
-SubTopic 10
-Name Accounting Standards Codification
-Section S99
-Paragraph 1B
-Subparagraph (SX 210.13-02(a)(4)(iii)(B))
-Publisher FASB
-URI https://asc.fasb.org//1943274/2147480097/470-10-S99-1B
Reference 25: http://www.xbrl.org/2003/role/disclosureRef
-Topic 470
-SubTopic 10
-Name Accounting Standards Codification
-Section S99
-Paragraph 1B
-Subparagraph (SX 210.13-02(a)(4)(iv))
-Publisher FASB
-URI https://asc.fasb.org//1943274/2147480097/470-10-S99-1B
Reference 26: http://www.xbrl.org/2003/role/disclosureRef
-Topic 470
-SubTopic 10
-Name Accounting Standards Codification
-Section S99
-Paragraph 1B
-Subparagraph (SX 210.13-02(a)(5))
-Publisher FASB
-URI https://asc.fasb.org//1943274/2147480097/470-10-S99-1B
Reference 27: http://www.xbrl.org/2003/role/disclosureRef
-Topic 280
-SubTopic 10
-Name Accounting Standards Codification
-Section 50
-Paragraph 30
-Subparagraph (b)
-Publisher FASB
-URI https://asc.fasb.org//1943274/2147482810/280-10-50-30
Reference 28: http://www.xbrl.org/2003/role/disclosureRef
-Topic 280
-SubTopic 10
-Name Accounting Standards Codification
-Section 50
-Paragraph 32
-Subparagraph (f)
-Publisher FASB
-URI https://asc.fasb.org//1943274/2147482810/280-10-50-32
Reference 29: http://www.xbrl.org/2003/role/exampleRef
-Topic 280
-SubTopic 10
-Name Accounting Standards Codification
-Section 50
-Paragraph 31
-Publisher FASB
-URI https://asc.fasb.org//1943274/2147482810/280-10-50-31
Reference 30: http://www.xbrl.org/2003/role/disclosureRef
-Topic 280
-SubTopic 10
-Name Accounting Standards Codification
-Section 50
-Paragraph 32
-Subparagraph (c)
-Publisher FASB
-URI https://asc.fasb.org//1943274/2147482810/280-10-50-32
Reference 31: http://www.xbrl.org/2003/role/disclosureRef
-Topic 942
-SubTopic 235
-Name Accounting Standards Codification
-Section S99
-Paragraph 1
-Subparagraph (SX 210.9-05(b)(2))
-Publisher FASB
-URI https://asc.fasb.org//1943274/2147479557/942-235-S99-1
Reference 32: http://www.xbrl.org/2003/role/disclosureRef
-Topic 205
-SubTopic 20
-Name Accounting Standards Codification
-Section 50
-Paragraph 7
-Publisher FASB
-URI https://asc.fasb.org//1943274/2147483499/205-20-50-7
Reference 33: http://www.xbrl.org/2003/role/exampleRef
-Topic 810
-SubTopic 10
-Name Accounting Standards Codification
-Section 55
-Paragraph 4J
-Publisher FASB
-URI https://asc.fasb.org//1943274/2147481175/810-10-55-4J
Reference 34: http://www.xbrl.org/2003/role/exampleRef
-Topic 810
-SubTopic 10
-Name Accounting Standards Codification
-Section 55
-Paragraph 4K
-Publisher FASB
-URI https://asc.fasb.org//1943274/2147481175/810-10-55-4K
Reference 35: http://www.xbrl.org/2003/role/disclosureRef
-Topic 220
-SubTopic 10
-Name Accounting Standards Codification
-Section 45
-Paragraph 1A
-Subparagraph (a)
-Publisher FASB
-URI https://asc.fasb.org//1943274/2147482790/220-10-45-1A
Reference 36: http://www.xbrl.org/2003/role/disclosureRef
-Topic 220
-SubTopic 10
-Name Accounting Standards Codification
-Section 45
-Paragraph 1B
-Subparagraph (a)
-Publisher FASB
-URI https://asc.fasb.org//1943274/2147482790/220-10-45-1B
Reference 37: http://www.xbrl.org/2003/role/disclosureRef
-Topic 230
-SubTopic 10
-Name Accounting Standards Codification
-Section 45
-Paragraph 2
-Publisher FASB
-URI https://asc.fasb.org//1943274/2147482740/230-10-45-2
Reference 38: http://www.xbrl.org/2003/role/disclosureRef
-Topic 810
-SubTopic 10
-Name Accounting Standards Codification
-Section 50
-Paragraph 1A
-Subparagraph (a)(1)
-Publisher FASB
-URI https://asc.fasb.org//1943274/2147481203/810-10-50-1A
Reference 39: http://www.xbrl.org/2003/role/disclosureRef
-Topic 810
-SubTopic 10
-Name Accounting Standards Codification
-Section 50
-Paragraph 1A
-Subparagraph (c)(1)
-Publisher FASB
-URI https://asc.fasb.org//1943274/2147481203/810-10-50-1A
| Name: |
us-gaap_ProfitLoss |
| Namespace Prefix: |
us-gaap_ |
| Data Type: |
xbrli:monetaryItemType |
| Balance Type: |
credit |
| Period Type: |
duration |
|
| X |
- DefinitionAmount of cash outflow for short-term and long-term debt and lease obligation.
| Name: |
us-gaap_RepaymentsOfDebtAndCapitalLeaseObligations |
| Namespace Prefix: |
us-gaap_ |
| Data Type: |
xbrli:monetaryItemType |
| Balance Type: |
credit |
| Period Type: |
duration |
|
| X |
- DefinitionAmount of noncash expense for share-based payment arrangement. Reference 1: http://fasb.org/us-gaap/role/ref/legacyRef
-Name Accounting Standards Codification
-Section 45
-Paragraph 28
-Subparagraph (a)
-SubTopic 10
-Topic 230
-Publisher FASB
-URI https://asc.fasb.org//1943274/2147482740/230-10-45-28
| Name: |
us-gaap_ShareBasedCompensation |
| Namespace Prefix: |
us-gaap_ |
| Data Type: |
xbrli:monetaryItemType |
| Balance Type: |
debit |
| Period Type: |
duration |
|
| X |
- References
+ Details
| Name: |
us-gaap_StatementOfCashFlowsAbstract |
| Namespace Prefix: |
us-gaap_ |
| Data Type: |
xbrli:stringItemType |
| Balance Type: |
na |
| Period Type: |
duration |
|
v3.24.1.1.u2
BASIS OF PRESENTATION AND SUMMARY OF SIGNIFICANT ACCOUNTING POLICIES
|
6 Months Ended |
Mar. 31, 2024 |
|---|
| BASIS OF PRESENTATION AND SUMMARY OF SIGNIFICANT ACCOUNTING POLICIES |
|
| BASIS OF PRESENTATION AND SUMMARY OF SIGNIFICANT ACCOUNTING POLICIES |
A. BASIS OF PRESENTATION AND SUMMARY OF SIGNIFICANT ACCOUNTING POLICIES Basis of Presentation The accompanying condensed financial statements of CEL-SCI Corporation (the “Company”) are unaudited and certain information and footnote disclosures normally included in the annual financial statements prepared in accordance with accounting principles generally accepted in the United States of America have been omitted pursuant to the rules and regulations of the Securities and Exchange Commission. While management of the Company believes that the disclosures presented are adequate to make the information presented not misleading, these interim condensed financial statements should be read in conjunction with the financial statements and notes included in the Company’s annual report on Form 10-K for the year ended September 30, 2023. In the opinion of management, the accompanying unaudited condensed financial statements contain all adjustments (all of which are of a normal recurring nature) and disclosures necessary for a fair presentation of the Company’s financial position as of March 31, 2024 and the results of its operations for the six months then ended. The condensed balance sheet as of September 30, 2023 is derived from the September 30, 2023 audited financial statements. Due to recurring losses from operations and future liquidity needs, there is substantial doubt about the Company’s ability to continue as a going concern. The financial statements do not include any adjustments that might result from the outcome of this uncertainty. Refer to discussion in Note B. Summary of Significant Accounting Policies: Cash and Cash Equivalents – Cash and cash equivalents consist principally of unrestricted cash on deposit and short-term money market funds. The Company considers all highly liquid investments with a maturity when purchased of less than three months to be cash equivalents. Property and Equipment – Property and equipment is recorded at cost and depreciated using the straight-line method over estimated useful lives of five to seven years. Leasehold improvements are depreciated over the shorter of the estimated useful life of the asset or the term of the lease. Repairs and maintenance which do not extend the life of the asset are expensed when incurred. Property and equipment is reviewed on a quarterly basis to determine if any of the assets are impaired. Supplies used for R&D and manufacturing – Supplies are consumable items kept on hand to support the Company’s R&D and manufacturing operations. Supplies are recorded at cost and are charged to expense as they are used in operations. Patents – Patent expenditures are capitalized and amortized using the straight-line method over the shorter of the expected useful life or the legal life of the patent (17 years). In the event changes in technology or other circumstances impair the value or life of the patent, appropriate adjustments to the asset value and period of amortization are made. An impairment loss is recognized when estimated future undiscounted cash flows expected to result from the use of the asset, and from its disposition, are less than the carrying value of the asset. The amount of the impairment loss would be the difference between the estimated fair value of the asset and its carrying value. Leases – The Company accounts for contracts that convey the right to control the use of identified property, plant or equipment over a period of time in exchange for consideration as leases upon inception. The Company leases certain real estate, machinery, laboratory equipment and office equipment over varying periods. Many of these leases include an option to either renew or terminate the lease. For purposes of calculating lease liabilities, these options are included in the lease term when it is reasonably certain that the Company will exercise such options. The incremental borrowing rate utilized to calculate the lease liabilities is based on the information available at the commencement date, as most of the leases do not provide an implicit borrowing rate. Short-term leases, defined as leases with initial terms of 12 months or less, are not reflected on the balance sheet. Lease expense for such short-term leases is not material. Share-Based Compensation – Compensation cost for all share-based awards is measured at fair value as of the grant date in accordance with the provisions of ASC 718, Compensation – Stock Compensation (“ASC 718”). The fair value of stock options is calculated using the Black-Scholes option pricing model. The Black-Scholes model requires various judgmental assumptions including volatility and expected option life. The share-based compensation cost is recognized using the straight-line method as expense over the requisite service or vesting period. The Company has Incentive Stock Option Plans, Non-Qualified Stock Option Plans, Stock Compensation Plans, Stock Bonus Plans and an Incentive Stock Bonus Plan. These Plans are collectively referred to as the “Plans”. All Plans have been approved by the Company’s stockholders. The Company’s stock options are not transferable, and the actual value of the stock options that an employee may realize, if any, will depend on the excess of the market price on the date of exercise over the exercise price. For options issued with service conditions only, the Company has based its assumption for stock price volatility on the variance of daily closing prices of the Company’s stock. The risk-free interest rate assumption is based on the U.S. Treasury rate at the date of grant with the term equal to the expected life of the option. Forfeitures are accounted for when they occur. The expected term of options represents the period that options granted are expected to be outstanding and has been determined based on an analysis of historical exercise behavior. If any of the assumptions used in the Black-Scholes model change significantly, share-based compensation expense for new awards may differ materially in the future from that recorded in the current period. Restricted stock granted under the Incentive Stock Bonus Plan and options granted under the Non-Qualified Stock Option Plans are subject to service, performance and market conditions and meet the classification of equity awards. These awards were measured at fair value on the grant dates using a Monte Carlo simulation for issuances where the attainment of performance criteria is uncertain. The total compensation cost will be expensed over the estimated requisite service period. Research and Development Costs – Research and development costs are expensed as incurred. Management accrues Clinical Research Organization (“CRO”) expenses and clinical trial study expenses based on services performed and relies on the CROs to provide estimates of those costs applicable to the completion stage of a study. Estimated accrued CRO costs are subject to revisions as such studies progress to completion. The Company records revisions to estimated expense in the period in which the facts that give rise to the revision become known. Net Loss Per Common Share – The Company calculates net loss per common share in accordance with ASC 260, Earnings Per Share. Basic and diluted net loss per common share was determined by dividing net loss applicable to common shareholders by the weighted average number of common shares outstanding during the period. The Company’s potentially dilutive shares, which include outstanding common stock options, unvested restricted stock and common stock warrants, have not been included in the computation of diluted net loss per share for all periods as the result would be anti-dilutive. Income Taxes – The Company accounts for income taxes in accordance with the provisions of ASC 740, Income Taxes, on a tax jurisdiction basis. Deferred tax assets and liabilities are recognized for future tax consequences attributable to differences between the financial statement carrying amounts of existing assets and liabilities and their respective tax bases and operating and tax loss carryforwards. Deferred tax assets and liabilities are measured using enacted tax rates expected to apply to taxable income in the years in which those temporary differences are expected to be recovered or settled. The effect on deferred tax assets and liabilities of a change in tax rates is recognized in income in the period that includes the enactment date. The Company records a valuation allowance to reduce the deferred tax assets to the amount that is more likely than not to be recognized. A full valuation allowance was recorded against the deferred tax assets as of March 31, 2024 and September 30, 2023. Impairment of long-lived assets – CEL-SCI’s fixed assets are made up of leasehold improvements, furniture, and equipment. ASC 360-10 requires that a long-lived asset group be reviewed for impairment only when events or changes in circumstances indicate that the carrying amount of the long-lived asset (group) might not be recoverable. CEL-SCI’s recurring losses are a triggering event that could indicate impairment of long-lived assets such as fixed assets. CEL-SCI reviews these assets to determine if events or changes in circumstances indicate the existence of impairment. If indicators of impairment exist, the Company tests for recoverability, then, if necessary, measures and records the impairment. The amount of the impairment loss would be the amount by which the carrying amount of the asset (group) exceeds its fair value. Use of Estimates – The preparation of financial statements in conformity with U.S. GAAP requires management to make estimates and assumptions that affect the amounts reported in the financial statements and the accompanying disclosures. These estimates are based on management’s best knowledge of current events and actions the Company may undertake in the future. Estimates are used in accounting for, among other items, inventory obsolescence, accruals, stock options, useful lives for depreciation and amortization of long-lived assets, right of use assets and lease liabilities, deferred tax assets and the related valuation allowance. Actual results could differ from estimates, although management does not generally believe such differences would materially affect the financial statements in any given year. Additionally, in calculating the right of use assets and lease liabilities, estimates and assumptions were used to determine the incremental borrowing rates and the expected lease terms. The Company considers the estimates used in valuing the stock options and the lease assets and liabilities to be significant. Recently Adopted Accounting Standards In June 2016, the Financial Accounting Standards Board (“FASB”) issued Accounting Standards Update No. 2016-13, Financial Instruments – Credit Losses (Topic 326): Measurement of Credit Losses on Financial Instruments (“ASU 2016-13”). ASU 2016-13 requires a financial asset (or a group of financial assets) measured at amortized cost basis to be presented at the net amount expected to be collected. The amendments in ASU 2016-13 replace the incurred loss impairment methodology in current U.S. GAAP with a methodology that reflects expected credit losses and requires consideration of a broader range of reasonable and supportable information. ASU 2016-13 was effective for SEC filers, excluding smaller reporting companies, for fiscal years beginning after December 15, 2019, including interim periods within those fiscal years. As a smaller reporting company, the Company was permitted to adopt the new standard for fiscal years beginning after December 15, 2022, including interim periods within those fiscal years. Effective October 1, 2023, the Company adopted ASU 2016-13 using a modified retrospective transition method. The adoption of ASU 2016-13 had no impact on the Company’s financial position, results of operations, or cash flows. New Accounting Pronouncements – The Company has considered all recently issued accounting pronouncements and does not believe the adoption of such pronouncements will have a material impact on its financial statements.
|
| X |
- DefinitionThe entire disclosure for the basis of presentation and significant accounting policies concepts. Basis of presentation describes the underlying basis used to prepare the financial statements (for example, US Generally Accepted Accounting Principles, Other Comprehensive Basis of Accounting, IFRS). Accounting policies describe all significant accounting policies of the reporting entity. Reference 1: http://fasb.org/us-gaap/role/ref/legacyRef
-Topic 235
-Name Accounting Standards Codification
-Publisher FASB
-URI https://asc.fasb.org//235/tableOfContent
| Name: |
us-gaap_BasisOfPresentationAndSignificantAccountingPoliciesTextBlock |
| Namespace Prefix: |
us-gaap_ |
| Data Type: |
dtr-types:textBlockItemType |
| Balance Type: |
na |
| Period Type: |
duration |
|
| X |
- References
+ Details
| Name: |
us-gaap_OrganizationConsolidationAndPresentationOfFinancialStatementsAbstract |
| Namespace Prefix: |
us-gaap_ |
| Data Type: |
xbrli:stringItemType |
| Balance Type: |
na |
| Period Type: |
duration |
|
v3.24.1.1.u2
LIQUIDITY
|
6 Months Ended |
Mar. 31, 2024 |
|---|
| LIQUIDITY |
|
| LIQUIDITY |
B. LIQUIDITY The Company has incurred significant costs since its inception for the acquisition of certain proprietary technology and scientific knowledge relating to the human immunological defense system, patent applications, research and development, administrative costs, construction and expansion of manufacturing and laboratory facilities and conducting clinical trials. The Company has funded such costs primarily with proceeds from loans and the public and private sale of its securities. The Company will be required to raise additional capital or find additional long-term financing to continue with its efforts to bring Multikine, the Company’s lead investigational therapy, to market. The ability to raise capital may be dependent upon market conditions that are outside the control of the Company. The ability of the Company to obtain approval from any regulatory agency for the sale of products to be developed on a commercial basis is uncertain. Ultimately, the Company must complete the development of its products, obtain the appropriate regulatory approvals and obtain sufficient revenues to support its cost structure. To finance the Company through marketing approval, the Company plans to raise additional capital in the form of corporate partnerships, and debt and/or equity financings. The Company believes that it will be able to obtain additional financing because it has done so consistently in the past and because Multikine showed great survival benefit in the Phase 3 study in one of the two treatment arms for advanced primary head and neck cancer. However, there can be no assurance that the Company will be successful in raising additional funds on a timely basis or that the funds will be available to the Company on acceptable terms or at all. If the Company does not raise the necessary amounts of money, it may have to curtail its operations until such time as it is able to raise the required funding. Due to the Company’s recurring losses from operations and future liquidity needs, there is substantial doubt about the Company’s ability to continue as a going concern. The financial statements do not include any adjustments that might result from the outcome of this uncertainty.
|
| X |
- References
+ Details
| Name: |
cvm_LIQUIDITYAbstract |
| Namespace Prefix: |
cvm_ |
| Data Type: |
xbrli:stringItemType |
| Balance Type: |
na |
| Period Type: |
duration |
|
| X |
- References
+ Details
| Name: |
cvm_LiquidityDisclosureTextBlock |
| Namespace Prefix: |
cvm_ |
| Data Type: |
nonnum:textBlockItemType |
| Balance Type: |
na |
| Period Type: |
duration |
|
v3.24.1.1.u2
STOCKHOLDERS EQUITY
|
6 Months Ended |
Mar. 31, 2024 |
|---|
| STOCKHOLDERS EQUITY |
|
| STOCKHOLDERS' EQUITY |
C. STOCKHOLDERS’ EQUITY Proceeds from the Sale of Common Stock In February 2024, the Company sold 3,875,000 shares of common stock at a public offering price of $2.00 per share and received proceeds of approximately $7.0 million, net of issuance costs of approximately $0.7 million. In November 2023, the Company sold 2,490,000 shares of common stock at a public offering price of $2.00 per share and received proceeds of approximately $4.5 million, net of issuance costs of approximately $0.5 million. Equity Compensation Underlying share information for equity compensation plans as of March 31, 2024 is as follows: Name of Plan | | Total Shares Reserved Under Plans | | Incentive Stock Option Plans | | | 138,400 | | Non-Qualified Stock Option Plans | | | 15,787,200 | | Stock Bonus Plans | | | 1,283,760 | | Stock Compensation Plans | | | 634,000 | | Incentive Stock Bonus Plan | | | 640,000 | |
Stock option activity: | | Six Months Ended March 31, | | | | 2024 | | | 2023 | | Options granted | | | 3,000 | | | | 4,500 | | Options exercised | | | - | | | | - | | Options forfeited | | | 53,000 | | | | 122,332 | | Options expired | | | 27,035 | | | | 45,404 | |
| | Three Months Ended March 31, | | | | 2024 | | | 2023 | | Options granted | | | 3,000 | | | | 2,000 | | Options exercised | | | - | | | | - | | Options forfeited | | | 42,000 | | | | 25,500 | | Options expired | | | 27,035 | | | | 4 | |
On March 1, 2024, the Company accelerated the vesting of 234,332 stock options issued to directors to vest on April 19, 2024. The Company concluded that the change in vesting of the options should be treated as a modification in accordance with ASC 718. As such, the Company revalued the options as of March 1, 2024 (the modification date) and subtracted any compensation cost already recognized prior to the modification date. This resulted in remaining compensation cost of approximately $260,000 that will be amortized on a straight-line basis over the remaining service period. Share-Based Compensation Expense: | | Six Months Ended March 31, | | | | 2024 | | | 2023 | | Employees | | $ | 2,816,449 | | | $ | 3,436,119 | | Non-employees | | $ | 370,163 | | | $ | 285,722 | |
| | Three Months Ended March 31, | | | | 2024 | | | 2023 | | Employees | | $ | 1,432,540 | | | $ | 1,743,288 | | Non-employees | | $ | 151,777 | | | $ | 136,864 | |
Employee compensation expense includes the expense related to options and restricted stock that is expensed over the vesting periods. Non-employee expense includes the expense related to options and stock issued to consultants expensed over the period of the related service contracts. Warrants and Non-Employee Options The following chart represents the warrants and non-employee options outstanding at March 31, 2024: Warrant/ Options | | Issue Date | | Shares Issuable upon Exercise of Warrants/ Options | | | Exercise Price | | | Expiration Date | | Series N | | 8/18/2008 | | | 85,339 | | | $ | 3.00 | | | 8/18/2024 | | Series UU | | 6/11/2018 | | | 93,603 | | | $ | 2.80 | | | 6/30/2024 | | Series X | | 1/13/2016 | | | 120,000 | | | $ | 9.25 | | | 7/13/2024 | | Series Y | | 2/15/2016 | | | 26,000 | | | $ | 12.00 | | | 8/15/2024 | | Series MM | | 6/22/2017 | | | 333,432 | | | $ | 1.86 | | | 6/22/2024 | | Series NN | | 7/24/2017 | | | 200,087 | | | $ | 2.52 | | | 7/24/2024 | | Series RR | | 10/30/2017 | | | 234,009 | | | $ | 1.65 | | | 10/30/2024 | | Consultant Options | | 7/28/2017 – 9/2/2023 | | | 110,000 | | | $ | 1.39 - $2.18 | | | 7/27/2027 - 9/1/2028 | |
1. Equity Warrants Changes in Equity Warrants No warrants recorded as equity were exercised during the six months ended March 31, 2024. The following warrants recorded as equity were exercised during the six months ended March 31, 2023. Warrants | | Warrants Exercised | | | Exercise Price | | | Proceeds | | Series RR | | | 17,752 | | | $ | 1.65 | | | $ | 29,291 | | Series SS | | | 200,000 | | | $ | 2.09 | | | | 418,000 | | | | | 217,752 | | | | | | | $ | 447,291 | |
No warrants recorded as equity expired during the six and three months ended March 31 ,2024. On February 5, 2023, 600 Series TT warrants, with an exercise price of $2.24, expired. No warrants recorded as equity were extended during the six and three months ended March 31, 2024. On October 28, 2022, the expiration date of the Series RR warrants was extended two years from October 30, 2022 to October 30, 2024. The incremental cost of this extension was approximately $172,000, which was recorded as a deemed dividend in the financial statements for the three months ended December 31, 2022. The Series RR warrants are held by Geert Kersten, Patricia Prichep (current Officers of the Company) and the de Clara Trust, of which the Company’s CEO, Geert Kersten, is a beneficiary. 2. Options and Shares Issued to Consultants During the six months ended March 31, 2024 and 2023, the Company issued 251,317 and 78,798 shares, respectively, of restricted common stock to consultants for services. The weighted average grant date fair value of the shares issued to consultants was $1.99 and $2.47 during the six months ended March 31, 2024 and 2023, respectively. During the three months ended March 31, 2024 and 2023, the Company issued 162,744 and 38,562 shares, respectively, of restricted common stock to consultants for services. The weighted average grant date fair value of the shares issued to consultants was $2.22 and $2.42 during the three months ended March 31, 2024 and 2023, respectively. No options were issued to a consultant during the six months ended March 31, 2024. During the six months ended March 31, 2023, 5,000 options with an exercise price of $11.61 issued to a consultant expired. During the six months ended March 31, 2024 and 2023, the Company recorded total expense of approximately $370,000 and $285,000, respectively, relating to the share-based compensation under various consulting agreements. During the three months ended March 31, 2024 and 2023, the Company recorded total expense of approximately $152,000 and $136,000, respectively, relating to the share-based compensation under these consulting agreements. On March 31, 2024 and September 30, 2023, consulting fees of approximately $351,000 and $205,000, respectively, are included in current assets as prepaid expenses and will be amortized over the remaining service periods.
|
| X |
- References
+ Details
| Name: |
us-gaap_EquityAbstract |
| Namespace Prefix: |
us-gaap_ |
| Data Type: |
xbrli:stringItemType |
| Balance Type: |
na |
| Period Type: |
duration |
|
| X |
- DefinitionThe entire disclosure for equity. Reference 1: http://www.xbrl.org/2003/role/disclosureRef
-Topic 505
-SubTopic 10
-Name Accounting Standards Codification
-Section 50
-Paragraph 13
-Subparagraph (b)
-Publisher FASB
-URI https://asc.fasb.org//1943274/2147481112/505-10-50-13
Reference 2: http://www.xbrl.org/2003/role/disclosureRef
-Topic 505
-SubTopic 10
-Name Accounting Standards Codification
-Section 50
-Paragraph 13
-Subparagraph (h)
-Publisher FASB
-URI https://asc.fasb.org//1943274/2147481112/505-10-50-13
Reference 3: http://www.xbrl.org/2003/role/disclosureRef
-Topic 505
-SubTopic 10
-Name Accounting Standards Codification
-Section 50
-Paragraph 14
-Subparagraph (b)
-Publisher FASB
-URI https://asc.fasb.org//1943274/2147481112/505-10-50-14
Reference 4: http://www.xbrl.org/2003/role/disclosureRef
-Topic 946
-SubTopic 235
-Name Accounting Standards Codification
-Section 50
-Paragraph 2
-Subparagraph (a)
-Publisher FASB
-URI https://asc.fasb.org//1943274/2147481062/946-235-50-2
Reference 5: http://www.xbrl.org/2003/role/disclosureRef
-Topic 946
-SubTopic 235
-Name Accounting Standards Codification
-Section 50
-Paragraph 2
-Subparagraph (d)
-Publisher FASB
-URI https://asc.fasb.org//1943274/2147481062/946-235-50-2
Reference 6: http://www.xbrl.org/2003/role/disclosureRef
-Topic 946
-SubTopic 505
-Name Accounting Standards Codification
-Section 50
-Paragraph 6
-Publisher FASB
-URI https://asc.fasb.org//1943274/2147481004/946-505-50-6
Reference 7: http://www.xbrl.org/2003/role/disclosureRef
-Topic 815
-SubTopic 40
-Name Accounting Standards Codification
-Section 50
-Paragraph 6
-Subparagraph (a)
-Publisher FASB
-URI https://asc.fasb.org//1943274/2147480237/815-40-50-6
Reference 8: http://www.xbrl.org/2003/role/disclosureRef
-Topic 505
-SubTopic 10
-Name Accounting Standards Codification
-Section S99
-Paragraph 1
-Subparagraph (SX 210.3-04)
-Publisher FASB
-URI https://asc.fasb.org//1943274/2147480008/505-10-S99-1
Reference 9: http://www.xbrl.org/2003/role/disclosureRef
-Topic 235
-SubTopic 10
-Name Accounting Standards Codification
-Section S99
-Paragraph 1
-Subparagraph (SX 210.4-08(e)(1))
-Publisher FASB
-URI https://asc.fasb.org//1943274/2147480678/235-10-S99-1
Reference 10: http://fasb.org/us-gaap/role/ref/legacyRef
-Topic 505
-Name Accounting Standards Codification
-Publisher FASB
-URI https://asc.fasb.org//505/tableOfContent
Reference 11: http://www.xbrl.org/2003/role/disclosureRef
-Topic 505
-SubTopic 10
-Name Accounting Standards Codification
-Section 50
-Paragraph 13
-Publisher FASB
-URI https://asc.fasb.org//1943274/2147481112/505-10-50-13
Reference 12: http://www.xbrl.org/2003/role/disclosureRef
-Topic 505
-SubTopic 10
-Name Accounting Standards Codification
-Section 50
-Paragraph 13
-Subparagraph (g)
-Publisher FASB
-URI https://asc.fasb.org//1943274/2147481112/505-10-50-13
Reference 13: http://www.xbrl.org/2003/role/disclosureRef
-Topic 505
-SubTopic 10
-Name Accounting Standards Codification
-Section 50
-Paragraph 13
-Subparagraph (i)
-Publisher FASB
-URI https://asc.fasb.org//1943274/2147481112/505-10-50-13
Reference 14: http://www.xbrl.org/2003/role/disclosureRef
-Topic 505
-SubTopic 10
-Name Accounting Standards Codification
-Section 50
-Paragraph 14
-Subparagraph (a)
-Publisher FASB
-URI https://asc.fasb.org//1943274/2147481112/505-10-50-14
Reference 15: http://www.xbrl.org/2003/role/disclosureRef
-Topic 505
-SubTopic 10
-Name Accounting Standards Codification
-Section 50
-Paragraph 14
-Subparagraph (c)
-Publisher FASB
-URI https://asc.fasb.org//1943274/2147481112/505-10-50-14
Reference 16: http://www.xbrl.org/2003/role/disclosureRef
-Topic 505
-SubTopic 10
-Name Accounting Standards Codification
-Section 50
-Paragraph 16
-Subparagraph (b)
-Publisher FASB
-URI https://asc.fasb.org//1943274/2147481112/505-10-50-16
Reference 17: http://www.xbrl.org/2003/role/disclosureRef
-Topic 505
-SubTopic 10
-Name Accounting Standards Codification
-Section 50
-Paragraph 18
-Subparagraph (a)
-Publisher FASB
-URI https://asc.fasb.org//1943274/2147481112/505-10-50-18
Reference 18: http://www.xbrl.org/2003/role/disclosureRef
-Topic 505
-SubTopic 10
-Name Accounting Standards Codification
-Section 50
-Paragraph 18
-Subparagraph (b)
-Publisher FASB
-URI https://asc.fasb.org//1943274/2147481112/505-10-50-18
Reference 19: http://www.xbrl.org/2003/role/disclosureRef
-Topic 505
-SubTopic 10
-Name Accounting Standards Codification
-Section 50
-Paragraph 18
-Subparagraph (d)
-Publisher FASB
-URI https://asc.fasb.org//1943274/2147481112/505-10-50-18
| Name: |
us-gaap_StockholdersEquityNoteDisclosureTextBlock |
| Namespace Prefix: |
us-gaap_ |
| Data Type: |
dtr-types:textBlockItemType |
| Balance Type: |
na |
| Period Type: |
duration |
|
v3.24.1.1.u2
RELATED PARTY TRANSACTIONS
|
6 Months Ended |
Mar. 31, 2024 |
|---|
| RELATED PARTY TRANSACTIONS |
|
| RELATED PARTY TRANSACTIONS |
D. RELATED PARTY TRANSACTIONS During the six and three months ended March 31, 2024, no restricted shares of the Company’s common stock were purchased by related parties. On October 28, 2022, the expiration date of the Series RR warrants was extended two years from October 30, 2022 to October 30, 2024 (Note C). The incremental cost of this extension was approximately $172,000, which was recorded as a deemed dividend. The Series RR warrants are held by Geert Kersten, Patricia Prichep (current officers of the Company) and the de Clara Trust, of which the Company’s CEO, Geert Kersten, is a beneficiary.
|
| X |
- DefinitionThe entire disclosure for related party transactions. Examples of related party transactions include transactions between (a) a parent company and its subsidiary; (b) subsidiaries of a common parent; (c) and entity and its principal owners; and (d) affiliates. Reference 1: http://www.xbrl.org/2003/role/disclosureRef
-Topic 946
-SubTopic 20
-Name Accounting Standards Codification
-Section 50
-Paragraph 2
-Publisher FASB
-URI https://asc.fasb.org//1943274/2147480990/946-20-50-2
Reference 2: http://www.xbrl.org/2003/role/disclosureRef
-Topic 946
-SubTopic 20
-Name Accounting Standards Codification
-Section 50
-Paragraph 5
-Publisher FASB
-URI https://asc.fasb.org//1943274/2147480990/946-20-50-5
Reference 3: http://www.xbrl.org/2003/role/disclosureRef
-Topic 946
-SubTopic 20
-Name Accounting Standards Codification
-Section 50
-Paragraph 6
-Publisher FASB
-URI https://asc.fasb.org//1943274/2147480990/946-20-50-6
Reference 4: http://www.xbrl.org/2003/role/disclosureRef
-Topic 946
-SubTopic 235
-Name Accounting Standards Codification
-Section 50
-Paragraph 2
-Subparagraph (c)
-Publisher FASB
-URI https://asc.fasb.org//1943274/2147481062/946-235-50-2
Reference 5: http://www.xbrl.org/2003/role/disclosureRef
-Topic 946
-SubTopic 235
-Name Accounting Standards Codification
-Section 50
-Paragraph 2
-Subparagraph (e)
-Publisher FASB
-URI https://asc.fasb.org//1943274/2147481062/946-235-50-2
Reference 6: http://www.xbrl.org/2003/role/disclosureRef
-Topic 850
-SubTopic 10
-Name Accounting Standards Codification
-Section 50
-Paragraph 1
-Subparagraph (d)
-Publisher FASB
-URI https://asc.fasb.org//1943274/2147483326/850-10-50-1
Reference 7: http://www.xbrl.org/2003/role/disclosureRef
-Topic 946
-SubTopic 220
-Name Accounting Standards Codification
-Section S99
-Paragraph 1
-Subparagraph (SX 210.6-07(2)(g)(3))
-Publisher FASB
-URI https://asc.fasb.org//1943274/2147483575/946-220-S99-1
Reference 8: http://www.xbrl.org/2003/role/disclosureRef
-Topic 946
-SubTopic 220
-Name Accounting Standards Codification
-Section S99
-Paragraph 1
-Subparagraph (SX 210.6-07(2)(c))
-Publisher FASB
-URI https://asc.fasb.org//1943274/2147483575/946-220-S99-1
Reference 9: http://www.xbrl.org/2003/role/disclosureRef
-Topic 946
-SubTopic 220
-Name Accounting Standards Codification
-Section S99
-Paragraph 1
-Subparagraph (SX 210.6-07(2)(e))
-Publisher FASB
-URI https://asc.fasb.org//1943274/2147483575/946-220-S99-1
Reference 10: http://www.xbrl.org/2003/role/disclosureRef
-Topic 850
-Name Accounting Standards Codification
-Publisher FASB
-URI https://asc.fasb.org//850/tableOfContent
Reference 11: http://www.xbrl.org/2003/role/disclosureRef
-Topic 850
-SubTopic 10
-Name Accounting Standards Codification
-Section 50
-Paragraph 6
-Publisher FASB
-URI https://asc.fasb.org//1943274/2147483326/850-10-50-6
Reference 12: http://www.xbrl.org/2003/role/disclosureRef
-Topic 850
-SubTopic 10
-Name Accounting Standards Codification
-Section 50
-Paragraph 1
-Subparagraph (a)
-Publisher FASB
-URI https://asc.fasb.org//1943274/2147483326/850-10-50-1
Reference 13: http://www.xbrl.org/2003/role/disclosureRef
-Topic 850
-SubTopic 10
-Name Accounting Standards Codification
-Section 50
-Paragraph 1
-Subparagraph (b)
-Publisher FASB
-URI https://asc.fasb.org//1943274/2147483326/850-10-50-1
| Name: |
us-gaap_RelatedPartyTransactionsDisclosureTextBlock |
| Namespace Prefix: |
us-gaap_ |
| Data Type: |
dtr-types:textBlockItemType |
| Balance Type: |
na |
| Period Type: |
duration |
|
v3.24.1.1.u2
COMMITMENTS AND CONTINGENCIES
|
6 Months Ended |
Mar. 31, 2024 |
|---|
| COMMITMENTS AND CONTINGENCIES |
|
| COMMITMENTS AND CONTINGENCIES |
E. COMMITMENTS AND CONTINGENCIES Clinical Research Agreement Under co-development and revenue sharing agreements with Ergomed, Ergomed agreed to contribute up to $12 million towards the Company’s Phase 3 Clinical Trial in the form of discounted clinical services in exchange for a single digit percentage of milestone and royalty payments, up to a specific maximum amount. The Company accounted for the co-development and revenue sharing agreements in accordance with ASC 808, Collaborative Arrangements. The Company determined the payments to Ergomed are within the scope of ASC 730, Research and Development. Therefore, the Company records the discount on the clinical services as a credit to research and development expense on its statements of operations. Since the inception of the agreement with Ergomed, the Company has incurred research and development expenses of approximately $35.8 million for Ergomed’s services. This amount is net of Ergomed’s discount of approximately $11.9 million. During the six months ended March 31, 2024 and 2023, the Company recorded, net of Ergomed’s discount, approximately $0.1 million for each quarter as research and development expense related to Ergomed’s services. During the three months ended March 31, 2024 and 2023, the Company recorded, net of Ergomed’s discount, less than $0.1 million for each quarter as research and development expense related to Ergomed’s services. Lease Agreements The Company leases a manufacturing facility near Baltimore, Maryland (the San Tomas lease). The building was remodeled in accordance with the Company’s specifications so that it can be used by the Company to manufacture Multikine for the Company’s Phase 3 clinical trial and sales of the drug if approved by any regulatory agency. The lease is for a term of twenty years and requires annual base rent to escalate each year at 3%. The Company is required to pay all real estate and personal property taxes, insurance premiums, maintenance expenses, repair costs and utilities. The lease allows the Company, at its election, to extend the lease for two ten-year periods or to purchase the building at the end of the 20-year lease, which expires in October 2028. The renewal options are not included in the calculation of the right of use asset and lease liability because exercise of those options is not reasonably certain. The San Tomas lease is classified as a finance lease on the Company’s balance sheet, as well as several other smaller finance leases for office equipment. The finance right of use assets are being depreciated using the straight-line method over the underlying lease terms. Total cash paid related to finance leases during the six months ended March 31, 2024 and 2023 was approximately $1.3 million for both periods, of which approximately $0.5 and $0.6 million was for interest, respectively, in each six-month period. As of March 31, 2024, the weighted average discount rate of the Company’s finance leases is 8.46% and the weighted average time to maturity is 4.59 years. On January 11, 2023, the Company was required to deposit approximately $2.3 million to its landlord, equivalent to one year’s rent, for falling below the stipulated cash threshold in accordance with the San Tomas lease. The amount will be included as an asset on the balance sheet until the Company meets the minimum cash balance required and the deposit is returned. Approximate future minimum lease payments under finance leases as of March 31, 2024 are as follows: Six months ending September 30, 2024 | | $ | 1,333,000 | | Year ending September 30, | | | | | 2025 | | | 2,747,000 | | 2026 | | | 2,838,000 | | 2027 | | | 2,929,000 | | 2028 | | | 3,021,000 | | 2029 | | | 255,000 | | Total future minimum lease obligation | | | 13,123,000 | | Less imputed interest on finance lease obligations | | | (2,247,000 | ) | Net present value of financing lease obligations | | | 10,876,000 | | Less net present value of financing lease obligations – current portion | | | (1,889,000 | ) | Net present value of financing lease obligations - non-current portion | | $ | 8,987,000 | |
The Company leases two facilities under operating leases. The lease for the Company’s office headquarters will expire on November 30, 2025. The lease for its research and development laboratory was renewed in September 2021 for an additional ten years and will expire on February 29, 2032. The renewal was considered a modification for accounting purposes and the right of use asset and liability were remeasured as of the date of the renewal. The operating leases include escalating rental payments. The Company is recognizing the related rent expense on a straight-line basis over the terms of the leases. The Company incurred lease expense for operating leases of approximately $0.2 million for both the six months ended March 31, 2024 and 2023. Total cash paid related to operating leases during the six months ended March 31, 2024 and 2023 was approximately $0.2 million for each period. The weighted average discount rate of the Company’s operating leases is 9.03% and the weighted average time to maturity is 7.35 years. As of March 31, 2024, approximate future minimum lease payments under operating leases are as follows: Six months ending September 30, 2024 | | $ | 180,000 | | Year ending September 30, | | | | | 2025 | | | 366,000 | | 2026 | | | 287,000 | | 2027 | | | 277,000 | | 2028 | | | 285,000 | | 2029 | | | 294,000 | | Thereafter | | | 746,000 | | Total future minimum lease obligation | | | 2,435,000 | | Less imputed interest on operating lease obligation | | | (680,000 | ) | Net present value of operating lease obligations | | | 1,755,000 | | Less net present value of operating lease obligations - current portion | | | (211,000 | ) | Net present value of operating lease obligations - non-current portion | | $ | 1,544,000 | |
|
| X |
- References
+ Details
| Name: |
cvm_CommitmentsAndContingenciesAbstract |
| Namespace Prefix: |
cvm_ |
| Data Type: |
xbrli:stringItemType |
| Balance Type: |
na |
| Period Type: |
duration |
|
| X |
- DefinitionThe entire disclosure for commitments and contingencies. Reference 1: http://www.xbrl.org/2003/role/disclosureRef
-Topic 440
-SubTopic 10
-Name Accounting Standards Codification
-Section 50
-Paragraph 4
-Subparagraph (a)
-Publisher FASB
-URI https://asc.fasb.org//1943274/2147482648/440-10-50-4
Reference 2: http://www.xbrl.org/2009/role/commonPracticeRef
-Topic 450
-Name Accounting Standards Codification
-Publisher FASB
-URI https://asc.fasb.org//450/tableOfContent
Reference 3: http://www.xbrl.org/2003/role/disclosureRef
-Topic 954
-SubTopic 440
-Name Accounting Standards Codification
-Section 50
-Paragraph 1
-Subparagraph (a)
-Publisher FASB
-URI https://asc.fasb.org//1943274/2147480327/954-440-50-1
Reference 4: http://www.xbrl.org/2003/role/disclosureRef
-Topic 440
-SubTopic 10
-Name Accounting Standards Codification
-Section 50
-Paragraph 4
-Subparagraph (c)
-Publisher FASB
-URI https://asc.fasb.org//1943274/2147482648/440-10-50-4
Reference 5: http://fasb.org/us-gaap/role/ref/legacyRef
-Topic 440
-Name Accounting Standards Codification
-Publisher FASB
-URI https://asc.fasb.org//440/tableOfContent
| Name: |
us-gaap_CommitmentsAndContingenciesDisclosureTextBlock |
| Namespace Prefix: |
us-gaap_ |
| Data Type: |
dtr-types:textBlockItemType |
| Balance Type: |
na |
| Period Type: |
duration |
|
v3.24.1.1.u2
PATENTS
|
6 Months Ended |
Mar. 31, 2024 |
|---|
| PATENTS |
|
| PATENTS |
G. PATENTS During the six and three months ended March 31, 2024 and 2023, there was no impairment of patent costs. The weighted average amortization period for patents is approximately 8 years. For the six months ended March 31, 2024 and 2023, amortization of patent costs totaled approximately $17,000 and $20,000, respectively. For the three months ended March 31, 2024 and 2023, amortization of patent costs totaled approximately $8,000 and $10,000, respectively. The total estimated future amortization is as follows: Six months ending September 30, 2024 | | $ | 15,000 | | Year ending September 30, | | | | | 2025 | | | 29,000 | | 2026 | | | 25,000 | | 2027 | | | 22,000 | | 2028 | | | 19,000 | | 2029 | | | 16,000 | | Thereafter | | | 54,000 | | Total | | $ | 180,000 | |
|
| X |
- DefinitionThe entire disclosure for all or part of the information related to intangible assets. Reference 1: http://www.xbrl.org/2003/role/disclosureRef
-Topic 350
-SubTopic 30
-Name Accounting Standards Codification
-Publisher FASB
-URI https://asc.fasb.org//350-30/tableOfContent
| Name: |
us-gaap_IntangibleAssetsDisclosureTextBlock |
| Namespace Prefix: |
us-gaap_ |
| Data Type: |
dtr-types:textBlockItemType |
| Balance Type: |
na |
| Period Type: |
duration |
|
| X |
- References
+ Details
| Name: |
us-gaap_IntangibleAssetsNetExcludingGoodwillAbstract |
| Namespace Prefix: |
us-gaap_ |
| Data Type: |
xbrli:stringItemType |
| Balance Type: |
na |
| Period Type: |
duration |
|
v3.24.1.1.u2
LOSS PER COMMON SHARE
|
6 Months Ended |
Mar. 31, 2024 |
|---|
| LOSS PER COMMON SHARE |
|
| LOSS PER COMMON SHARE |
H. LOSS PER COMMON SHARE Basic loss per share is computed by dividing net loss available to common stockholders by the weighted average number of common shares outstanding during the period. The Company’s potentially dilutive shares, which include outstanding common stock options, common stock warrants and unvested restricted stock are not included in the computation of diluted net loss per share if their effect would be anti-dilutive. The following table provides a reconciliation of the numerators and denominators of the basic and diluted loss per-share computations: | | Six Months | | | Three Months | | | | Ended | | | Ended | | | | 2024 | | | 2023 | | | 2024 | | | 2023 | | Loss per share – basic and diluted | | | | | | | | | | | | | Net loss available to common – basic and diluted | | $ | (13,954,415 | ) | | $ | (16,367,870 | ) | | $ | (7,244,891 | ) | | $ | (8,342,809 | ) | Weighted average shares outstanding – basic and diluted | | | 50,228,860 | | | | 43,513,571 | | | | 52,006,442 | | | | 43,588,381 | | Basic and diluted loss per common share | | $ | (0.28 | ) | | $ | (0.38 | ) | | $ | (0.14 | ) | | $ | (0.19 | ) |
In accordance with the contingently issuable shares guidance of ASC 260, Earnings Per Share, the calculation of diluted net earnings (loss) per share excludes the following securities because their inclusion would have been anti-dilutive as of March 31: | | 2024 | | | 2023 | | Options and Warrants | | | 15,772,993 | | | | 13,893,248 | | Unvested Restricted Stock | | | 147,250 | | | | 149,250 | | Total | | | 15,920,243 | | | | 14,042,498 | |
|
| X |
- References
+ Details
| Name: |
us-gaap_EarningsPerShareAbstract |
| Namespace Prefix: |
us-gaap_ |
| Data Type: |
xbrli:stringItemType |
| Balance Type: |
na |
| Period Type: |
duration |
|
| X |
- DefinitionThe entire disclosure for earnings per share. Reference 1: http://www.xbrl.org/2003/role/disclosureRef
-Topic 260
-SubTopic 10
-Name Accounting Standards Codification
-Section 50
-Paragraph 1
-Subparagraph (c)
-Publisher FASB
-URI https://asc.fasb.org//1943274/2147482662/260-10-50-1
Reference 2: http://www.xbrl.org/2003/role/disclosureRef
-Topic 260
-Name Accounting Standards Codification
-Publisher FASB
-URI https://asc.fasb.org//260/tableOfContent
Reference 3: http://www.xbrl.org/2003/role/disclosureRef
-Topic 260
-SubTopic 10
-Name Accounting Standards Codification
-Section 50
-Paragraph 2
-Publisher FASB
-URI https://asc.fasb.org//1943274/2147482662/260-10-50-2
Reference 4: http://www.xbrl.org/2003/role/disclosureRef
-Topic 260
-SubTopic 10
-Name Accounting Standards Codification
-Section 50
-Paragraph 3
-Publisher FASB
-URI https://asc.fasb.org//1943274/2147482662/260-10-50-3
| Name: |
us-gaap_EarningsPerShareTextBlock |
| Namespace Prefix: |
us-gaap_ |
| Data Type: |
dtr-types:textBlockItemType |
| Balance Type: |
na |
| Period Type: |
duration |
|
v3.24.1.1.u2
SUBSEQUENT EVENTS
|
6 Months Ended |
Mar. 31, 2024 |
|---|
| SUBSEQUENT EVENTS |
|
| SUBSEQUENT EVENTS |
J. SUBSEQUENT EVENTS On May 4, 2024, the Company extended for two years the expiration date of 1,092,470 outstanding warrants. On May 8, 2024, officers and directors purchased 58,000 shares of restricted common stock from the Company at an aggregate fair market value of $80,620.
|
| X |
- References
+ Details
| Name: |
us-gaap_SubsequentEventsAbstract |
| Namespace Prefix: |
us-gaap_ |
| Data Type: |
xbrli:stringItemType |
| Balance Type: |
na |
| Period Type: |
duration |
|
| X |
- DefinitionThe entire disclosure for significant events or transactions that occurred after the balance sheet date through the date the financial statements were issued or the date the financial statements were available to be issued. Examples include: the sale of a capital stock issue, purchase of a business, settlement of litigation, catastrophic loss, significant foreign exchange rate changes, loans to insiders or affiliates, and transactions not in the ordinary course of business. Reference 1: http://www.xbrl.org/2003/role/disclosureRef
-Topic 855
-Name Accounting Standards Codification
-Publisher FASB
-URI https://asc.fasb.org//855/tableOfContent
Reference 2: http://www.xbrl.org/2003/role/disclosureRef
-Topic 855
-SubTopic 10
-Name Accounting Standards Codification
-Section 50
-Paragraph 2
-Subparagraph (a)
-Publisher FASB
-URI https://asc.fasb.org//1943274/2147483399/855-10-50-2
| Name: |
us-gaap_SubsequentEventsTextBlock |
| Namespace Prefix: |
us-gaap_ |
| Data Type: |
dtr-types:textBlockItemType |
| Balance Type: |
na |
| Period Type: |
duration |
|
v3.24.1.1.u2
SUMMARY OF SIGNIFICANT ACCOUNTING POLICIES (Policies)
|
6 Months Ended |
Mar. 31, 2024 |
|---|
| SUMMARY OF SIGNIFICANT ACCOUNTING POLICIES (Policies) |
|
| Cash and Cash Equivalents |
Cash and Cash Equivalents – Cash and cash equivalents consist principally of unrestricted cash on deposit and short-term money market funds. The Company considers all highly liquid investments with a maturity when purchased of less than three months to be cash equivalents.
|
| Property and Equipment |
Property and Equipment – Property and equipment is recorded at cost and depreciated using the straight-line method over estimated useful lives of five to seven years. Leasehold improvements are depreciated over the shorter of the estimated useful life of the asset or the term of the lease. Repairs and maintenance which do not extend the life of the asset are expensed when incurred. Property and equipment is reviewed on a quarterly basis to determine if any of the assets are impaired.
|
| Supplies used for R&D and manufacturing |
Supplies used for R&D and manufacturing – Supplies are consumable items kept on hand to support the Company’s R&D and manufacturing operations. Supplies are recorded at cost and are charged to expense as they are used in operations.
|
| Patents |
Patents – Patent expenditures are capitalized and amortized using the straight-line method over the shorter of the expected useful life or the legal life of the patent (17 years). In the event changes in technology or other circumstances impair the value or life of the patent, appropriate adjustments to the asset value and period of amortization are made. An impairment loss is recognized when estimated future undiscounted cash flows expected to result from the use of the asset, and from its disposition, are less than the carrying value of the asset. The amount of the impairment loss would be the difference between the estimated fair value of the asset and its carrying value.
|
| Leases |
Leases – The Company accounts for contracts that convey the right to control the use of identified property, plant or equipment over a period of time in exchange for consideration as leases upon inception. The Company leases certain real estate, machinery, laboratory equipment and office equipment over varying periods. Many of these leases include an option to either renew or terminate the lease. For purposes of calculating lease liabilities, these options are included in the lease term when it is reasonably certain that the Company will exercise such options. The incremental borrowing rate utilized to calculate the lease liabilities is based on the information available at the commencement date, as most of the leases do not provide an implicit borrowing rate. Short-term leases, defined as leases with initial terms of 12 months or less, are not reflected on the balance sheet. Lease expense for such short-term leases is not material.
|
| Stock-Based Compensation |
Share-Based Compensation – Compensation cost for all share-based awards is measured at fair value as of the grant date in accordance with the provisions of ASC 718, Compensation – Stock Compensation (“ASC 718”). The fair value of stock options is calculated using the Black-Scholes option pricing model. The Black-Scholes model requires various judgmental assumptions including volatility and expected option life. The share-based compensation cost is recognized using the straight-line method as expense over the requisite service or vesting period. The Company has Incentive Stock Option Plans, Non-Qualified Stock Option Plans, Stock Compensation Plans, Stock Bonus Plans and an Incentive Stock Bonus Plan. These Plans are collectively referred to as the “Plans”. All Plans have been approved by the Company’s stockholders. The Company’s stock options are not transferable, and the actual value of the stock options that an employee may realize, if any, will depend on the excess of the market price on the date of exercise over the exercise price. For options issued with service conditions only, the Company has based its assumption for stock price volatility on the variance of daily closing prices of the Company’s stock. The risk-free interest rate assumption is based on the U.S. Treasury rate at the date of grant with the term equal to the expected life of the option. Forfeitures are accounted for when they occur. The expected term of options represents the period that options granted are expected to be outstanding and has been determined based on an analysis of historical exercise behavior. If any of the assumptions used in the Black-Scholes model change significantly, share-based compensation expense for new awards may differ materially in the future from that recorded in the current period. Restricted stock granted under the Incentive Stock Bonus Plan and options granted under the Non-Qualified Stock Option Plans are subject to service, performance and market conditions and meet the classification of equity awards. These awards were measured at fair value on the grant dates using a Monte Carlo simulation for issuances where the attainment of performance criteria is uncertain. The total compensation cost will be expensed over the estimated requisite service period.
|
| Research and Development Costs |
Research and Development Costs – Research and development costs are expensed as incurred. Management accrues Clinical Research Organization (“CRO”) expenses and clinical trial study expenses based on services performed and relies on the CROs to provide estimates of those costs applicable to the completion stage of a study. Estimated accrued CRO costs are subject to revisions as such studies progress to completion. The Company records revisions to estimated expense in the period in which the facts that give rise to the revision become known.
|
| Net Loss Per Common Share |
Net Loss Per Common Share – The Company calculates net loss per common share in accordance with ASC 260, Earnings Per Share. Basic and diluted net loss per common share was determined by dividing net loss applicable to common shareholders by the weighted average number of common shares outstanding during the period. The Company’s potentially dilutive shares, which include outstanding common stock options, unvested restricted stock and common stock warrants, have not been included in the computation of diluted net loss per share for all periods as the result would be anti-dilutive.
|
| Income Taxes |
Income Taxes – The Company accounts for income taxes in accordance with the provisions of ASC 740, Income Taxes, on a tax jurisdiction basis. Deferred tax assets and liabilities are recognized for future tax consequences attributable to differences between the financial statement carrying amounts of existing assets and liabilities and their respective tax bases and operating and tax loss carryforwards. Deferred tax assets and liabilities are measured using enacted tax rates expected to apply to taxable income in the years in which those temporary differences are expected to be recovered or settled. The effect on deferred tax assets and liabilities of a change in tax rates is recognized in income in the period that includes the enactment date. The Company records a valuation allowance to reduce the deferred tax assets to the amount that is more likely than not to be recognized. A full valuation allowance was recorded against the deferred tax assets as of March 31, 2024 and September 30, 2023.
|
| Impairment of long-lived assets |
Impairment of long-lived assets – CEL-SCI’s fixed assets are made up of leasehold improvements, furniture, and equipment. ASC 360-10 requires that a long-lived asset group be reviewed for impairment only when events or changes in circumstances indicate that the carrying amount of the long-lived asset (group) might not be recoverable. CEL-SCI’s recurring losses are a triggering event that could indicate impairment of long-lived assets such as fixed assets. CEL-SCI reviews these assets to determine if events or changes in circumstances indicate the existence of impairment. If indicators of impairment exist, the Company tests for recoverability, then, if necessary, measures and records the impairment. The amount of the impairment loss would be the amount by which the carrying amount of the asset (group) exceeds its fair value.
|
| Use of Estimates |
Use of Estimates – The preparation of financial statements in conformity with U.S. GAAP requires management to make estimates and assumptions that affect the amounts reported in the financial statements and the accompanying disclosures. These estimates are based on management’s best knowledge of current events and actions the Company may undertake in the future. Estimates are used in accounting for, among other items, inventory obsolescence, accruals, stock options, useful lives for depreciation and amortization of long-lived assets, right of use assets and lease liabilities, deferred tax assets and the related valuation allowance. Actual results could differ from estimates, although management does not generally believe such differences would materially affect the financial statements in any given year. Additionally, in calculating the right of use assets and lease liabilities, estimates and assumptions were used to determine the incremental borrowing rates and the expected lease terms. The Company considers the estimates used in valuing the stock options and the lease assets and liabilities to be significant.
|
| Recently Adopted Accounting Standards |
Recently Adopted Accounting Standards In June 2016, the Financial Accounting Standards Board (“FASB”) issued Accounting Standards Update No. 2016-13, Financial Instruments – Credit Losses (Topic 326): Measurement of Credit Losses on Financial Instruments (“ASU 2016-13”). ASU 2016-13 requires a financial asset (or a group of financial assets) measured at amortized cost basis to be presented at the net amount expected to be collected. The amendments in ASU 2016-13 replace the incurred loss impairment methodology in current U.S. GAAP with a methodology that reflects expected credit losses and requires consideration of a broader range of reasonable and supportable information. ASU 2016-13 was effective for SEC filers, excluding smaller reporting companies, for fiscal years beginning after December 15, 2019, including interim periods within those fiscal years. As a smaller reporting company, the Company was permitted to adopt the new standard for fiscal years beginning after December 15, 2022, including interim periods within those fiscal years. Effective October 1, 2023, the Company adopted ASU 2016-13 using a modified retrospective transition method. The adoption of ASU 2016-13 had no impact on the Company’s financial position, results of operations, or cash flows.
|
| New Accounting Pronouncements |
New Accounting Pronouncements – The Company has considered all recently issued accounting pronouncements and does not believe the adoption of such pronouncements will have a material impact on its financial statements.
|
| X |
- References
+ Details
| Name: |
cvm_ImpairmentOfLongLivedAssetsPolicyTextblock |
| Namespace Prefix: |
cvm_ |
| Data Type: |
nonnum:textBlockItemType |
| Balance Type: |
na |
| Period Type: |
duration |
|
| X |
- References
+ Details
| Name: |
cvm_LeasesPolicyTextBlock |
| Namespace Prefix: |
cvm_ |
| Data Type: |
nonnum:textBlockItemType |
| Balance Type: |
na |
| Period Type: |
duration |
|
| X |
- References
+ Details
| Name: |
cvm_NewAccountingPronouncementEarlyAdoptionPolicyTextBlock |
| Namespace Prefix: |
cvm_ |
| Data Type: |
nonnum:textBlockItemType |
| Balance Type: |
na |
| Period Type: |
duration |
|
| X |
- References
+ Details
| Name: |
us-gaap_AccountingPoliciesAbstract |
| Namespace Prefix: |
us-gaap_ |
| Data Type: |
xbrli:stringItemType |
| Balance Type: |
na |
| Period Type: |
duration |
|
| X |
- DefinitionDisclosure of accounting policy for cash and cash equivalents, including the policy for determining which items are treated as cash equivalents. Other information that may be disclosed includes (1) the nature of any restrictions on the entity's use of its cash and cash equivalents, (2) whether the entity's cash and cash equivalents are insured or expose the entity to credit risk, (3) the classification of any negative balance accounts (overdrafts), and (4) the carrying basis of cash equivalents (for example, at cost) and whether the carrying amount of cash equivalents approximates fair value. Reference 1: http://fasb.org/us-gaap/role/ref/legacyRef
-Name Accounting Standards Codification
-Topic 230
-SubTopic 10
-Section 50
-Paragraph 1
-Publisher FASB
-URI https://asc.fasb.org//1943274/2147482913/230-10-50-1
| Name: |
us-gaap_CashAndCashEquivalentsPolicyTextBlock |
| Namespace Prefix: |
us-gaap_ |
| Data Type: |
dtr-types:textBlockItemType |
| Balance Type: |
na |
| Period Type: |
duration |
|
| X |
- DefinitionDisclosure of accounting policy for computing basic and diluted earnings or loss per share for each class of common stock and participating security. Addresses all significant policy factors, including any antidilutive items that have been excluded from the computation and takes into account stock dividends, splits and reverse splits that occur after the balance sheet date of the latest reporting period but before the issuance of the financial statements. Reference 1: http://fasb.org/us-gaap/role/ref/legacyRef
-Name Accounting Standards Codification
-Topic 260
-SubTopic 10
-Section 50
-Paragraph 1
-Subparagraph (c)
-Publisher FASB
-URI https://asc.fasb.org//1943274/2147482662/260-10-50-1
Reference 2: http://fasb.org/us-gaap/role/ref/legacyRef
-Name Accounting Standards Codification
-Topic 260
-SubTopic 10
-Section 50
-Paragraph 2
-Publisher FASB
-URI https://asc.fasb.org//1943274/2147482662/260-10-50-2
| Name: |
us-gaap_EarningsPerSharePolicyTextBlock |
| Namespace Prefix: |
us-gaap_ |
| Data Type: |
dtr-types:textBlockItemType |
| Balance Type: |
na |
| Period Type: |
duration |
|
| X |
- DefinitionDisclosure of accounting policy for income taxes, which may include its accounting policies for recognizing and measuring deferred tax assets and liabilities and related valuation allowances, recognizing investment tax credits, operating loss carryforwards, tax credit carryforwards, and other carryforwards, methodologies for determining its effective income tax rate and the characterization of interest and penalties in the financial statements. Reference 1: http://www.xbrl.org/2003/role/disclosureRef
-Topic 946
-SubTopic 10
-Name Accounting Standards Codification
-Section S99
-Paragraph 3
-Subparagraph (SX 210.6-03(h)(1))
-Publisher FASB
-URI https://asc.fasb.org//1943274/2147479886/946-10-S99-3
Reference 2: http://www.xbrl.org/2003/role/disclosureRef
-Topic 740
-SubTopic 10
-Name Accounting Standards Codification
-Section 50
-Paragraph 17
-Subparagraph (b)
-Publisher FASB
-URI https://asc.fasb.org//1943274/2147482685/740-10-50-17
Reference 3: http://www.xbrl.org/2003/role/disclosureRef
-Topic 740
-SubTopic 10
-Name Accounting Standards Codification
-Section 50
-Paragraph 9
-Publisher FASB
-URI https://asc.fasb.org//1943274/2147482685/740-10-50-9
Reference 4: http://www.xbrl.org/2003/role/disclosureRef
-Topic 740
-SubTopic 10
-Name Accounting Standards Codification
-Section 45
-Paragraph 25
-Publisher FASB
-URI https://asc.fasb.org//1943274/2147482525/740-10-45-25
Reference 5: http://www.xbrl.org/2003/role/disclosureRef
-Topic 740
-SubTopic 10
-Name Accounting Standards Codification
-Section 45
-Paragraph 28
-Publisher FASB
-URI https://asc.fasb.org//1943274/2147482525/740-10-45-28
Reference 6: http://www.xbrl.org/2003/role/disclosureRef
-Topic 740
-SubTopic 10
-Name Accounting Standards Codification
-Section 50
-Paragraph 19
-Publisher FASB
-URI https://asc.fasb.org//1943274/2147482685/740-10-50-19
Reference 7: http://www.xbrl.org/2003/role/disclosureRef
-Topic 220
-SubTopic 10
-Name Accounting Standards Codification
-Section 50
-Paragraph 1
-Publisher FASB
-URI https://asc.fasb.org//1943274/2147482765/220-10-50-1
Reference 8: http://www.xbrl.org/2003/role/disclosureRef
-Topic 740
-SubTopic 10
-Name Accounting Standards Codification
-Section 50
-Paragraph 20
-Publisher FASB
-URI https://asc.fasb.org//1943274/2147482685/740-10-50-20
| Name: |
us-gaap_IncomeTaxPolicyTextBlock |
| Namespace Prefix: |
us-gaap_ |
| Data Type: |
dtr-types:textBlockItemType |
| Balance Type: |
na |
| Period Type: |
duration |
|
| X |
- DefinitionDisclosure of accounting policy for finite-lived intangible assets. This accounting policy also might address: (1) the amortization method used; (2) the useful lives of such assets; and (3) how the entity assesses and measures impairment of such assets. Reference 1: http://www.xbrl.org/2003/role/disclosureRef
-Topic 926
-SubTopic 20
-Name Accounting Standards Codification
-Section 50
-Paragraph 5
-Publisher FASB
-URI https://asc.fasb.org//1943274/2147483154/926-20-50-5
Reference 2: http://www.xbrl.org/2003/role/exampleRef
-Topic 235
-SubTopic 10
-Name Accounting Standards Codification
-Section 50
-Paragraph 4
-Subparagraph (c)
-Publisher FASB
-URI https://asc.fasb.org//1943274/2147483426/235-10-50-4
Reference 3: http://www.xbrl.org/2003/role/disclosureRef
-Topic 920
-SubTopic 350
-Name Accounting Standards Codification
-Section 50
-Paragraph 1
-Subparagraph (a)
-Publisher FASB
-URI https://asc.fasb.org//1943274/2147483256/920-350-50-1
Reference 4: http://www.xbrl.org/2003/role/disclosureRef
-Topic 920
-SubTopic 350
-Name Accounting Standards Codification
-Section 50
-Paragraph 1
-Subparagraph (b)
-Publisher FASB
-URI https://asc.fasb.org//1943274/2147483256/920-350-50-1
Reference 5: http://www.xbrl.org/2003/role/disclosureRef
-Topic 920
-SubTopic 350
-Name Accounting Standards Codification
-Section 50
-Paragraph 4
-Subparagraph (a)
-Publisher FASB
-URI https://asc.fasb.org//1943274/2147483256/920-350-50-4
Reference 6: http://fasb.org/us-gaap/role/ref/legacyRef
-Name Accounting Standards Codification
-Topic 350
-SubTopic 30
-Section 50
-Paragraph 2
-Subparagraph (a)
-Publisher FASB
-URI https://asc.fasb.org//1943274/2147482665/350-30-50-2
| Name: |
us-gaap_IntangibleAssetsFiniteLivedPolicy |
| Namespace Prefix: |
us-gaap_ |
| Data Type: |
dtr-types:textBlockItemType |
| Balance Type: |
na |
| Period Type: |
duration |
|
| X |
- DefinitionDisclosure of inventory accounting policy for inventory classes, including, but not limited to, basis for determining inventory amounts, methods by which amounts are added and removed from inventory classes, loss recognition on impairment of inventories, and situations in which inventories are stated above cost. Reference 1: http://www.xbrl.org/2003/role/disclosureRef
-Topic 210
-SubTopic 10
-Name Accounting Standards Codification
-Section 50
-Paragraph 1
-Publisher FASB
-URI https://asc.fasb.org//1943274/2147483489/210-10-50-1
Reference 2: http://www.xbrl.org/2003/role/disclosureRef
-Topic 210
-SubTopic 10
-Name Accounting Standards Codification
-Section S99
-Paragraph 1
-Subparagraph (SX 210.5-02(6)(b))
-Publisher FASB
-URI https://asc.fasb.org//1943274/2147480566/210-10-S99-1
Reference 3: http://www.xbrl.org/2003/role/exampleRef
-Topic 235
-SubTopic 10
-Name Accounting Standards Codification
-Section 50
-Paragraph 4
-Subparagraph (d)
-Publisher FASB
-URI https://asc.fasb.org//1943274/2147483426/235-10-50-4
Reference 4: http://www.xbrl.org/2003/role/disclosureRef
-Topic 912
-SubTopic 330
-Name Accounting Standards Codification
-Section 50
-Paragraph 1
-Publisher FASB
-URI https://asc.fasb.org//1943274/2147482105/912-330-50-1
Reference 5: http://www.xbrl.org/2003/role/disclosureRef
-Topic 330
-Name Accounting Standards Codification
-Publisher FASB
-URI https://asc.fasb.org//330/tableOfContent
Reference 6: http://www.xbrl.org/2003/role/disclosureRef
-Topic 330
-SubTopic 10
-Name Accounting Standards Codification
-Section 50
-Paragraph 1
-Publisher FASB
-URI https://asc.fasb.org//1943274/2147483080/330-10-50-1
Reference 7: http://www.xbrl.org/2003/role/disclosureRef
-Topic 330
-SubTopic 10
-Name Accounting Standards Codification
-Section 50
-Paragraph 4
-Publisher FASB
-URI https://asc.fasb.org//1943274/2147483080/330-10-50-4
Reference 8: http://www.xbrl.org/2003/role/disclosureRef
-Name Accounting Standards Codification
-Section 45
-Paragraph 6
-Subparagraph (a)
-SubTopic 10
-Topic 270
-Publisher FASB
-URI https://asc.fasb.org//1943274/2147482989/270-10-45-6
| Name: |
us-gaap_InventoryPolicyTextBlock |
| Namespace Prefix: |
us-gaap_ |
| Data Type: |
dtr-types:textBlockItemType |
| Balance Type: |
na |
| Period Type: |
duration |
|
| X |
- DefinitionDisclosure of accounting policy pertaining to new accounting pronouncements that may impact the entity's financial reporting. Includes, but is not limited to, quantification of the expected or actual impact.
| Name: |
us-gaap_NewAccountingPronouncementsPolicyPolicyTextBlock |
| Namespace Prefix: |
us-gaap_ |
| Data Type: |
dtr-types:textBlockItemType |
| Balance Type: |
na |
| Period Type: |
duration |
|
| X |
- DefinitionDisclosure of accounting policy for long-lived, physical asset used in normal conduct of business and not intended for resale. Includes, but is not limited to, work of art, historical treasure, and similar asset classified as collections. Reference 1: http://fasb.org/us-gaap/role/ref/legacyRef
-Name Accounting Standards Codification
-Section 50
-Paragraph 1
-SubTopic 10
-Topic 360
-Publisher FASB
-URI https://asc.fasb.org//1943274/2147482099/360-10-50-1
Reference 2: http://www.xbrl.org/2003/role/disclosureRef
-Topic 944
-SubTopic 210
-Name Accounting Standards Codification
-Section S99
-Paragraph 1
-Subparagraph (SX 210.7-03(a)(8)(a))
-Publisher FASB
-URI https://asc.fasb.org//1943274/2147479440/944-210-S99-1
Reference 3: http://www.xbrl.org/2003/role/disclosureRef
-Name Accounting Standards Codification
-Section 50
-Paragraph 6
-SubTopic 360
-Topic 958
-Publisher FASB
-URI https://asc.fasb.org//1943274/2147480321/958-360-50-6
Reference 4: http://www.xbrl.org/2003/role/disclosureRef
-Name Accounting Standards Codification
-Section 50
-Paragraph 1
-Subparagraph (d)
-SubTopic 360
-Topic 958
-Publisher FASB
-URI https://asc.fasb.org//1943274/2147480321/958-360-50-1
| Name: |
us-gaap_PropertyPlantAndEquipmentPolicyTextBlock |
| Namespace Prefix: |
us-gaap_ |
| Data Type: |
dtr-types:textBlockItemType |
| Balance Type: |
na |
| Period Type: |
duration |
|
| X |
- DefinitionDisclosure of accounting policy for costs it has incurred (1) in a planned search or critical investigation aimed at discovery of new knowledge with the hope that such knowledge will be useful in developing a new product or service, a new process or technique, or in bringing about a significant improvement to an existing product or process; or (2) to translate research findings or other knowledge into a plan or design for a new product or process or for a significant improvement to an existing product or process. Reference 1: http://www.xbrl.org/2003/role/disclosureRef
-Topic 730
-SubTopic 10
-Name Accounting Standards Codification
-Section 05
-Paragraph 1
-Subparagraph (c)
-Publisher FASB
-URI https://asc.fasb.org//1943274/2147483044/730-10-05-1
| Name: |
us-gaap_ResearchAndDevelopmentExpensePolicy |
| Namespace Prefix: |
us-gaap_ |
| Data Type: |
dtr-types:textBlockItemType |
| Balance Type: |
na |
| Period Type: |
duration |
|
| X |
- DefinitionDisclosure of accounting policy for award under share-based payment arrangement. Includes, but is not limited to, methodology and assumption used in measuring cost. Reference 1: http://www.xbrl.org/2003/role/disclosureRef
-Topic 718
-SubTopic 10
-Name Accounting Standards Codification
-Section 50
-Paragraph 2
-Subparagraph (f)(2)(i)
-Publisher FASB
-URI https://asc.fasb.org//1943274/2147480429/718-10-50-2
Reference 2: http://www.xbrl.org/2003/role/disclosureRef
-Topic 718
-SubTopic 10
-Name Accounting Standards Codification
-Section 50
-Paragraph 2
-Subparagraph (f)(2)(ii)
-Publisher FASB
-URI https://asc.fasb.org//1943274/2147480429/718-10-50-2
Reference 3: http://www.xbrl.org/2003/role/disclosureRef
-Topic 718
-SubTopic 10
-Name Accounting Standards Codification
-Section 50
-Paragraph 2
-Subparagraph (f)(2)(v)
-Publisher FASB
-URI https://asc.fasb.org//1943274/2147480429/718-10-50-2
Reference 4: http://www.xbrl.org/2003/role/disclosureRef
-Topic 718
-SubTopic 10
-Name Accounting Standards Codification
-Section S99
-Paragraph 1
-Subparagraph (SAB Topic 14.C.Q3)
-Publisher FASB
-URI https://asc.fasb.org//1943274/2147479830/718-10-S99-1
Reference 5: http://www.xbrl.org/2003/role/disclosureRef
-Topic 718
-SubTopic 10
-Name Accounting Standards Codification
-Section S99
-Paragraph 1
-Subparagraph (SAB Topic 14.D.1.Q5)
-Publisher FASB
-URI https://asc.fasb.org//1943274/2147479830/718-10-S99-1
Reference 6: http://www.xbrl.org/2003/role/disclosureRef
-Topic 718
-SubTopic 10
-Name Accounting Standards Codification
-Section S99
-Paragraph 1
-Subparagraph (SAB Topic 14.D.3.Q2)
-Publisher FASB
-URI https://asc.fasb.org//1943274/2147479830/718-10-S99-1
Reference 7: http://www.xbrl.org/2003/role/disclosureRef
-Topic 718
-SubTopic 10
-Name Accounting Standards Codification
-Section S99
-Paragraph 1
-Subparagraph (SAB Topic 14.D.2.Q6)
-Publisher FASB
-URI https://asc.fasb.org//1943274/2147479830/718-10-S99-1
Reference 8: http://www.xbrl.org/2003/role/disclosureRef
-Topic 718
-Name Accounting Standards Codification
-Publisher FASB
-URI https://asc.fasb.org//718/tableOfContent
Reference 9: http://www.xbrl.org/2003/role/disclosureRef
-Topic 718
-SubTopic 10
-Name Accounting Standards Codification
-Section 50
-Paragraph 2
-Subparagraph (b)
-Publisher FASB
-URI https://asc.fasb.org//1943274/2147480429/718-10-50-2
Reference 10: http://www.xbrl.org/2003/role/disclosureRef
-Topic 718
-SubTopic 10
-Name Accounting Standards Codification
-Section 50
-Paragraph 2
-Subparagraph (f)(1)
-Publisher FASB
-URI https://asc.fasb.org//1943274/2147480429/718-10-50-2
Reference 11: http://www.xbrl.org/2003/role/disclosureRef
-Topic 718
-SubTopic 10
-Name Accounting Standards Codification
-Section 50
-Paragraph 2
-Subparagraph (f)(2)
-Publisher FASB
-URI https://asc.fasb.org//1943274/2147480429/718-10-50-2
| Name: |
us-gaap_ShareBasedCompensationOptionAndIncentivePlansPolicy |
| Namespace Prefix: |
us-gaap_ |
| Data Type: |
dtr-types:textBlockItemType |
| Balance Type: |
na |
| Period Type: |
duration |
|
| X |
- DefinitionDisclosure of accounting policy for the use of estimates in the preparation of financial statements in conformity with generally accepted accounting principles. Reference 1: http://fasb.org/us-gaap/role/ref/legacyRef
-Name Accounting Standards Codification
-Topic 275
-SubTopic 10
-Section 50
-Paragraph 9
-Publisher FASB
-URI https://asc.fasb.org//1943274/2147482861/275-10-50-9
Reference 2: http://fasb.org/us-gaap/role/ref/legacyRef
-Name Accounting Standards Codification
-Topic 275
-SubTopic 10
-Section 50
-Paragraph 4
-Publisher FASB
-URI https://asc.fasb.org//1943274/2147482861/275-10-50-4
Reference 3: http://www.xbrl.org/2003/role/disclosureRef
-Name Accounting Standards Codification
-Section 50
-Paragraph 1
-Subparagraph (b)
-SubTopic 10
-Topic 275
-Publisher FASB
-URI https://asc.fasb.org//1943274/2147482861/275-10-50-1
Reference 4: http://www.xbrl.org/2003/role/disclosureRef
-Name Accounting Standards Codification
-Section 50
-Paragraph 1
-Subparagraph (c)
-SubTopic 10
-Topic 275
-Publisher FASB
-URI https://asc.fasb.org//1943274/2147482861/275-10-50-1
Reference 5: http://www.xbrl.org/2003/role/disclosureRef
-Name Accounting Standards Codification
-Section 50
-Paragraph 11
-SubTopic 10
-Topic 275
-Publisher FASB
-URI https://asc.fasb.org//1943274/2147482861/275-10-50-11
Reference 6: http://www.xbrl.org/2003/role/disclosureRef
-Name Accounting Standards Codification
-Section 50
-Paragraph 12
-SubTopic 10
-Topic 275
-Publisher FASB
-URI https://asc.fasb.org//1943274/2147482861/275-10-50-12
Reference 7: http://fasb.org/us-gaap/role/ref/legacyRef
-Name Accounting Standards Codification
-Topic 275
-SubTopic 10
-Section 50
-Paragraph 8
-Publisher FASB
-URI https://asc.fasb.org//1943274/2147482861/275-10-50-8
| Name: |
us-gaap_UseOfEstimates |
| Namespace Prefix: |
us-gaap_ |
| Data Type: |
dtr-types:textBlockItemType |
| Balance Type: |
na |
| Period Type: |
duration |
|
v3.24.1.1.u2
STOCKHOLDERS EQUITY (Tables)
|
6 Months Ended |
Mar. 31, 2024 |
|---|
| STOCKHOLDERS EQUITY |
|
| Schedule of equity compensation plans |
Name of Plan | | Total Shares Reserved Under Plans | | Incentive Stock Option Plans | | | 138,400 | | Non-Qualified Stock Option Plans | | | 15,787,200 | | Stock Bonus Plans | | | 1,283,760 | | Stock Compensation Plans | | | 634,000 | | Incentive Stock Bonus Plan | | | 640,000 | |
|
| Schedule of Stock option activity |
| | Six Months Ended March 31, | | | | 2024 | | | 2023 | | Options granted | | | 3,000 | | | | 4,500 | | Options exercised | | | - | | | | - | | Options forfeited | | | 53,000 | | | | 122,332 | | Options expired | | | 27,035 | | | | 45,404 | |
| | Three Months Ended March 31, | | | | 2024 | | | 2023 | | Options granted | | | 3,000 | | | | 2,000 | | Options exercised | | | - | | | | - | | Options forfeited | | | 42,000 | | | | 25,500 | | Options expired | | | 27,035 | | | | 4 | |
|
| Schedule of Stock-Based Compensation Expense |
| | Six Months Ended March 31, | | | | 2024 | | | 2023 | | Employees | | $ | 2,816,449 | | | $ | 3,436,119 | | Non-employees | | $ | 370,163 | | | $ | 285,722 | |
| | Three Months Ended March 31, | | | | 2024 | | | 2023 | | Employees | | $ | 1,432,540 | | | $ | 1,743,288 | | Non-employees | | $ | 151,777 | | | $ | 136,864 | |
|
| Schedule of warrants and non-employee options outstanding |
Warrant/ Options | | Issue Date | | Shares Issuable upon Exercise of Warrants/ Options | | | Exercise Price | | | Expiration Date | | Series N | | 8/18/2008 | | | 85,339 | | | $ | 3.00 | | | 8/18/2024 | | Series UU | | 6/11/2018 | | | 93,603 | | | $ | 2.80 | | | 6/30/2024 | | Series X | | 1/13/2016 | | | 120,000 | | | $ | 9.25 | | | 7/13/2024 | | Series Y | | 2/15/2016 | | | 26,000 | | | $ | 12.00 | | | 8/15/2024 | | Series MM | | 6/22/2017 | | | 333,432 | | | $ | 1.86 | | | 6/22/2024 | | Series NN | | 7/24/2017 | | | 200,087 | | | $ | 2.52 | | | 7/24/2024 | | Series RR | | 10/30/2017 | | | 234,009 | | | $ | 1.65 | | | 10/30/2024 | | Consultant Options | | 7/28/2017 – 9/2/2023 | | | 110,000 | | | $ | 1.39 - $2.18 | | | 7/27/2027 - 9/1/2028 | |
|
| Schedule of derivative liabilities |
Warrants | | Warrants Exercised | | | Exercise Price | | | Proceeds | | Series RR | | | 17,752 | | | $ | 1.65 | | | $ | 29,291 | | Series SS | | | 200,000 | | | $ | 2.09 | | | | 418,000 | | | | | 217,752 | | | | | | | $ | 447,291 | |
|
| X |
- References
+ Details
| Name: |
cvm_ScheduleOfCompensatingBalancesTableTextBlock |
| Namespace Prefix: |
cvm_ |
| Data Type: |
nonnum:textBlockItemType |
| Balance Type: |
na |
| Period Type: |
duration |
|
| X |
- References
+ Details
| Name: |
cvm_ScheduleOfDerivativeLiabilitiesTableTextBlock |
| Namespace Prefix: |
cvm_ |
| Data Type: |
nonnum:textBlockItemType |
| Balance Type: |
na |
| Period Type: |
duration |
|
| X |
- References
+ Details
| Name: |
cvm_ScheduleOfStockOptionActivityTableTextBlock |
| Namespace Prefix: |
cvm_ |
| Data Type: |
nonnum:textBlockItemType |
| Balance Type: |
na |
| Period Type: |
duration |
|
| X |
- References
+ Details
| Name: |
cvm_ScheduleOfWarrantsAndNonEmployeeOptionsOutstandingTableTextBlock |
| Namespace Prefix: |
cvm_ |
| Data Type: |
nonnum:textBlockItemType |
| Balance Type: |
na |
| Period Type: |
duration |
|
| X |
- References
+ Details
| Name: |
us-gaap_EquityAbstract |
| Namespace Prefix: |
us-gaap_ |
| Data Type: |
xbrli:stringItemType |
| Balance Type: |
na |
| Period Type: |
duration |
|
| X |
- DefinitionTabular disclosure of activity for award under share-based payment arrangement. Includes, but is not limited to, outstanding award at beginning and end of year, granted, exercised, forfeited, and weighted-average grant date fair value. Reference 1: http://fasb.org/us-gaap/role/ref/legacyRef
-Name Accounting Standards Codification
-Topic 718
-SubTopic 10
-Section 50
-Paragraph 2
-Subparagraph (c)(2)
-Publisher FASB
-URI https://asc.fasb.org//1943274/2147480429/718-10-50-2
Reference 2: http://fasb.org/us-gaap/role/ref/legacyRef
-Name Accounting Standards Codification
-Section 50
-Paragraph 2
-Subparagraph (d)
-SubTopic 10
-Topic 718
-Publisher FASB
-URI https://asc.fasb.org//1943274/2147480429/718-10-50-2
Reference 3: http://fasb.org/us-gaap/role/ref/legacyRef
-Name Accounting Standards Codification
-Section 50
-Paragraph 2
-Subparagraph (e)
-SubTopic 10
-Topic 718
-Publisher FASB
-URI https://asc.fasb.org//1943274/2147480429/718-10-50-2
| Name: |
us-gaap_ScheduleOfShareBasedCompensationActivityTableTextBlock |
| Namespace Prefix: |
us-gaap_ |
| Data Type: |
dtr-types:textBlockItemType |
| Balance Type: |
na |
| Period Type: |
duration |
|
v3.24.1.1.u2
COMMITMENTS AND CONTINGENCIES (Tables)
|
6 Months Ended |
Mar. 31, 2024 |
|---|
| COMMITMENTS AND CONTINGENCIES |
|
| Schedule of future minimum payments under finance leases |
Six months ending September 30, 2024 | | $ | 1,333,000 | | Year ending September 30, | | | | | 2025 | | | 2,747,000 | | 2026 | | | 2,838,000 | | 2027 | | | 2,929,000 | | 2028 | | | 3,021,000 | | 2029 | | | 255,000 | | Total future minimum lease obligation | | | 13,123,000 | | Less imputed interest on finance lease obligations | | | (2,247,000 | ) | Net present value of financing lease obligations | | | 10,876,000 | | Less net present value of financing lease obligations – current portion | | | (1,889,000 | ) | Net present value of financing lease obligations - non-current portion | | $ | 8,987,000 | |
Six months ending September 30, 2024 | | $ | 180,000 | | Year ending September 30, | | | | | 2025 | | | 366,000 | | 2026 | | | 287,000 | | 2027 | | | 277,000 | | 2028 | | | 285,000 | | 2029 | | | 294,000 | | Thereafter | | | 746,000 | | Total future minimum lease obligation | | | 2,435,000 | | Less imputed interest on operating lease obligation | | | (680,000 | ) | Net present value of operating lease obligations | | | 1,755,000 | | Less net present value of operating lease obligations - current portion | | | (211,000 | ) | Net present value of operating lease obligations - non-current portion | | $ | 1,544,000 | |
|
| X |
- References
+ Details
| Name: |
cvm_CommitmentsAndContingenciesAbstract |
| Namespace Prefix: |
cvm_ |
| Data Type: |
xbrli:stringItemType |
| Balance Type: |
na |
| Period Type: |
duration |
|
| X |
- DefinitionTabular disclosure of undiscounted cash flows of finance lease liability. Includes, but is not limited to, reconciliation of undiscounted cash flows to finance lease liability recognized in statement of financial position. Reference 1: http://www.xbrl.org/2009/role/commonPracticeRef
-Topic 842
-SubTopic 20
-Name Accounting Standards Codification
-Section 50
-Paragraph 6
-Publisher FASB
-URI https://asc.fasb.org//1943274/2147478964/842-20-50-6
| Name: |
us-gaap_FinanceLeaseLiabilityMaturityTableTextBlock |
| Namespace Prefix: |
us-gaap_ |
| Data Type: |
dtr-types:textBlockItemType |
| Balance Type: |
na |
| Period Type: |
duration |
|
v3.24.1.1.u2
PATENTS (Tables)
|
6 Months Ended |
Mar. 31, 2024 |
|---|
| PATENTS |
|
| Schedule of total estimated future amortization |
Six months ending September 30, 2024 | | $ | 15,000 | | Year ending September 30, | | | | | 2025 | | | 29,000 | | 2026 | | | 25,000 | | 2027 | | | 22,000 | | 2028 | | | 19,000 | | 2029 | | | 16,000 | | Thereafter | | | 54,000 | | Total | | $ | 180,000 | |
|
| X |
- References
+ Details
| Name: |
us-gaap_IntangibleAssetsNetExcludingGoodwillAbstract |
| Namespace Prefix: |
us-gaap_ |
| Data Type: |
xbrli:stringItemType |
| Balance Type: |
na |
| Period Type: |
duration |
|
| X |
- DefinitionTabular disclosure of the amount of amortization expense expected to be recorded in succeeding fiscal years for finite-lived intangible assets. Reference 1: http://fasb.org/us-gaap/role/ref/legacyRef
-Name Accounting Standards Codification
-Topic 350
-SubTopic 30
-Section 50
-Paragraph 2
-Subparagraph (a)
-Publisher FASB
-URI https://asc.fasb.org//1943274/2147482665/350-30-50-2
| Name: |
us-gaap_ScheduleofFiniteLivedIntangibleAssetsFutureAmortizationExpenseTableTextBlock |
| Namespace Prefix: |
us-gaap_ |
| Data Type: |
dtr-types:textBlockItemType |
| Balance Type: |
na |
| Period Type: |
duration |
|
v3.24.1.1.u2
LOSS PER COMMON SHARE (Tables)
|
6 Months Ended |
Mar. 31, 2024 |
|---|
| LOSS PER COMMON SHARE |
|
| Schedule of reconciliation of the numerators and denominators of the basic and diluted per-share computations |
| | Six Months | | | Three Months | | | | Ended | | | Ended | | | | 2024 | | | 2023 | | | 2024 | | | 2023 | | Loss per share – basic and diluted | | | | | | | | | | | | | Net loss available to common – basic and diluted | | $ | (13,954,415 | ) | | $ | (16,367,870 | ) | | $ | (7,244,891 | ) | | $ | (8,342,809 | ) | Weighted average shares outstanding – basic and diluted | | | 50,228,860 | | | | 43,513,571 | | | | 52,006,442 | | | | 43,588,381 | | Basic and diluted loss per common share | | $ | (0.28 | ) | | $ | (0.38 | ) | | $ | (0.14 | ) | | $ | (0.19 | ) |
|
| Schedule of anti-dilutive securities |
| | 2024 | | | 2023 | | Options and Warrants | | | 15,772,993 | | | | 13,893,248 | | Unvested Restricted Stock | | | 147,250 | | | | 149,250 | | Total | | | 15,920,243 | | | | 14,042,498 | |
|
| X |
- References
+ Details
| Name: |
cvm_ScheduleOfAntiDilutiveSecuritiesTableTextBlock |
| Namespace Prefix: |
cvm_ |
| Data Type: |
nonnum:textBlockItemType |
| Balance Type: |
na |
| Period Type: |
duration |
|
| X |
- References
+ Details
| Name: |
cvm_ScheduleOfReconciliationOfTheNumeratorsAndDenominatorsOfTheBasicAndDilutedPerShareComputationsTableTextBlock |
| Namespace Prefix: |
cvm_ |
| Data Type: |
nonnum:textBlockItemType |
| Balance Type: |
na |
| Period Type: |
duration |
|
| X |
- References
+ Details
| Name: |
us-gaap_EarningsPerShareAbstract |
| Namespace Prefix: |
us-gaap_ |
| Data Type: |
xbrli:stringItemType |
| Balance Type: |
na |
| Period Type: |
duration |
|
v3.24.1.1.u2
| X |
- DefinitionThe difference between the maximum number of shares (or other type of equity) authorized for issuance under the plan (including the effects of amendments and adjustments), and the sum of: 1) the number of shares (or other type of equity) already issued upon exercise of options or other equity-based awards under the plan; and 2) shares (or other type of equity) reserved for issuance on granting of outstanding awards, net of cancellations and forfeitures, if applicable. Reference 1: http://fasb.org/us-gaap/role/ref/legacyRef
-Name Accounting Standards Codification
-Topic 718
-SubTopic 10
-Section 50
-Paragraph 2
-Publisher FASB
-URI https://asc.fasb.org//1943274/2147480429/718-10-50-2
| Name: |
us-gaap_ShareBasedCompensationArrangementByShareBasedPaymentAwardNumberOfSharesAvailableForGrant |
| Namespace Prefix: |
us-gaap_ |
| Data Type: |
xbrli:sharesItemType |
| Balance Type: |
na |
| Period Type: |
instant |
|
| X |
- Details
| Name: |
us-gaap_AwardTypeAxis=cvm_NonQualifiedStockOptionsPlansMember |
| Namespace Prefix: |
|
| Data Type: |
na |
| Balance Type: |
|
| Period Type: |
|
|
| X |
- Details
| Name: |
us-gaap_AwardTypeAxis=cvm_StockBonusPlansMember |
| Namespace Prefix: |
|
| Data Type: |
na |
| Balance Type: |
|
| Period Type: |
|
|
| X |
- Details
| Name: |
us-gaap_AwardTypeAxis=us-gaap_StockCompensationPlanMember |
| Namespace Prefix: |
|
| Data Type: |
na |
| Balance Type: |
|
| Period Type: |
|
|
| X |
- Details
| Name: |
us-gaap_AwardTypeAxis=cvm_IncentiveStockBonusPlansMember |
| Namespace Prefix: |
|
| Data Type: |
na |
| Balance Type: |
|
| Period Type: |
|
|
v3.24.1.1.u2
STOCKHOLDERS EQUITY (Details 1) - shares
|
3 Months Ended |
6 Months Ended |
Mar. 31, 2024 |
Mar. 31, 2023 |
Mar. 31, 2024 |
Mar. 31, 2023 |
| STOCKHOLDERS EQUITY |
|
|
|
|
| Options Granted |
3,000
|
2,000
|
3,000
|
4,500
|
| Options Forfeited |
42,000
|
25,500
|
53,000
|
122,332
|
| Option exercised |
0
|
0
|
0
|
0
|
| Options Expired |
27,035
|
4,000
|
27,035
|
45,404
|
| X |
- References
+ Details
| Name: |
us-gaap_EquityAbstract |
| Namespace Prefix: |
us-gaap_ |
| Data Type: |
xbrli:stringItemType |
| Balance Type: |
na |
| Period Type: |
duration |
|
| X |
- DefinitionNumber of options or other stock instruments for which the right to exercise has lapsed under the terms of the plan agreements. Reference 1: http://www.xbrl.org/2003/role/disclosureRef
-Topic 718
-SubTopic 10
-Name Accounting Standards Codification
-Section 50
-Paragraph 2
-Subparagraph (c)(1)(iv)(04)
-Publisher FASB
-URI https://asc.fasb.org//1943274/2147480429/718-10-50-2
| Name: |
us-gaap_ShareBasedCompensationArrangementByShareBasedPaymentAwardOptionsExpirationsInPeriod |
| Namespace Prefix: |
us-gaap_ |
| Data Type: |
xbrli:sharesItemType |
| Balance Type: |
na |
| Period Type: |
duration |
|
| X |
- DefinitionThe number of shares under options that were cancelled during the reporting period as a result of occurrence of a terminating event specified in contractual agreements pertaining to the stock option plan. Reference 1: http://www.xbrl.org/2003/role/disclosureRef
-Topic 718
-SubTopic 10
-Name Accounting Standards Codification
-Section 50
-Paragraph 2
-Subparagraph (c)(1)(iv)(03)
-Publisher FASB
-URI https://asc.fasb.org//1943274/2147480429/718-10-50-2
| Name: |
us-gaap_ShareBasedCompensationArrangementByShareBasedPaymentAwardOptionsForfeituresInPeriod |
| Namespace Prefix: |
us-gaap_ |
| Data Type: |
xbrli:sharesItemType |
| Balance Type: |
na |
| Period Type: |
duration |
|
| X |
- DefinitionGross number of share options (or share units) granted during the period. Reference 1: http://www.xbrl.org/2003/role/disclosureRef
-Topic 718
-SubTopic 10
-Name Accounting Standards Codification
-Section 50
-Paragraph 2
-Subparagraph (c)(1)(iv)(01)
-Publisher FASB
-URI https://asc.fasb.org//1943274/2147480429/718-10-50-2
| Name: |
us-gaap_ShareBasedCompensationArrangementByShareBasedPaymentAwardOptionsGrantsInPeriodGross |
| Namespace Prefix: |
us-gaap_ |
| Data Type: |
xbrli:sharesItemType |
| Balance Type: |
na |
| Period Type: |
duration |
|
| X |
- DefinitionNumber of shares purchased for issuance under share-based payment arrangement. Reference 1: http://www.xbrl.org/2009/role/commonPracticeRef
-Topic 718
-SubTopic 10
-Name Accounting Standards Codification
-Section 50
-Paragraph 2
-Subparagraph (l)
-Publisher FASB
-URI https://asc.fasb.org//1943274/2147480429/718-10-50-2
| Name: |
us-gaap_ShareBasedCompensationArrangementByShareBasedPaymentAwardSharesPurchasedForAward |
| Namespace Prefix: |
us-gaap_ |
| Data Type: |
xbrli:sharesItemType |
| Balance Type: |
na |
| Period Type: |
duration |
|
v3.24.1.1.u2
STOCKHOLDERS EQUITY (Details 2) - USD ($)
|
3 Months Ended |
6 Months Ended |
Mar. 31, 2024 |
Mar. 31, 2023 |
Mar. 31, 2024 |
Mar. 31, 2023 |
| Employees |
|
|
|
|
| Stock Based Compensation Expense |
$ 1,432,540
|
$ 1,743,288
|
$ 2,816,449
|
$ 3,436,119
|
| Non-employees |
|
|
|
|
| Stock Based Compensation Expense |
$ 151,777
|
$ 136,864
|
$ 370,163
|
$ 285,722
|
| X |
- DefinitionAmount of cost capitalized for award under share-based payment arrangement. Reference 1: http://www.xbrl.org/2003/role/disclosureRef
-Topic 718
-SubTopic 10
-Name Accounting Standards Codification
-Section 50
-Paragraph 2
-Subparagraph (h)(1)(ii)
-Publisher FASB
-URI https://asc.fasb.org//1943274/2147480429/718-10-50-2
| Name: |
us-gaap_EmployeeServiceShareBasedCompensationAllocationOfRecognizedPeriodCostsCapitalizedAmount |
| Namespace Prefix: |
us-gaap_ |
| Data Type: |
xbrli:monetaryItemType |
| Balance Type: |
debit |
| Period Type: |
duration |
|
| X |
- Details
| Name: |
us-gaap_SubsidiarySaleOfStockAxis=us-gaap_EmployeeStockMember |
| Namespace Prefix: |
|
| Data Type: |
na |
| Balance Type: |
|
| Period Type: |
|
|
| X |
- Details
| Name: |
us-gaap_SubsidiarySaleOfStockAxis=cvm_NonEmployeesMember |
| Namespace Prefix: |
|
| Data Type: |
na |
| Balance Type: |
|
| Period Type: |
|
|
v3.24.1.1.u2
STOCKHOLDERS EQUITY (Details 3) - $ / shares
|
6 Months Ended |
|
Mar. 31, 2024 |
Dec. 31, 2023 |
| Consultants Options [Member] |
|
|
| Shares Issuable Upon Exercise Of Warrant/options |
|
110,000
|
| Exercise Price |
|
$ 2.18
|
| Minimum [Member] | Consultants [Member] |
|
|
| Issue Date |
7/28/2017
|
|
| Exercise Price |
|
$ 1.39
|
| Expiration Date |
7/27/2027
|
|
| Maximum [Member] | Consultants [Member] |
|
|
| Issue Date |
9/2/2023
|
|
| Expiration Date |
9/1/2028
|
|
| Series N [Member] |
|
|
| Issue Date |
8/18/2008
|
|
| Shares Issuable Upon Exercise Of Warrant/options |
|
85,339
|
| Exercise Price |
|
$ 3.00
|
| Expiration Date |
8/18/2024
|
|
| Series UU [Member] |
|
|
| Issue Date |
6/11/2018
|
|
| Shares Issuable Upon Exercise Of Warrant/options |
|
93,603
|
| Exercise Price |
|
$ 2.80
|
| Expiration Date |
6/30/2024
|
|
| Series X [Member] |
|
|
| Issue Date |
1/13/2016
|
|
| Shares Issuable Upon Exercise Of Warrant/options |
|
120,000
|
| Exercise Price |
|
$ 9.25
|
| Expiration Date |
7/13/2024
|
|
| Series Y [Member] |
|
|
| Issue Date |
2/15/2016
|
|
| Shares Issuable Upon Exercise Of Warrant/options |
|
26,000
|
| Exercise Price |
|
$ 12.00
|
| Expiration Date |
8/15/2024
|
|
| Series MM [Member] |
|
|
| Issue Date |
6/22/2017
|
|
| Shares Issuable Upon Exercise Of Warrant/options |
|
333,432
|
| Exercise Price |
|
$ 1.86
|
| Expiration Date |
6/22/2024
|
|
| Series NN [Member] |
|
|
| Issue Date |
7/24/2017
|
|
| Shares Issuable Upon Exercise Of Warrant/options |
|
200,087
|
| Exercise Price |
|
$ 2.52
|
| Expiration Date |
7/24/2024
|
|
| Series RR [Member] |
|
|
| Issue Date |
10/30/2017
|
|
| Shares Issuable Upon Exercise Of Warrant/options |
|
234,009
|
| Exercise Price |
|
$ 1.65
|
| Expiration Date |
10/30/2024
|
|
| X |
- References
+ Details
| Name: |
cvm_ExercisePrice |
| Namespace Prefix: |
cvm_ |
| Data Type: |
num:perShareItemType |
| Balance Type: |
na |
| Period Type: |
instant |
|
| X |
- References
+ Details
| Name: |
cvm_ExpirationDate |
| Namespace Prefix: |
cvm_ |
| Data Type: |
xbrli:stringItemType |
| Balance Type: |
na |
| Period Type: |
duration |
|
| X |
- References
+ Details
| Name: |
cvm_IssueDate1 |
| Namespace Prefix: |
cvm_ |
| Data Type: |
xbrli:stringItemType |
| Balance Type: |
na |
| Period Type: |
duration |
|
| X |
- References
+ Details
| Name: |
cvm_SharesIssuableUponExerciseOfWarrantOptions |
| Namespace Prefix: |
cvm_ |
| Data Type: |
xbrli:sharesItemType |
| Balance Type: |
na |
| Period Type: |
instant |
|
| X |
- Details
| Name: |
srt_RangeAxis=srt_MinimumMember |
| Namespace Prefix: |
|
| Data Type: |
na |
| Balance Type: |
|
| Period Type: |
|
|
| X |
- Details
| Name: |
srt_RangeAxis=srt_MaximumMember |
| Namespace Prefix: |
|
| Data Type: |
na |
| Balance Type: |
|
| Period Type: |
|
|
| X |
- Details
| Name: |
us-gaap_ClassOfWarrantOrRightAxis=cvm_SeriesNMember |
| Namespace Prefix: |
|
| Data Type: |
na |
| Balance Type: |
|
| Period Type: |
|
|
| X |
- Details
| Name: |
us-gaap_ClassOfWarrantOrRightAxis=cvm_SeriesUUMember |
| Namespace Prefix: |
|
| Data Type: |
na |
| Balance Type: |
|
| Period Type: |
|
|
| X |
- Details
| Name: |
us-gaap_ClassOfWarrantOrRightAxis=cvm_SeriesXMember |
| Namespace Prefix: |
|
| Data Type: |
na |
| Balance Type: |
|
| Period Type: |
|
|
| X |
- Details
| Name: |
us-gaap_ClassOfWarrantOrRightAxis=cvm_SeriesYMember |
| Namespace Prefix: |
|
| Data Type: |
na |
| Balance Type: |
|
| Period Type: |
|
|
| X |
- Details
| Name: |
us-gaap_ClassOfWarrantOrRightAxis=cvm_SeriesMMMember |
| Namespace Prefix: |
|
| Data Type: |
na |
| Balance Type: |
|
| Period Type: |
|
|
| X |
- Details
| Name: |
us-gaap_ClassOfWarrantOrRightAxis=cvm_SeriesNNMember |
| Namespace Prefix: |
|
| Data Type: |
na |
| Balance Type: |
|
| Period Type: |
|
|
| X |
- Details
| Name: |
us-gaap_ClassOfWarrantOrRightAxis=cvm_SeriesRRMember |
| Namespace Prefix: |
|
| Data Type: |
na |
| Balance Type: |
|
| Period Type: |
|
|
v3.24.1.1.u2
| X |
- References
+ Details
| Name: |
cvm_EquityWarrantsExercisePrice |
| Namespace Prefix: |
cvm_ |
| Data Type: |
num:perShareItemType |
| Balance Type: |
na |
| Period Type: |
duration |
|
| X |
- References
+ Details
| Name: |
cvm_EquityWarrantsExercised |
| Namespace Prefix: |
cvm_ |
| Data Type: |
xbrli:sharesItemType |
| Balance Type: |
na |
| Period Type: |
duration |
|
| X |
- References
+ Details
| Name: |
cvm_ProceedsFromEquityWarrantsExercised |
| Namespace Prefix: |
cvm_ |
| Data Type: |
xbrli:monetaryItemType |
| Balance Type: |
debit |
| Period Type: |
duration |
|
| X |
- Details
| Name: |
us-gaap_ClassOfWarrantOrRightAxis=cvm_SeriesRRMember |
| Namespace Prefix: |
|
| Data Type: |
na |
| Balance Type: |
|
| Period Type: |
|
|
| X |
- Details
| Name: |
us-gaap_ClassOfWarrantOrRightAxis=cvm_SeriesSSMember |
| Namespace Prefix: |
|
| Data Type: |
na |
| Balance Type: |
|
| Period Type: |
|
|
v3.24.1.1.u2
STOCKHOLDERS EQUITY (Details Narrative) - USD ($)
|
1 Months Ended |
3 Months Ended |
6 Months Ended |
|
Feb. 29, 2024 |
Nov. 30, 2023 |
Oct. 28, 2023 |
Oct. 28, 2022 |
Mar. 31, 2024 |
Mar. 31, 2023 |
Mar. 31, 2024 |
Mar. 31, 2023 |
Sep. 30, 2023 |
| Incremental cost |
|
|
$ 172,000
|
|
|
|
|
|
|
| Common stock shares issued |
3,875,000
|
2,490,000
|
|
|
54,083,718
|
|
54,083,718
|
|
47,422,304
|
| Public offering price |
$ 2
|
$ 2
|
|
|
|
|
|
|
|
| Proceeds from issuance of common stock |
$ 7,000,000
|
$ 4,500,000
|
|
|
|
|
$ 12,730,000
|
$ 0
|
|
| Net of issuance costs |
$ 700,000
|
$ 500,000
|
|
|
|
|
|
|
|
| Amortization Cost |
|
|
|
|
|
|
$ 260,000
|
|
|
| Stock options |
|
|
|
|
$ 234,332
|
|
|
|
|
| Consulting Agreements [Member] |
|
|
|
|
|
|
|
|
|
| Weighted average grant date fair value |
|
|
|
|
|
|
$ 1.99
|
$ 2.47
|
|
| Options issued |
|
|
|
|
|
|
5,000
|
|
|
| Exercise price |
|
|
|
|
|
|
$ 11.61
|
|
|
| Consulting fees inclued prepaid expenses |
|
|
|
|
351,000
|
|
$ 351,000
|
|
$ 205,000
|
| Total expense |
|
|
|
|
$ 152,000
|
$ 136,000
|
$ 370,000
|
$ 285,000
|
|
| Restricted Stock [Member] | Consultants [Member] |
|
|
|
|
|
|
|
|
|
| Weighted average grant date fair value |
|
|
|
|
$ 2.22
|
$ 2.42
|
$ 2.24
|
|
|
| Common stock issued for service, shares |
|
|
|
|
162,744
|
38,562
|
251,317
|
78,798
|
|
| Series RR [Member] |
|
|
|
|
|
|
|
|
|
| Incremental cost |
|
|
|
$ 172,000
|
|
|
|
|
|
| X |
- References
+ Details
| Name: |
cvm_ConsultingFeesIncluedPrepaidExpenses |
| Namespace Prefix: |
cvm_ |
| Data Type: |
xbrli:monetaryItemType |
| Balance Type: |
debit |
| Period Type: |
instant |
|
| X |
- References
+ Details
| Name: |
cvm_IncrementalCostDeemedDividend |
| Namespace Prefix: |
cvm_ |
| Data Type: |
xbrli:monetaryItemType |
| Balance Type: |
debit |
| Period Type: |
duration |
|
| X |
- References
+ Details
| Name: |
cvm_NetofissuanceCosts |
| Namespace Prefix: |
cvm_ |
| Data Type: |
xbrli:monetaryItemType |
| Balance Type: |
credit |
| Period Type: |
duration |
|
| X |
- DefinitionAmount of expense for award under share-based payment arrangement. Excludes amount capitalized. Reference 1: http://www.xbrl.org/2003/role/disclosureRef
-Topic 718
-SubTopic 10
-Name Accounting Standards Codification
-Section S99
-Paragraph 1
-Subparagraph (SAB Topic 14.F)
-Publisher FASB
-URI https://asc.fasb.org//1943274/2147479830/718-10-S99-1
Reference 2: http://www.xbrl.org/2003/role/disclosureRef
-Topic 718
-SubTopic 10
-Name Accounting Standards Codification
-Section 50
-Paragraph 2
-Subparagraph (h)(1)(i)
-Publisher FASB
-URI https://asc.fasb.org//1943274/2147480429/718-10-50-2
| Name: |
us-gaap_AllocatedShareBasedCompensationExpense |
| Namespace Prefix: |
us-gaap_ |
| Data Type: |
xbrli:monetaryItemType |
| Balance Type: |
debit |
| Period Type: |
duration |
|
| X |
- DefinitionAmount of amortization expense attributable to debt issuance costs. Reference 1: http://www.xbrl.org/2003/role/disclosureRef
-Topic 470
-SubTopic 20
-Name Accounting Standards Codification
-Section 50
-Paragraph 1F
-Subparagraph (b)(2)
-Publisher FASB
-URI https://asc.fasb.org//1943274/2147481139/470-20-50-1F
Reference 2: http://www.xbrl.org/2009/role/commonPracticeRef
-Topic 230
-SubTopic 10
-Name Accounting Standards Codification
-Section 45
-Paragraph 28
-Subparagraph (b)
-Publisher FASB
-URI https://asc.fasb.org//1943274/2147482740/230-10-45-28
Reference 3: http://www.xbrl.org/2003/role/disclosureRef
-Topic 835
-SubTopic 30
-Name Accounting Standards Codification
-Section 45
-Paragraph 3
-Publisher FASB
-URI https://asc.fasb.org//1943274/2147482925/835-30-45-3
Reference 4: http://fasb.org/us-gaap/role/ref/legacyRef
-Topic 220
-SubTopic 10
-Name Accounting Standards Codification
-Section S99
-Paragraph 2
-Subparagraph (SX 210.5-03(8))
-Publisher FASB
-URI https://asc.fasb.org//1943274/2147483621/220-10-S99-2
| Name: |
us-gaap_AmortizationOfFinancingCosts |
| Namespace Prefix: |
us-gaap_ |
| Data Type: |
xbrli:monetaryItemType |
| Balance Type: |
debit |
| Period Type: |
duration |
|
| X |
- DefinitionTotal number of common shares of an entity that have been sold or granted to shareholders (includes common shares that were issued, repurchased and remain in the treasury). These shares represent capital invested by the firm's shareholders and owners, and may be all or only a portion of the number of shares authorized. Shares issued include shares outstanding and shares held in the treasury. Reference 1: http://fasb.org/us-gaap/role/ref/legacyRef
-Topic 210
-SubTopic 10
-Name Accounting Standards Codification
-Section S99
-Paragraph 1
-Subparagraph (SX 210.5-02(29))
-Publisher FASB
-URI https://asc.fasb.org//1943274/2147480566/210-10-S99-1
| Name: |
us-gaap_CommonStockSharesIssued |
| Namespace Prefix: |
us-gaap_ |
| Data Type: |
xbrli:sharesItemType |
| Balance Type: |
na |
| Period Type: |
instant |
|
| X |
- DefinitionThe number of options issued as [noncash or part noncash] consideration for a business or asset acquired. Noncash is defined as transactions during a period that affect recognized assets or liabilities but that do not result in cash receipts or cash payments in the period. "Part noncash" refers to that portion of the transaction not resulting in cash receipts or cash payments in the period. Reference 1: http://fasb.org/us-gaap/role/ref/legacyRef
-Name Accounting Standards Codification
-Topic 230
-SubTopic 10
-Section 50
-Paragraph 4
-Publisher FASB
-URI https://asc.fasb.org//1943274/2147482913/230-10-50-4
Reference 2: http://fasb.org/us-gaap/role/ref/legacyRef
-Name Accounting Standards Codification
-Topic 230
-SubTopic 10
-Section 50
-Paragraph 3
-Publisher FASB
-URI https://asc.fasb.org//1943274/2147482913/230-10-50-3
Reference 3: http://fasb.org/us-gaap/role/ref/legacyRef
-Name Accounting Standards Codification
-Topic 230
-SubTopic 10
-Section 50
-Paragraph 5
-Publisher FASB
-URI https://asc.fasb.org//1943274/2147482913/230-10-50-5
| Name: |
us-gaap_NoncashOrPartNoncashAcquisitionNoncashFinancialOrEquityInstrumentConsiderationOptionsIssued1 |
| Namespace Prefix: |
us-gaap_ |
| Data Type: |
xbrli:sharesItemType |
| Balance Type: |
na |
| Period Type: |
duration |
|
| X |
- DefinitionThe cash inflow from the additional capital contribution to the entity. Reference 1: http://fasb.org/us-gaap/role/ref/legacyRef
-Name Accounting Standards Codification
-Section 45
-Paragraph 14
-Subparagraph (a)
-SubTopic 10
-Topic 230
-Publisher FASB
-URI https://asc.fasb.org//1943274/2147482740/230-10-45-14
| Name: |
us-gaap_ProceedsFromIssuanceOfCommonStock |
| Namespace Prefix: |
us-gaap_ |
| Data Type: |
xbrli:monetaryItemType |
| Balance Type: |
debit |
| Period Type: |
duration |
|
| X |
- DefinitionPer share amount received by subsidiary or equity investee for each share of common stock issued or sold in the stock transaction.
| Name: |
us-gaap_SaleOfStockPricePerShare |
| Namespace Prefix: |
us-gaap_ |
| Data Type: |
dtr-types:perShareItemType |
| Balance Type: |
na |
| Period Type: |
instant |
|
| X |
- DefinitionThe weighted average grant-date fair value of options granted during the reporting period as calculated by applying the disclosed option pricing methodology. Reference 1: http://www.xbrl.org/2003/role/disclosureRef
-Topic 718
-SubTopic 10
-Name Accounting Standards Codification
-Section 50
-Paragraph 2
-Subparagraph (d)(1)
-Publisher FASB
-URI https://asc.fasb.org//1943274/2147480429/718-10-50-2
| Name: |
us-gaap_ShareBasedCompensationArrangementByShareBasedPaymentAwardOptionsGrantsInPeriodWeightedAverageGrantDateFairValue |
| Namespace Prefix: |
us-gaap_ |
| Data Type: |
dtr-types:perShareItemType |
| Balance Type: |
na |
| Period Type: |
duration |
|
| X |
- DefinitionWeighted average price at which option holders acquired shares when converting their stock options into shares. Reference 1: http://www.xbrl.org/2003/role/disclosureRef
-Topic 718
-SubTopic 10
-Name Accounting Standards Codification
-Section 50
-Paragraph 2
-Subparagraph (c)(1)(iv)(02)
-Publisher FASB
-URI https://asc.fasb.org//1943274/2147480429/718-10-50-2
| Name: |
us-gaap_ShareBasedCompensationArrangementsByShareBasedPaymentAwardOptionsExercisesInPeriodWeightedAverageExercisePrice |
| Namespace Prefix: |
us-gaap_ |
| Data Type: |
dtr-types:perShareItemType |
| Balance Type: |
na |
| Period Type: |
duration |
|
| X |
- DefinitionNumber of shares issued in lieu of cash for services contributed to the entity. Number of shares includes, but is not limited to, shares issued for services contributed by vendors and founders.
| Name: |
us-gaap_StockIssuedDuringPeriodSharesIssuedForServices |
| Namespace Prefix: |
us-gaap_ |
| Data Type: |
xbrli:sharesItemType |
| Balance Type: |
na |
| Period Type: |
duration |
|
| X |
- DefinitionAmount of noncash expense for option under share-based payment arrangement. Reference 1: http://fasb.org/us-gaap/role/ref/legacyRef
-Name Accounting Standards Codification
-Section 45
-Paragraph 28
-Subparagraph (b)
-SubTopic 10
-Topic 230
-Publisher FASB
-URI https://asc.fasb.org//1943274/2147482740/230-10-45-28
| Name: |
us-gaap_StockOptionPlanExpense |
| Namespace Prefix: |
us-gaap_ |
| Data Type: |
xbrli:monetaryItemType |
| Balance Type: |
debit |
| Period Type: |
duration |
|
| X |
- Details
| Name: |
us-gaap_PlanNameAxis=cvm_ConsultingAgreementsMember |
| Namespace Prefix: |
|
| Data Type: |
na |
| Balance Type: |
|
| Period Type: |
|
|
| X |
- Details
| Name: |
us-gaap_AntidilutiveSecuritiesExcludedFromComputationOfEarningsPerShareByAntidilutiveSecuritiesAxis=cvm_RestrictedStocksMember |
| Namespace Prefix: |
|
| Data Type: |
na |
| Balance Type: |
|
| Period Type: |
|
|
| X |
- Details
| Name: |
us-gaap_ClassOfWarrantOrRightAxis=cvm_SeriesRRMember |
| Namespace Prefix: |
|
| Data Type: |
na |
| Balance Type: |
|
| Period Type: |
|
|
v3.24.1.1.u2
| X |
- References
+ Details
| Name: |
cvm_IncrementalCostDeemedDividend |
| Namespace Prefix: |
cvm_ |
| Data Type: |
xbrli:monetaryItemType |
| Balance Type: |
debit |
| Period Type: |
duration |
|
v3.24.1.1.u2
COMMITMENTS AND CONTINGENCIES (Details)
|
Mar. 31, 2024
USD ($)
|
| COMMITMENTS AND CONTINGENCIES |
|
| Three months ending September 30, 2024 |
$ 1,333,000
|
| 2025 |
2,747,000
|
| 2026 |
2,838,000
|
| 2027 |
2,929,000
|
| 2028 |
3,021,000
|
| 2029 |
255,000
|
| Total future minimum lease obligation |
13,123,000
|
| Less imputed interest on finance lease obligations |
(2,247,000)
|
| Net present value of financing lease obligations |
10,876,000
|
| Less net present value of financing lease obligations - current portion |
(1,889,000)
|
| Net present value of financing lease obligations - non-current portion |
$ 8,987,000
|
| X |
- References
+ Details
| Name: |
cvm_CommitmentsAndContingenciesAbstract |
| Namespace Prefix: |
cvm_ |
| Data Type: |
xbrli:stringItemType |
| Balance Type: |
na |
| Period Type: |
duration |
|
| X |
- References
+ Details
| Name: |
cvm_FinanceLeaseLiabilityCurrentPortion |
| Namespace Prefix: |
cvm_ |
| Data Type: |
xbrli:monetaryItemType |
| Balance Type: |
credit |
| Period Type: |
instant |
|
| X |
- References
+ Details
| Name: |
cvm_FinanceLeaseLiabilityNoncurrentPortion |
| Namespace Prefix: |
cvm_ |
| Data Type: |
xbrli:monetaryItemType |
| Balance Type: |
credit |
| Period Type: |
instant |
|
| X |
- DefinitionPresent value of lessee's discounted obligation for lease payments from finance lease. Reference 1: http://www.xbrl.org/2003/role/disclosureRef
-Topic 842
-SubTopic 20
-Name Accounting Standards Codification
-Section 50
-Paragraph 6
-Publisher FASB
-URI https://asc.fasb.org//1943274/2147478964/842-20-50-6
Reference 2: http://www.xbrl.org/2003/role/disclosureRef
-Topic 842
-SubTopic 20
-Name Accounting Standards Codification
-Section 45
-Paragraph 1
-Subparagraph (b)
-Publisher FASB
-URI https://asc.fasb.org//1943274/2147479041/842-20-45-1
| Name: |
us-gaap_FinanceLeaseLiability |
| Namespace Prefix: |
us-gaap_ |
| Data Type: |
xbrli:monetaryItemType |
| Balance Type: |
credit |
| Period Type: |
instant |
|
| X |
- DefinitionAmount of lessee's undiscounted obligation for lease payments for finance lease. Reference 1: http://www.xbrl.org/2003/role/disclosureRef
-Topic 842
-SubTopic 20
-Name Accounting Standards Codification
-Section 50
-Paragraph 6
-Publisher FASB
-URI https://asc.fasb.org//1943274/2147478964/842-20-50-6
| Name: |
us-gaap_FinanceLeaseLiabilityPaymentsDue |
| Namespace Prefix: |
us-gaap_ |
| Data Type: |
xbrli:monetaryItemType |
| Balance Type: |
credit |
| Period Type: |
instant |
|
| X |
- DefinitionAmount of lessee's undiscounted obligation for lease payment for finance lease to be paid in next fiscal year following current fiscal year. Excludes interim and annual periods when interim periods are reported from current statement of financial position date (rolling approach). Reference 1: http://www.xbrl.org/2003/role/disclosureRef
-Topic 842
-SubTopic 20
-Name Accounting Standards Codification
-Section 50
-Paragraph 6
-Publisher FASB
-URI https://asc.fasb.org//1943274/2147478964/842-20-50-6
| Name: |
us-gaap_FinanceLeaseLiabilityPaymentsDueNextTwelveMonths |
| Namespace Prefix: |
us-gaap_ |
| Data Type: |
xbrli:monetaryItemType |
| Balance Type: |
credit |
| Period Type: |
instant |
|
| X |
- DefinitionAmount of lessee's undiscounted obligation for lease payment for finance lease to be paid in fifth fiscal year following current fiscal year. Excludes interim and annual periods when interim periods are reported from current statement of financial position date (rolling approach). Reference 1: http://www.xbrl.org/2003/role/disclosureRef
-Topic 842
-SubTopic 20
-Name Accounting Standards Codification
-Section 50
-Paragraph 6
-Publisher FASB
-URI https://asc.fasb.org//1943274/2147478964/842-20-50-6
| Name: |
us-gaap_FinanceLeaseLiabilityPaymentsDueYearFive |
| Namespace Prefix: |
us-gaap_ |
| Data Type: |
xbrli:monetaryItemType |
| Balance Type: |
credit |
| Period Type: |
instant |
|
| X |
- DefinitionAmount of lessee's undiscounted obligation for lease payment for finance lease to be paid in fourth fiscal year following current fiscal year. Excludes interim and annual periods when interim periods are reported from current statement of financial position date (rolling approach). Reference 1: http://www.xbrl.org/2003/role/disclosureRef
-Topic 842
-SubTopic 20
-Name Accounting Standards Codification
-Section 50
-Paragraph 6
-Publisher FASB
-URI https://asc.fasb.org//1943274/2147478964/842-20-50-6
| Name: |
us-gaap_FinanceLeaseLiabilityPaymentsDueYearFour |
| Namespace Prefix: |
us-gaap_ |
| Data Type: |
xbrli:monetaryItemType |
| Balance Type: |
credit |
| Period Type: |
instant |
|
| X |
- DefinitionAmount of lessee's undiscounted obligation for lease payment for finance lease to be paid in third fiscal year following current fiscal year. Excludes interim and annual periods when interim periods are reported from current statement of financial position date (rolling approach). Reference 1: http://www.xbrl.org/2003/role/disclosureRef
-Topic 842
-SubTopic 20
-Name Accounting Standards Codification
-Section 50
-Paragraph 6
-Publisher FASB
-URI https://asc.fasb.org//1943274/2147478964/842-20-50-6
| Name: |
us-gaap_FinanceLeaseLiabilityPaymentsDueYearThree |
| Namespace Prefix: |
us-gaap_ |
| Data Type: |
xbrli:monetaryItemType |
| Balance Type: |
credit |
| Period Type: |
instant |
|
| X |
- DefinitionAmount of lessee's undiscounted obligation for lease payment for finance lease to be paid in second fiscal year following current fiscal year. Excludes interim and annual periods when interim periods are reported from current statement of financial position date (rolling approach). Reference 1: http://www.xbrl.org/2003/role/disclosureRef
-Topic 842
-SubTopic 20
-Name Accounting Standards Codification
-Section 50
-Paragraph 6
-Publisher FASB
-URI https://asc.fasb.org//1943274/2147478964/842-20-50-6
| Name: |
us-gaap_FinanceLeaseLiabilityPaymentsDueYearTwo |
| Namespace Prefix: |
us-gaap_ |
| Data Type: |
xbrli:monetaryItemType |
| Balance Type: |
credit |
| Period Type: |
instant |
|
| X |
- DefinitionAmount of lessee's undiscounted obligation for lease payment for finance lease to be paid in remainder of current fiscal year. Reference 1: http://www.xbrl.org/2009/role/commonPracticeRef
-Topic 842
-SubTopic 20
-Name Accounting Standards Codification
-Section 50
-Paragraph 6
-Publisher FASB
-URI https://asc.fasb.org//1943274/2147478964/842-20-50-6
| Name: |
us-gaap_FinanceLeaseLiabilityPaymentsRemainderOfFiscalYear |
| Namespace Prefix: |
us-gaap_ |
| Data Type: |
xbrli:monetaryItemType |
| Balance Type: |
credit |
| Period Type: |
instant |
|
| X |
- DefinitionAmount of lessee's undiscounted obligation for lease payments in excess of discounted obligation for lease payments for finance lease. Reference 1: http://www.xbrl.org/2003/role/disclosureRef
-Topic 842
-SubTopic 20
-Name Accounting Standards Codification
-Section 50
-Paragraph 6
-Publisher FASB
-URI https://asc.fasb.org//1943274/2147478964/842-20-50-6
| Name: |
us-gaap_FinanceLeaseLiabilityUndiscountedExcessAmount |
| Namespace Prefix: |
us-gaap_ |
| Data Type: |
xbrli:monetaryItemType |
| Balance Type: |
credit |
| Period Type: |
instant |
|
v3.24.1.1.u2
COMMITMENTS AND CONTINGENCIES (Details 1)
|
Mar. 31, 2024
USD ($)
|
| COMMITMENTS AND CONTINGENCIES |
|
| Three months ending September 30, 2024 |
$ 180,000
|
| 2025 |
366,000
|
| 2026 |
287,000
|
| 2027 |
277,000
|
| 2028 |
285,000
|
| 2029 |
294,000
|
| Thereafter |
746,000
|
| Total Future Minimum Lease Obligation |
2,435,000
|
| Less Imputed Interest On Operating Lease Obligation |
(680,000)
|
| Net Present Value Of Operating Lease Obligation |
1,755,000
|
| Net present value of lease finance lease obligations - current portion |
(211,000)
|
| Net present value of lease finance lease obligations - non-current portion |
$ 1,544,000
|
| X |
- References
+ Details
| Name: |
cvm_CommitmentsAndContingenciesAbstract |
| Namespace Prefix: |
cvm_ |
| Data Type: |
xbrli:stringItemType |
| Balance Type: |
na |
| Period Type: |
duration |
|
| X |
- References
+ Details
| Name: |
cvm_OperatingLeaseLiabilityCurrentPortion |
| Namespace Prefix: |
cvm_ |
| Data Type: |
xbrli:monetaryItemType |
| Balance Type: |
credit |
| Period Type: |
instant |
|
| X |
- References
+ Details
| Name: |
cvm_OperatingLeaseLiabilityNoncurrentPortion |
| Namespace Prefix: |
cvm_ |
| Data Type: |
xbrli:monetaryItemType |
| Balance Type: |
credit |
| Period Type: |
instant |
|
| X |
- DefinitionAmount of lessee's undiscounted obligation for lease payment for operating lease. Reference 1: http://www.xbrl.org/2003/role/disclosureRef
-Topic 842
-SubTopic 20
-Name Accounting Standards Codification
-Section 50
-Paragraph 6
-Publisher FASB
-URI https://asc.fasb.org//1943274/2147478964/842-20-50-6
| Name: |
us-gaap_LesseeOperatingLeaseLiabilityPaymentsDue |
| Namespace Prefix: |
us-gaap_ |
| Data Type: |
xbrli:monetaryItemType |
| Balance Type: |
credit |
| Period Type: |
instant |
|
| X |
- DefinitionAmount of lessee's undiscounted obligation for lease payment for operating lease due after fifth fiscal year following current fiscal year. Excludes interim and annual periods when interim periods are reported from current statement of financial position date (rolling approach). Reference 1: http://www.xbrl.org/2003/role/disclosureRef
-Topic 842
-SubTopic 20
-Name Accounting Standards Codification
-Section 50
-Paragraph 6
-Publisher FASB
-URI https://asc.fasb.org//1943274/2147478964/842-20-50-6
| Name: |
us-gaap_LesseeOperatingLeaseLiabilityPaymentsDueAfterYearFive |
| Namespace Prefix: |
us-gaap_ |
| Data Type: |
xbrli:monetaryItemType |
| Balance Type: |
credit |
| Period Type: |
instant |
|
| X |
- DefinitionAmount of lessee's undiscounted obligation for lease payment for operating lease to be paid in next fiscal year following current fiscal year. Excludes interim and annual periods when interim periods are reported from current statement of financial position date (rolling approach). Reference 1: http://www.xbrl.org/2003/role/disclosureRef
-Topic 842
-SubTopic 20
-Name Accounting Standards Codification
-Section 50
-Paragraph 6
-Publisher FASB
-URI https://asc.fasb.org//1943274/2147478964/842-20-50-6
| Name: |
us-gaap_LesseeOperatingLeaseLiabilityPaymentsDueNextTwelveMonths |
| Namespace Prefix: |
us-gaap_ |
| Data Type: |
xbrli:monetaryItemType |
| Balance Type: |
credit |
| Period Type: |
instant |
|
| X |
- DefinitionAmount of lessee's undiscounted obligation for lease payment for operating lease to be paid in fifth fiscal year following current fiscal year. Excludes interim and annual periods when interim periods are reported from current statement of financial position date (rolling approach). Reference 1: http://www.xbrl.org/2003/role/disclosureRef
-Topic 842
-SubTopic 20
-Name Accounting Standards Codification
-Section 50
-Paragraph 6
-Publisher FASB
-URI https://asc.fasb.org//1943274/2147478964/842-20-50-6
| Name: |
us-gaap_LesseeOperatingLeaseLiabilityPaymentsDueYearFive |
| Namespace Prefix: |
us-gaap_ |
| Data Type: |
xbrli:monetaryItemType |
| Balance Type: |
credit |
| Period Type: |
instant |
|
| X |
- DefinitionAmount of lessee's undiscounted obligation for lease payment for operating lease to be paid in fourth fiscal year following current fiscal year. Excludes interim and annual periods when interim periods are reported from current statement of financial position date (rolling approach). Reference 1: http://www.xbrl.org/2003/role/disclosureRef
-Topic 842
-SubTopic 20
-Name Accounting Standards Codification
-Section 50
-Paragraph 6
-Publisher FASB
-URI https://asc.fasb.org//1943274/2147478964/842-20-50-6
| Name: |
us-gaap_LesseeOperatingLeaseLiabilityPaymentsDueYearFour |
| Namespace Prefix: |
us-gaap_ |
| Data Type: |
xbrli:monetaryItemType |
| Balance Type: |
credit |
| Period Type: |
instant |
|
| X |
- DefinitionAmount of lessee's undiscounted obligation for lease payment for operating lease to be paid in third fiscal year following current fiscal year. Excludes interim and annual periods when interim periods are reported from current statement of financial position date (rolling approach). Reference 1: http://www.xbrl.org/2003/role/disclosureRef
-Topic 842
-SubTopic 20
-Name Accounting Standards Codification
-Section 50
-Paragraph 6
-Publisher FASB
-URI https://asc.fasb.org//1943274/2147478964/842-20-50-6
| Name: |
us-gaap_LesseeOperatingLeaseLiabilityPaymentsDueYearThree |
| Namespace Prefix: |
us-gaap_ |
| Data Type: |
xbrli:monetaryItemType |
| Balance Type: |
credit |
| Period Type: |
instant |
|
| X |
- DefinitionAmount of lessee's undiscounted obligation for lease payment for operating lease to be paid in second fiscal year following current fiscal year. Excludes interim and annual periods when interim periods are reported from current statement of financial position date (rolling approach). Reference 1: http://www.xbrl.org/2003/role/disclosureRef
-Topic 842
-SubTopic 20
-Name Accounting Standards Codification
-Section 50
-Paragraph 6
-Publisher FASB
-URI https://asc.fasb.org//1943274/2147478964/842-20-50-6
| Name: |
us-gaap_LesseeOperatingLeaseLiabilityPaymentsDueYearTwo |
| Namespace Prefix: |
us-gaap_ |
| Data Type: |
xbrli:monetaryItemType |
| Balance Type: |
credit |
| Period Type: |
instant |
|
| X |
- DefinitionAmount of lessee's undiscounted obligation for lease payment for operating lease having initial or remaining lease term in excess of one year to be paid in remainder of current fiscal year. Reference 1: http://www.xbrl.org/2009/role/commonPracticeRef
-Topic 842
-SubTopic 20
-Name Accounting Standards Codification
-Section 50
-Paragraph 6
-Publisher FASB
-URI https://asc.fasb.org//1943274/2147478964/842-20-50-6
| Name: |
us-gaap_LesseeOperatingLeaseLiabilityPaymentsRemainderOfFiscalYear |
| Namespace Prefix: |
us-gaap_ |
| Data Type: |
xbrli:monetaryItemType |
| Balance Type: |
credit |
| Period Type: |
instant |
|
| X |
- DefinitionAmount of lessee's undiscounted obligation for lease payments in excess of discounted obligation for lease payments for operating lease. Reference 1: http://www.xbrl.org/2003/role/disclosureRef
-Topic 842
-SubTopic 20
-Name Accounting Standards Codification
-Section 50
-Paragraph 6
-Publisher FASB
-URI https://asc.fasb.org//1943274/2147478964/842-20-50-6
| Name: |
us-gaap_LesseeOperatingLeaseLiabilityUndiscountedExcessAmount |
| Namespace Prefix: |
us-gaap_ |
| Data Type: |
xbrli:monetaryItemType |
| Balance Type: |
credit |
| Period Type: |
instant |
|
| X |
- DefinitionPresent value of lessee's discounted obligation for lease payments from operating lease. Reference 1: http://www.xbrl.org/2003/role/disclosureRef
-Topic 842
-SubTopic 20
-Name Accounting Standards Codification
-Section 45
-Paragraph 1
-Subparagraph (b)
-Publisher FASB
-URI https://asc.fasb.org//1943274/2147479041/842-20-45-1
| Name: |
us-gaap_OperatingLeaseLiability |
| Namespace Prefix: |
us-gaap_ |
| Data Type: |
xbrli:monetaryItemType |
| Balance Type: |
credit |
| Period Type: |
instant |
|
v3.24.1.1.u2
COMMITMENTS AND CONTINGENCIES (Details Narrative) - USD ($)
|
|
3 Months Ended |
6 Months Ended |
|
Jan. 11, 2023 |
Mar. 31, 2024 |
Mar. 31, 2024 |
Mar. 31, 2023 |
Dec. 31, 2023 |
| Net Of Discount |
|
|
$ 1,190,000
|
$ 11,900,000.0
|
|
| Total cash payment for financing lease |
|
|
1,300,000
|
|
|
| Interest amount |
|
|
$ 500,000
|
600,000
|
|
| Weighted average time of maturity of financing lease |
|
|
4 years 7 months 2 days
|
|
|
| Lease expense for operating leases |
|
|
$ 200,000
|
|
|
| Total cash payment for oprating lease |
|
|
$ 200,000
|
|
|
| Weighted average discount rate of financing lease |
|
8.46%
|
8.46%
|
|
3.00%
|
| Weighted average time of maturity of operating leases |
|
4 years 7 months 2 days
|
7 years 4 months 6 days
|
|
|
| Research And Development Expenses |
|
|
$ 3,580,000
|
|
|
| Weighted Average Discount Rate Operating Lease |
|
9.03%
|
9.03%
|
|
|
| Landlord [Member] |
|
|
|
|
|
| Financing arrangement deposit base rent amount |
$ 2,300,000
|
|
|
|
|
| Ergomed [Member] |
|
|
|
|
|
| Net Of Discount |
|
$ 100,000
|
|
$ 11,900,000.0
|
|
| Research And Development Expenses |
|
$ 100,000
|
|
|
|
| Clinical Service Trial |
|
|
$ 12,000,000
|
|
|
| X |
- References
+ Details
| Name: |
cvm_ClinicalServiceTrial |
| Namespace Prefix: |
cvm_ |
| Data Type: |
xbrli:monetaryItemType |
| Balance Type: |
debit |
| Period Type: |
duration |
|
| X |
- References
+ Details
| Name: |
cvm_FinanceLeaseWeightedAverageRemainingLeaseTermOne |
| Namespace Prefix: |
cvm_ |
| Data Type: |
xbrli:durationItemType |
| Balance Type: |
na |
| Period Type: |
duration |
|
| X |
- References
+ Details
| Name: |
cvm_FinancingArrangementDepositBaseRentAmount |
| Namespace Prefix: |
cvm_ |
| Data Type: |
xbrli:monetaryItemType |
| Balance Type: |
debit |
| Period Type: |
duration |
|
| X |
- References
+ Details
| Name: |
cvm_NetOfDiscount |
| Namespace Prefix: |
cvm_ |
| Data Type: |
xbrli:monetaryItemType |
| Balance Type: |
debit |
| Period Type: |
duration |
|
| X |
- References
+ Details
| Name: |
cvm_OperatingLeaseWeightedAverageRemainingLeaseTermOne |
| Namespace Prefix: |
cvm_ |
| Data Type: |
xbrli:durationItemType |
| Balance Type: |
na |
| Period Type: |
duration |
|
| X |
- DefinitionAmount of cash outflow for principal payment on finance lease. Reference 1: http://www.xbrl.org/2003/role/disclosureRef
-Topic 842
-SubTopic 20
-Name Accounting Standards Codification
-Section 50
-Paragraph 4
-Subparagraph (g)(1)
-Publisher FASB
-URI https://asc.fasb.org//1943274/2147478964/842-20-50-4
Reference 2: http://www.xbrl.org/2003/role/disclosureRef
-Topic 842
-SubTopic 20
-Name Accounting Standards Codification
-Section 45
-Paragraph 5
-Subparagraph (a)
-Publisher FASB
-URI https://asc.fasb.org//1943274/2147479041/842-20-45-5
| Name: |
us-gaap_FinanceLeasePrincipalPayments |
| Namespace Prefix: |
us-gaap_ |
| Data Type: |
xbrli:monetaryItemType |
| Balance Type: |
credit |
| Period Type: |
duration |
|
| X |
- DefinitionWeighted average discount rate for finance lease calculated at point in time. Reference 1: http://www.xbrl.org/2003/role/exampleRef
-Topic 842
-SubTopic 20
-Name Accounting Standards Codification
-Section 55
-Paragraph 53
-Publisher FASB
-URI https://asc.fasb.org//1943274/2147479589/842-20-55-53
Reference 2: http://www.xbrl.org/2003/role/disclosureRef
-Topic 842
-SubTopic 20
-Name Accounting Standards Codification
-Section 50
-Paragraph 4
-Subparagraph (g)(4)
-Publisher FASB
-URI https://asc.fasb.org//1943274/2147478964/842-20-50-4
| Name: |
us-gaap_FinanceLeaseWeightedAverageDiscountRatePercent |
| Namespace Prefix: |
us-gaap_ |
| Data Type: |
dtr-types:percentItemType |
| Balance Type: |
na |
| Period Type: |
instant |
|
| X |
- DefinitionAmount of cash paid for interest, including, but not limited to, capitalized interest and payment to settle zero-coupon bond attributable to accreted interest of debt discount and debt instrument with insignificant coupon interest rate in relation to effective interest rate of borrowing attributable to accreted interest of debt discount; classified as operating and investing activities. Reference 1: http://www.xbrl.org/2009/role/commonPracticeRef
-Topic 230
-SubTopic 10
-Name Accounting Standards Codification
-Section 50
-Paragraph 2
-Publisher FASB
-URI https://asc.fasb.org//1943274/2147482913/230-10-50-2
| Name: |
us-gaap_InterestPaid |
| Namespace Prefix: |
us-gaap_ |
| Data Type: |
xbrli:monetaryItemType |
| Balance Type: |
credit |
| Period Type: |
duration |
|
| X |
- DefinitionAmount of operating lease expense. Excludes sublease income. Reference 1: http://www.xbrl.org/2009/role/commonPracticeRef
-Topic 842
-SubTopic 20
-Name Accounting Standards Codification
-Section 45
-Paragraph 4
-Subparagraph (b)
-Publisher FASB
-URI https://asc.fasb.org//1943274/2147479041/842-20-45-4
| Name: |
us-gaap_OperatingLeaseExpense |
| Namespace Prefix: |
us-gaap_ |
| Data Type: |
xbrli:monetaryItemType |
| Balance Type: |
debit |
| Period Type: |
duration |
|
| X |
- DefinitionAmount of cash outflow from operating lease to bring another asset to condition and location necessary for its intended use. Reference 1: http://www.xbrl.org/2003/role/disclosureRef
-Topic 842
-SubTopic 20
-Name Accounting Standards Codification
-Section 45
-Paragraph 5
-Subparagraph (c)
-Publisher FASB
-URI https://asc.fasb.org//1943274/2147479041/842-20-45-5
Reference 2: http://www.xbrl.org/2003/role/disclosureRef
-Topic 842
-SubTopic 20
-Name Accounting Standards Codification
-Section 50
-Paragraph 4
-Subparagraph (g)(1)
-Publisher FASB
-URI https://asc.fasb.org//1943274/2147478964/842-20-50-4
| Name: |
us-gaap_OperatingLeasePaymentsUse |
| Namespace Prefix: |
us-gaap_ |
| Data Type: |
xbrli:monetaryItemType |
| Balance Type: |
credit |
| Period Type: |
duration |
|
| X |
- DefinitionWeighted average discount rate for operating lease calculated at point in time. Reference 1: http://www.xbrl.org/2003/role/exampleRef
-Topic 842
-SubTopic 20
-Name Accounting Standards Codification
-Section 55
-Paragraph 53
-Publisher FASB
-URI https://asc.fasb.org//1943274/2147479589/842-20-55-53
Reference 2: http://www.xbrl.org/2003/role/disclosureRef
-Topic 842
-SubTopic 20
-Name Accounting Standards Codification
-Section 50
-Paragraph 4
-Subparagraph (g)(4)
-Publisher FASB
-URI https://asc.fasb.org//1943274/2147478964/842-20-50-4
| Name: |
us-gaap_OperatingLeaseWeightedAverageDiscountRatePercent |
| Namespace Prefix: |
us-gaap_ |
| Data Type: |
dtr-types:percentItemType |
| Balance Type: |
na |
| Period Type: |
instant |
|
| X |
- DefinitionAmount of other research and development expense. Reference 1: http://www.xbrl.org/2009/role/commonPracticeRef
-Topic 730
-SubTopic 10
-Name Accounting Standards Codification
-Section 50
-Paragraph 1
-Publisher FASB
-URI https://asc.fasb.org//1943274/2147482916/730-10-50-1
| Name: |
us-gaap_OtherResearchAndDevelopmentExpense |
| Namespace Prefix: |
us-gaap_ |
| Data Type: |
xbrli:monetaryItemType |
| Balance Type: |
debit |
| Period Type: |
duration |
|
| X |
- Details
| Name: |
srt_TitleOfIndividualAxis=cvm_LandlordMember |
| Namespace Prefix: |
|
| Data Type: |
na |
| Balance Type: |
|
| Period Type: |
|
|
| X |
- Details
| Name: |
us-gaap_PlanNameAxis=cvm_ErgomedMember |
| Namespace Prefix: |
|
| Data Type: |
na |
| Balance Type: |
|
| Period Type: |
|
|
v3.24.1.1.u2
PATENTS (Details)
|
Mar. 31, 2024
USD ($)
|
| PATENTS |
|
| Three months ending September 30, 2024 |
$ 15,000
|
| 2025 |
29,000
|
| 2026 |
25,000
|
| 2027 |
22,000
|
| 2028 |
19,000
|
| 2029 |
16,000
|
| Thereafter |
54,000
|
| Total |
$ 180,000
|
| X |
- DefinitionAmount of amortization for assets, excluding financial assets and goodwill, lacking physical substance with finite life expected to be recognized in next fiscal year following current fiscal year. Excludes interim and annual periods when interim periods are reported from current statement of financial position date (rolling approach). Reference 1: http://fasb.org/us-gaap/role/ref/legacyRef
-Topic 350
-SubTopic 30
-Name Accounting Standards Codification
-Section 50
-Paragraph 2
-Subparagraph (a)(3)
-Publisher FASB
-URI https://asc.fasb.org//1943274/2147482665/350-30-50-2
| Name: |
us-gaap_FiniteLivedIntangibleAssetsAmortizationExpenseNextTwelveMonths |
| Namespace Prefix: |
us-gaap_ |
| Data Type: |
xbrli:monetaryItemType |
| Balance Type: |
debit |
| Period Type: |
instant |
|
| X |
- DefinitionAmount of amortization for assets, excluding financial assets and goodwill, lacking physical substance with finite life expected to be recognized in remainder of current fiscal year.
| Name: |
us-gaap_FiniteLivedIntangibleAssetsAmortizationExpenseRemainderOfFiscalYear |
| Namespace Prefix: |
us-gaap_ |
| Data Type: |
xbrli:monetaryItemType |
| Balance Type: |
debit |
| Period Type: |
instant |
|
| X |
- DefinitionAmount of amortization expense for assets, excluding financial assets and goodwill, lacking physical substance with a finite life expected to be recognized after the fifth rolling twelve months following the latest balance sheet. For interim and annual periods when interim periods are reported on a rolling approach, from latest balance sheet date.
| Name: |
us-gaap_FiniteLivedIntangibleAssetsAmortizationExpenseRollingAfterYearFive |
| Namespace Prefix: |
us-gaap_ |
| Data Type: |
xbrli:monetaryItemType |
| Balance Type: |
debit |
| Period Type: |
instant |
|
| X |
- DefinitionAmount of amortization for assets, excluding financial assets and goodwill, lacking physical substance with finite life expected to be recognized in fifth fiscal year following current fiscal year. Excludes interim and annual periods when interim periods are reported from current statement of financial position date (rolling approach). Reference 1: http://fasb.org/us-gaap/role/ref/legacyRef
-Topic 350
-SubTopic 30
-Name Accounting Standards Codification
-Section 50
-Paragraph 2
-Subparagraph (a)(3)
-Publisher FASB
-URI https://asc.fasb.org//1943274/2147482665/350-30-50-2
| Name: |
us-gaap_FiniteLivedIntangibleAssetsAmortizationExpenseYearFive |
| Namespace Prefix: |
us-gaap_ |
| Data Type: |
xbrli:monetaryItemType |
| Balance Type: |
debit |
| Period Type: |
instant |
|
| X |
- DefinitionAmount of amortization for assets, excluding financial assets and goodwill, lacking physical substance with finite life expected to be recognized in fourth fiscal year following current fiscal year. Excludes interim and annual periods when interim periods are reported from current statement of financial position date (rolling approach). Reference 1: http://fasb.org/us-gaap/role/ref/legacyRef
-Topic 350
-SubTopic 30
-Name Accounting Standards Codification
-Section 50
-Paragraph 2
-Subparagraph (a)(3)
-Publisher FASB
-URI https://asc.fasb.org//1943274/2147482665/350-30-50-2
| Name: |
us-gaap_FiniteLivedIntangibleAssetsAmortizationExpenseYearFour |
| Namespace Prefix: |
us-gaap_ |
| Data Type: |
xbrli:monetaryItemType |
| Balance Type: |
debit |
| Period Type: |
instant |
|
| X |
- DefinitionAmount of amortization for assets, excluding financial assets and goodwill, lacking physical substance with finite life expected to be recognized in third fiscal year following current fiscal year. Excludes interim and annual periods when interim periods are reported from current statement of financial position date (rolling approach). Reference 1: http://fasb.org/us-gaap/role/ref/legacyRef
-Topic 350
-SubTopic 30
-Name Accounting Standards Codification
-Section 50
-Paragraph 2
-Subparagraph (a)(3)
-Publisher FASB
-URI https://asc.fasb.org//1943274/2147482665/350-30-50-2
| Name: |
us-gaap_FiniteLivedIntangibleAssetsAmortizationExpenseYearThree |
| Namespace Prefix: |
us-gaap_ |
| Data Type: |
xbrli:monetaryItemType |
| Balance Type: |
debit |
| Period Type: |
instant |
|
| X |
- DefinitionAmount of amortization for assets, excluding financial assets and goodwill, lacking physical substance with finite life expected to be recognized in second fiscal year following current fiscal year. Excludes interim and annual periods when interim periods are reported from current statement of financial position date (rolling approach). Reference 1: http://fasb.org/us-gaap/role/ref/legacyRef
-Topic 350
-SubTopic 30
-Name Accounting Standards Codification
-Section 50
-Paragraph 2
-Subparagraph (a)(3)
-Publisher FASB
-URI https://asc.fasb.org//1943274/2147482665/350-30-50-2
| Name: |
us-gaap_FiniteLivedIntangibleAssetsAmortizationExpenseYearTwo |
| Namespace Prefix: |
us-gaap_ |
| Data Type: |
xbrli:monetaryItemType |
| Balance Type: |
debit |
| Period Type: |
instant |
|
| X |
- References
+ Details
| Name: |
us-gaap_IntangibleAssetsNetExcludingGoodwillAbstract |
| Namespace Prefix: |
us-gaap_ |
| Data Type: |
xbrli:stringItemType |
| Balance Type: |
na |
| Period Type: |
duration |
|
| X |
- DefinitionAmount after impairment of indefinite-lived intangible assets classified as other. Excludes financial assets and goodwill. Reference 1: http://fasb.org/us-gaap/role/ref/legacyRef
-Topic 350
-SubTopic 30
-Name Accounting Standards Codification
-Section 50
-Paragraph 2
-Subparagraph (b)
-Publisher FASB
-URI https://asc.fasb.org//1943274/2147482665/350-30-50-2
| Name: |
us-gaap_OtherIndefiniteLivedIntangibleAssets |
| Namespace Prefix: |
us-gaap_ |
| Data Type: |
xbrli:monetaryItemType |
| Balance Type: |
debit |
| Period Type: |
instant |
|
v3.24.1.1.u2
| X |
- References
+ Details
| Name: |
cvm_FiniteLivedIntangibleAssetsRemainingAmortizationPeriod |
| Namespace Prefix: |
cvm_ |
| Data Type: |
xbrli:durationItemType |
| Balance Type: |
na |
| Period Type: |
duration |
|
| X |
- DefinitionThe aggregate expense charged against earnings to allocate the cost of intangible assets (nonphysical assets not used in production) in a systematic and rational manner to the periods expected to benefit from such assets. As a noncash expense, this element is added back to net income when calculating cash provided by or used in operations using the indirect method. Reference 1: http://fasb.org/us-gaap/role/ref/legacyRef
-Name Accounting Standards Codification
-Section 45
-Paragraph 28
-Subparagraph (b)
-SubTopic 10
-Topic 230
-Publisher FASB
-URI https://asc.fasb.org//1943274/2147482740/230-10-45-28
Reference 2: http://fasb.org/us-gaap/role/ref/legacyRef
-Name Accounting Standards Codification
-Topic 350
-SubTopic 30
-Section 45
-Paragraph 2
-Publisher FASB
-URI https://asc.fasb.org//1943274/2147482686/350-30-45-2
Reference 3: http://fasb.org/us-gaap/role/ref/legacyRef
-Name Accounting Standards Codification
-Topic 350
-SubTopic 30
-Section 50
-Paragraph 2
-Subparagraph (a)(2)
-Publisher FASB
-URI https://asc.fasb.org//1943274/2147482665/350-30-50-2
| Name: |
us-gaap_AmortizationOfIntangibleAssets |
| Namespace Prefix: |
us-gaap_ |
| Data Type: |
xbrli:monetaryItemType |
| Balance Type: |
debit |
| Period Type: |
duration |
|
| X |
- References
+ Details
| Name: |
us-gaap_IntangibleAssetsNetExcludingGoodwillAbstract |
| Namespace Prefix: |
us-gaap_ |
| Data Type: |
xbrli:stringItemType |
| Balance Type: |
na |
| Period Type: |
duration |
|
v3.24.1.1.u2
LOSS PER COMMON SHARE (Details) - USD ($)
|
3 Months Ended |
6 Months Ended |
Mar. 31, 2024 |
Mar. 31, 2023 |
Mar. 31, 2024 |
Mar. 31, 2023 |
| LOSS PER COMMON SHARE |
|
|
|
|
| Net loss available to common shareholders - basic and diluted |
$ (7,244,891)
|
$ (8,342,809)
|
$ (13,954,415)
|
$ (16,367,870)
|
| Loss per share- basic and diluted |
|
|
|
|
| Weighted average shares outstanding - basic and diluted |
52,006,442
|
45,581,381
|
50,228,860
|
43,513,571
|
| Basic and diluted loss per common share |
$ (0.14)
|
$ (0.19)
|
$ (0.28)
|
$ (0.38)
|
| X |
- References
+ Details
| Name: |
cvm_IncomeLossFromContinuingOperationsPerBasicAndDilutedShares |
| Namespace Prefix: |
cvm_ |
| Data Type: |
num:perShareItemType |
| Balance Type: |
na |
| Period Type: |
duration |
|
| X |
- References
+ Details
| Name: |
cvm_NetIncomeLossAvailableToCommonStockholdersBasicAndDiluted |
| Namespace Prefix: |
cvm_ |
| Data Type: |
xbrli:monetaryItemType |
| Balance Type: |
credit |
| Period Type: |
duration |
|
| X |
- References
+ Details
| Name: |
cvm_WeightedAverageNumberOfShareOutstandingBasicsAndDiluted |
| Namespace Prefix: |
cvm_ |
| Data Type: |
xbrli:sharesItemType |
| Balance Type: |
na |
| Period Type: |
duration |
|
| X |
- References
+ Details
| Name: |
us-gaap_EarningsPerShareAbstract |
| Namespace Prefix: |
us-gaap_ |
| Data Type: |
xbrli:stringItemType |
| Balance Type: |
na |
| Period Type: |
duration |
|
| X |
- References
+ Details
| Name: |
us-gaap_EarningsPerShareBasicAndDilutedAbstract |
| Namespace Prefix: |
us-gaap_ |
| Data Type: |
xbrli:stringItemType |
| Balance Type: |
na |
| Period Type: |
duration |
|
v3.24.1.1.u2
LOSS PER COMMON SHARE (Details 1) - shares
|
6 Months Ended |
Mar. 31, 2024 |
Mar. 31, 2023 |
| Antidilutive Securities |
15,920,243
|
14,042,498
|
| Options and Warrants |
|
|
| Antidilutive Securities |
15,772,993
|
13,893,248
|
| Unvested Restricted Stock [Member] |
|
|
| Antidilutive Securities |
147,250
|
149,250
|
| X |
- DefinitionSecurities (including those issuable pursuant to contingent stock agreements) that could potentially dilute basic earnings per share (EPS) or earnings per unit (EPU) in the future that were not included in the computation of diluted EPS or EPU because to do so would increase EPS or EPU amounts or decrease loss per share or unit amounts for the period presented. Reference 1: http://www.xbrl.org/2003/role/disclosureRef
-Topic 260
-SubTopic 10
-Name Accounting Standards Codification
-Section 50
-Paragraph 1
-Subparagraph (c)
-Publisher FASB
-URI https://asc.fasb.org//1943274/2147482662/260-10-50-1
| Name: |
us-gaap_AntidilutiveSecuritiesExcludedFromComputationOfEarningsPerShareAmount |
| Namespace Prefix: |
us-gaap_ |
| Data Type: |
xbrli:sharesItemType |
| Balance Type: |
na |
| Period Type: |
duration |
|
| X |
- Details
| Name: |
us-gaap_AntidilutiveSecuritiesExcludedFromComputationOfEarningsPerShareByAntidilutiveSecuritiesAxis=cvm_OptionsMember |
| Namespace Prefix: |
|
| Data Type: |
na |
| Balance Type: |
|
| Period Type: |
|
|
| X |
- Details
| Name: |
us-gaap_AntidilutiveSecuritiesExcludedFromComputationOfEarningsPerShareByAntidilutiveSecuritiesAxis=cvm_UnvestedRestrictedStockMember |
| Namespace Prefix: |
|
| Data Type: |
na |
| Balance Type: |
|
| Period Type: |
|
|
v3.24.1.1.u2
| X |
- References
+ Details
| Name: |
cvm_RestrictedCommonStock |
| Namespace Prefix: |
cvm_ |
| Data Type: |
xbrli:sharesItemType |
| Balance Type: |
na |
| Period Type: |
instant |
|
| X |
- DefinitionThe number of warrants or rights which entitle the entity to receive future services in exchange for the unvested, forfeitable warrants or rights.
| Name: |
us-gaap_ClassOfWarrantOrRightUnissued |
| Namespace Prefix: |
us-gaap_ |
| Data Type: |
xbrli:sharesItemType |
| Balance Type: |
na |
| Period Type: |
instant |
|
| X |
- DefinitionValue of the not readily marketable security or category which has been determined by management based upon fair value methods, including pricing of similar securities and valuation techniques and is included in the schedule of financial condition or the balance sheet. Reference 1: http://fasb.org/us-gaap/role/ref/legacyRef
-Name Accounting Standards Codification
-Topic 940
-SubTopic 820
-Section 50
-Paragraph 1
-Subparagraph (c)
-Publisher FASB
-URI https://asc.fasb.org//1943274/2147481753/940-820-50-1
| Name: |
us-gaap_SecurityOwnedNotReadilyMarketableFairValue |
| Namespace Prefix: |
us-gaap_ |
| Data Type: |
xbrli:monetaryItemType |
| Balance Type: |
debit |
| Period Type: |
instant |
|
| X |
- Details
| Name: |
us-gaap_SubsequentEventTypeAxis=us-gaap_SubsequentEventMember |
| Namespace Prefix: |
|
| Data Type: |
na |
| Balance Type: |
|
| Period Type: |
|
|
Cel Sci (AMEX:CVM)
Historical Stock Chart
From Apr 2024 to May 2024

Cel Sci (AMEX:CVM)
Historical Stock Chart
From May 2023 to May 2024
