Harris & Harris Group Reports Financial Statements as of March 31, 2011
May 10 2011 - 4:29PM

Harris & Harris Group, Inc. (Nasdaq:TINY), reported today that,
as of March 31, 2011, its net asset value and net asset value per
share were $146,632,745 and $4.73, respectively.
| |
| SUMMARY OF FINANCIAL
POSITION |
| |
|
|
|
| |
|
|
|
| |
March 31, 2011 |
December 31, 2010 |
March 31, 2010 |
| |
(Unaudited) |
(Audited) |
(Unaudited) |
| |
|
|
|
| Total Assets |
$150,174,275 |
$149,289,168 |
$138,757,450 |
| Net Assets |
$146,632,745 |
$146,853,912 |
$136,360,282 |
| Net Asset Value per Share |
$4.73 |
$4.76 |
$4.42 |
| Shares Outstanding |
30,997,601 |
30,878,164 |
30,862,246 |
| |
|
|
|
Harris & Harris Group is a publicly traded venture capital
company that invests in nanotechnology and microsystems. Detailed
information about Harris & Harris Group and its holdings can be
found on its website at www.HHVC.com.
This press release may contain statements of a forward-looking
nature relating to future events. These forward-looking statements
are subject to the inherent uncertainties in predicting future
results and conditions. These statements reflect the Company's
current beliefs, and a number of important factors could cause
actual results to differ materially from those expressed in this
press release. Please see the Company's Annual Report on Form
10-K for the year ended December 31, 2010, as well as subsequent
SEC filings, filed with the Securities and Exchange Commission for
a more detailed discussion of the risks and uncertainties
associated with the Company's business, including but not limited
to, the risks and uncertainties associated with venture capital
investing and other significant factors that could affect the
Company's actual results. Except as otherwise required by
Federal securities laws, Harris & Harris Group, Inc.,
undertakes no obligation to update or revise these forward-looking
statements to reflect new events or uncertainties. The
reference to the website www.HHVC.com has been provided as a
convenience, and the information contained on such website is not
incorporated by reference into this press release.
CONTACT: Douglas W. Jamison
         Tel. No. (212) 582-0900
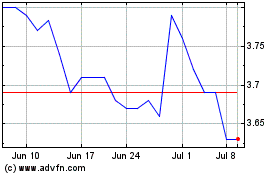
180 Degree Capital (NASDAQ:TURN)
Historical Stock Chart
From Apr 2024 to May 2024

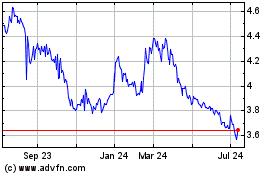
180 Degree Capital (NASDAQ:TURN)
Historical Stock Chart
From May 2023 to May 2024
