Since the end of September we have opened directly operated
international stores in Frankfurt and Dallas and a concession in
Galeries Lafayette, Paris reaching our target of five new
directly-operated international stores for the financial year.
Following the opening of our store in the new Terminal 2 at
Heathrow, we have closed our store in Terminal 1. Since 30
September 2014, we have also opened one partner store in China,
while closing one partner store in Singapore. We are on track to
open our Paris flagship store at the beginning of the next
financial year.
As highlighted in our trading update of 14 October, we expect H1
wholesale trends to continue for the rest of the year to 31 March
2015 although partner sales performance is improving similarly to
our own Retail business.
Capital and investment expenditure for the year to 31 March 2015
is expected to be approximately GBP18.0 million, subject to the
timing of new store openings and other investments.
The Group has made significant progress in opening stores in
North America and Europe, creating the foundations for our business
in these regions. As a result, fewer new stores will be opened
while we build the sales and operating performance of the 20 stores
opened internationally over the past three years.
After a difficult couple of years, the steps that have been
taken to return Mulberry to growth are beginning to bear fruit. We
expect to gain further momentum from the appointment of Johnny Coca
as our new Creative Director.
                          Retail like-for-like sales             Retail total sales
                       ---------------------------------  ---------------------------------

                          26 weeks    9 weeks    4 weeks     26 weeks    9 weeks    4 weeks
                                to         to         to           to         to         to
This year vs. last
 year (%)              30-Sep-14**  29-Nov-14  29-Nov-14  30-Sep-14**  29-Nov-14  29-Nov-14

UK full price                 -12%        +5%       +16%         -12%        +2%       +12%
UK outlet                     -25%        -9%        -8%         -23%        +6%       +22%
UK Retail total*              -17%        -1%        +5%         -16%        +4%       +17%

International Retail
 total*                        -2%        +1%        +1%         +20%       +23%       +28%

Online total                   +1%       +18%       +27%          +1%       +18%       +27%

Group Retail total            -13%        +2%        +7%          -9%        +8%       +19%
                       -----------  ---------  ---------  -----------  ---------  ---------

* Regional splits exclude
 online sales
** Retail sales for the 26 weeks to 30-Sep-14 have
 been previously reported
NON-EXECUTIVE DIRECTORS
We are pleased to have announced, on 2 December, the appointment
to the Board of a new independent non-executive director, Julie
Gilhart. Ms. Gilhart is a freelance fashion consultant who has
advised many clients including Amazon.com and LVMH. Previously
Julie spent 18 years in various roles at Barneys New York, most
recently as Fashion Director. She currently holds board positions
with Outerknown LLC and Parsons/New School.
As announced on 16 September, we are deeply saddened by the
recent passing of one our non-executive directors, Mr. Bernard
Heng. Mr. Heng made a substantial contribution to the Group as a
non-executive director for 11 years and will be greatly missed.
Consolidated income statement
Six months ended 30 September 2014
                                   Note     Unaudited     Unaudited        Audited
                                           six months    six months     year ended
                                              30 Sept       30 Sept    31 Mar 2014
                                                 2014          2013        GBP'000
                                              GBP'000       GBP'000

 Revenue                                       64,700        78,094        163,456
 Cost of sales                               (25,950)      (28,861)       (59,992)

 Gross profit                                  38,750        49,233        103,464

 Administrative expenses                     (40,127)      (42,402)       (90,194)
 Other operating income                           159           234            447

 Operating (loss)/profit                      (1,218)         7,065         13,717

 Share of results of associates                   100           157            292
 Finance income                                    13            25             35
 Finance expense                                  (5)          (20)           (30)

 (Loss)/profit before tax                     (1,110)         7,227         14,014

 Tax credit/(charge)               4              700       (2,150)        (5,412)

 (Loss)/profit for the period                   (410)         5,077          8,602
                                         ============  ============  =============


 Attributable to:
 Equity holders of the parent                   (410)         5,077          8,602
                                         ============  ============  =============


 Basic (loss)/earnings per
  share                            6           (0.7p)          8.7p          14.5p
 Diluted (loss)/earnings per
  share                            6           (0.7p)          8.6p          14.3p
All activities arise from continuing operations.
Consolidated statement of comprehensive income
Six months ended 30 September 2014
                                            Unaudited     Unaudited        Audited
                                           six months    six months     year ended
                                              30 Sept       30 Sept    31 Mar 2014
                                                 2014          2013        GBP'000
                                              GBP'000       GBP'000

 (Loss)/profit for the period                   (410)         5,077          8,602
 Exchange differences on translation
  of foreign operations                         (436)         (588)          (981)
 Tax impact arising on above
  exchange differences                             89           135            545
                                         ------------  ------------  -------------
 Total comprehensive (expense)/income
  for the period                                (757)         4,624          8,166
                                         ============  ============  =============

 Attributable to:
 Equity holders of the parent                   (757)         4,624          8,166
                                         ============  ============  =============
Consolidated balance sheet
At 30 September 2014
                                   Unaudited       Unaudited        Audited
                                     30 Sept    30 Sept 2013    31 Mar 2014
                                        2014         GBP'000        GBP'000
                                     GBP'000

 Non-current assets
 Intangible assets                    14,020           6,863          7,323
 Property, plant and equipment        36,274          37,985         35,139
 Interests in associates                 120             423             64
 Deferred tax asset                      550             780            770
                                  ----------  --------------  -------------
                                      50,964          46,051         43,296
 Current assets
 Inventories                          39,329          33,365         33,780
 Trade and other receivables          13,988          17,372         13,574
 Current tax asset                     1,199               -              -
 Cash and cash equivalents             3,585          11,143         23,414
                                  ----------  --------------  -------------
                                      58,101          61,880         70,768

 Total assets                        109,065         107,931        114,064
                                  ----------  --------------  -------------

 Current liabilities
 Trade and other payables           (28,639)        (24,500)       (29,423)
 Current tax liabilities                   -         (2,398)          (683)
                                  ----------  --------------  -------------
                                    (28,639)        (26,898)       (30,106)

 Total liabilities                  (28,639)        (26,898)       (30,106)

 Net assets                           80,426          81,033         83,958
                                  ==========  ==============  =============


 Equity
 Share capital                         3,000           2,994          3,000
 Share premium account                11,961          11,852         11,961
 Own share reserve                   (1,641)         (2,593)        (1,676)
 Capital redemption reserve              154             154            154
 Special reserves                      1,467           1,467          1,467
 Foreign exchange reserve              (559)           (229)          (212)
 Retained earnings                    66,044          67,388         69,264

 Total equity                         80,426          81,033         83,958
                                  ==========  ==============  =============
Consolidated statement of changes in equity
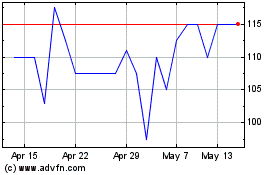
Mulberry (LSE:MUL)
Historical Stock Chart
From Jun 2024 to Jul 2024

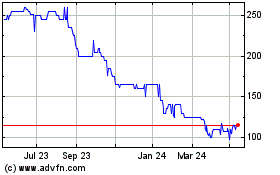
Mulberry (LSE:MUL)
Historical Stock Chart
From Jul 2023 to Jul 2024
