Preliminary Results
August 17 2000 - 7:02AM
UK Regulatory
RNS Number:6059P
Mulberry Group PLC
17 August 2000


Mulberry Group plc
Preliminary Results for the Year to 31 March 2000


CHAIRMAN'S STATEMENT

I   am  pleased  to  report  that  the  improved  trading
performance forecast in my interim report in January, has
continued in the second half of the year. We have  traded
profitably  in  the  second half  of  the  year  and  our
strategy of focusing on the core accessories products has
generated  increased sales and improved margins.  We  are
strengthening the innovation and design flair that is the
foundation of the Mulberry brand and continue to  improve
the efficiency of our operations.

Our innovative accessory designs for both Winter 1999 and
Spring  2000,  combined  with  a  new  and  very  focused
marketing  strategy, have produced good sales  growth  in
both  wholesale  and  retail  as  the  new  designs   and
materials have come on stream. This process has  gathered
momentum throughout the year.

Sales,  on  a  like  for like basis,  increased  by  #1.5
million  in  the second half of the year after  adjusting
for  sales  of  fabrics transferred to the  new  licensee
Kravet.  This followed a slight decline in the first half
and  sales for the year were #26.4 million compared  with
#27.4 million in 1999.  However gross profit for the year
increased by #1 million from 45.3% to 50.9%, a  full  10%
improvement in margin, as the sourcing strategy  that  we
put  in  place two years ago came into full effect.   The
result  for the year is a substantially reduced operating
loss  of #0.05 million compared to #0.9 million in  1999.
There  was a loss before tax of #0.7 million compared  to
#1.8  million for the previous year.  Net borrowings were
reduced by #1.2 million to #7.7 million.

The  improved sales performance in our own shops  that  I
reported at the half year has continued, driven primarily
by  accessories.  The key product area has  been  women's
handbags, followed by luggage and high tech products such
as our Psion and Palm V cases.

We  experienced a similar trend in Europe where both  our
own  and franchised stores have shown increases in trade,
particularly in accessories, reflecting the same  success
with  image and product that we have recorded in the  UK.
This  would have been more beneficial if it had not  been
for  the  negative  effect of the increased  strength  of
sterling.

HOME

The  home licensing agreement that we signed with  Kravet
in  August 1999, has been running for six months.  During
this period, they have invested in dramatically expanding
the  product range with new designs from our design team.
We expect to see increased royalties in the year to March
2001.

JAPAN

In  Japan, we appointed Toray as our master licensees  in
Autumn  1999.  Their team has started work on  developing
the  new license structure.  Our strategy of locating the
Mulberry  flagship store in Marunouchi has paid off  with
an  increase in sales of 15.7%.  Prada, Armani and Hermes
have now opened flagship stores in the same street making
this a prime retail location in Tokyo.

INTERNET

We  launched our website in Autumn 1998 and have  been  a
live and profitable e-tailer for the last six months.  We
are  experiencing  a  steady and  progressive  growth  in
access  to  our site and increasing levels of  sales.  We
remain convinced that this will become an important sales
channel  and believe that we are well poised  to  exploit
it.

STAFF

I  would  like to thank both the Directors and staff  who
have  had  to  endure  tremendous  pressure  during  this
difficult  period for the Company.  Their belief  in  the
brand and our ability to succeed has been essential.

DIVIDEND

The Board is not recommending the payment of a dividend.

CURRENT TRADING AND OUTLOOK

We  have maintained and improved our performance for  the
six months of the Spring/Summer 2000 season with like for
like growth in our UK full price shops of 12%.

Early  indications  of  wholesale sales  for  autumn  and
winter  are  looking good, particularly  on  accessories,
which  are  showing significant increases over  the  same
period  last  year.  As a result of the improved  climate
for  wholesale sales and the continuing sales  growth  in
our  own shops, the Directors look forward to the  future
with confidence.

SUBSEQUENT EVENT

Further  to our announcement on 9 June 2000 that we  were
in  talks with an international organisation specialising
in  luxury goods and fashion, owned by Mr. Ong Beng  Seng
and  Mrs.  Christina Ong, with a view to their  making  a
significant  investment in the Group, we are  pleased  to
announce  that  these  talks have  reached  a  successful
conclusion  and we have agreed, subject to  shareholders'
approval, the following:-

1.   Challice  Limited, wholly owned by  the  Ongs,  will
     subscribe for 15 million new ordinary shares of 5 pence
     each at 32 pence per share and 8 million 7% convertible
     redeemable preference shares of 5 pence each at 35 pence
     per  share.   The proceeds of this subscription,  in
     aggregate, will be approximately #7.6 million.

2.   The  Company and Challice Limited will form a  50:50
     joint venture company to develop the US market.  The
     investment by Mulberry will be limited to US$ 1 million
     and the Ongs will procure the balance of any financing
     required.  The development of the US market has been an
     objective of the Group for a number of years.  This new
     joint  venture achieves both the market  development
     objective and the limited risk criteria set  by  the
     Directors.

A  circular to shareholders giving further details of the
subscription and which convenes an extraordinary  general
meeting  of  Mulberry  to seek the necessary  shareholder
approval has, today, been sent to shareholders.

Roger Saul
Chairman and Chief Executive
CONSOLIDATED PROFIT AND LOSS ACCOUNT
for the year ended 31 March 2000

                                       2000      1999
                                      #'000     #'000

TURNOVER                             26,390    27,393
Cost of sales                      (12,945)  (14,974)
                                   --------  --------
                                          -         -

GROSS PROFIT                         13,445    12,419
Other operating expenses (net)     (13,492)  (13,291)
                                   --------  --------
                                          -         -

OPERATING LOSS                         (47)     (872)
Group share of profit/(loss) of
associated company                       16      (47)
Finance charges                       (635)     (860)
                                   --------  --------
                                          -         -

Loss on ordinary activities
before taxation                       (666)   (1,779)
Tax on loss on ordinary
activities                             (14)       (8)
                                   --------  --------
                                          -         -
LOSS FOR THE YEAR                     (680)   (1,787)
Dividends                                 -         -
                                   --------  --------
                                          -         -
LOSS FOR THE YEAR TRANSFERRED
FROM RESERVES                         (680)   (1,787)
                                   ========  ========
                                          =         =

Loss per share                      (3.24p)   (8.57p)

Dividend per share                      Nil       Nil
                                      pence     pence


CONSOLIDATED BALANCE SHEET
31 March 2000


                                         2000       1999
                                        #'000      #'000

FIXED ASSETS                            5,522      6,168

CURRENT ASSETS
Stocks                                  6,278      6,396
Debtors                                 3,628      4,856
Cash at bank                              212          -
                                    ---------  ---------
                                       10,118     11,252

CREDITORS: Amounts falling due
within one year                      (11,679)   (10,986)
                                    ---------  ---------
NET CURRENT (LIABILITIES)/ASSETS      (1,561)        266
                                    ---------  ---------
TOTAL ASSETS LESS CURRENT               3,961      6,434
LIABILITIES
CREDITORS: Amounts falling due
after more than one year                 (88)    (2,050)
                                    ---------  ---------
NET ASSETS                              3,873      4,384
                                    ---------  ---------
CAPITAL AND RESERVES
Called-up share capital                 1,299      1,049
Reserves                                2,574      3,335
                                    ---------  ---------
SHAREHOLDERS' FUNDS                     3,873      4,384
                                    ---------  ---------


CONSOLIDATED CASH FLOW STATEMENT
For the year ended 31 March 2000

                                              2000       1999
                                             #'000      #'000

Operating loss                                (47)      (872)
Depreciation charge                            845        879
(Profit)/loss on sale of tangible fixed       (14)          4
assets
Decrease in stocks                             118      1,538
Decrease in debtors                          1,233      1,256
Decrease in creditors                        (261)      (417)
Effect of foreign exchange rate changes      (132)       (73)
                                         ---------  ---------
NET CASH INFLOW FROM OPERATIONS              1,742      2,315

Interest                                     (644)      (843)
Taxation                                      (19)        233
Capital expenditure and investment           (117)      (806)
Dividends paid                                   -       (55)
                                         ---------  ---------
NET CASH INFLOW BEFORE FINANCING               962        844

Financing                                    (554)      (429)
                                         ---------  ---------
INCREASE IN CASH IN THE YEAR                   408        415
                                         ---------  ---------
RECONCILIATION OF NET CASH FLOW TO
MOVEMENT IN NET DEBT

Increase in cash in the year                   408        415
Cash outflow from decrease in debt
and lease financing                            804        429
                                         ---------  ---------
                                             1,212        844
Inception of finance leases                   (30)       (54)
                                         ---------  ---------
Movement in net debt                         1,182        790
NET DEBT, BEGINNING OF YEAR                (8,847)    (9,637)
                                         ---------  ---------
NET DEBT, END OF YEAR                      (7,665)    (8,847)
                                         ---------  ---------


NOTES

1.    The  financial information set out above  does  not
  constitute the Company's statutory accounts.  Statutory
  accounts for the year ended 31 March 1999 have been filed
  with the Registrar of Companies.  The statutory accounts
  for  the  year  ended 31 March 2000 will  be  filed  at
  Companies House upon receiving the approval of the Annual
  General  Meeting.  The auditors have  reported  on  the
  accounts  for  the year ended 31 March 1999  and  their
  report  was unqualified and did not contain a statement
  under section 237(2) or (3) of the Companies Act 1985.

2.   The results contained in this report, which have not
  been audited have been prepared using accounting policies
  consistent  with those used in the preparation  of  the
  Annual Report and Accounts for the year ended 31  March
  1999.

3.    Earnings  per  share are calculated  on  20,975,943
  (1999:  20,849,442) ordinary shares being the  weighted
  average number of shares in issue during the year.

4.    Copies  of the Annual Report and Accounts  will  be
  posted to shareholders.  Further copies can be obtained
  from  Mulberry Group plc's registered office at  Kilver
  Court, Shepton Mallet, Bath, BA4 5NF.

5.    The Annual General Meeting will be held at Mulberry
  Group  plc's  registered office, Kilver Court,  Shepton
  Mallet, Bath, BA4 5NF on 4 October 2000.

Copies of this announcement are available for a period of
14 days from the date herof from the Company's registered
office,  Kilver Court, Shepton Mallet, Bath, BA4 5NF  and
from   the   Company's  nominated  adviser,   Teather   &
Greenwoood  Limited,  Beaufort  House,  15  St.   Botolph
Street, London, EC3A 7QR.
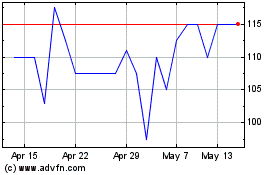
Mulberry (LSE:MUL)
Historical Stock Chart
From Jun 2024 to Jul 2024

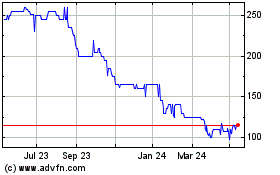
Mulberry (LSE:MUL)
Historical Stock Chart
From Jul 2023 to Jul 2024
