TIDMJLH
RNS Number : 5554M
John Lewis Of Hungerford PLC
08 May 2015
JOHN LEWIS OF HUNGERFORD PLC
("John Lewis of Hungerford" or the "Company")
Interim results
CHAIRMAN'S STATEMENT
This interim statement covers the six month period to 28
February 2015.
Financial performance
The results we are reporting today reflect the challenges
created by the staffing changes previously reported. Whilst the
first half year is traditionally our weaker trading period it is
particularly disappointing to have to report an operating loss of
GBP174k for the half year, following two consecutive years in which
we made a profit in our first half (2014: GBP66,000, 2013:
GBP35,000).
The loss reflects that a number of investments have been made in
our business to support the delivery of our strategic plan which
anticipated continued turnover growth. However, turnover for the
period was static at GBP3.5 million (2014: GBP3.6 million), due
entirely to a decline in like for like sales from our existing
estate.
In particular the unplanned departure of three of our highest
performing sales people from our top showroom had a significant
impact. This included two of our most experienced designers both of
whom elected to pursue alternative careers away from kitchen
design. Addressing this became a focus of management during the
period and as a consequence we have had to divert senior resource
into the showroom to rebuild the client base and secure a pipeline
of activity into the second half year. However, this movement of
senior staff has had a knock on effect elsewhere in the company,
which is borne out by the result for the period.
Segmental information
Products           2015     2014
--------------  -------  -------
                 GBP000   GBP000
==============  =======  =======
Turnover          3,104    3,123
==============  =======  =======
Cost of sales   (1,307)  (1,333)
--------------  -------  -------
Gross margin      1,797    1,790
==============  =======  =======
The results shown above were derived from our total estate which
includes sales from the new showrooms that were opened last year.
Combined sales from our two new showrooms of GBP520,000 achieved
business objectives and made a significant contribution to sales.
Our bedroom business continues to grow with sales of GBP143,000
during the period (2014: GBP105,000) and is gaining a strong
reputation with a high number of successful installations
completed. It is our intention to create further bedroom display
areas over time, as space allows.
As part of our focus on improving sales our other priority has
been to review the general productivity and skill levels across the
entire sales team. As a result, further salespeople left the
business as part of a managed programme. Although, coupled with the
unplanned changes referred to above, this has created temporary
challenges the Board believes that revitalising sales performance
within our mature estate to be a critical component of driving an
improved financial performance.
I am pleased to report we are making some progress in addressing
these staffing changes, with a number of high calibre people
recently recruited. As with all new recruits, it will take some
time for them to complete their training.
Installations     2015    2014
--------------  ------  ------
                GBP000  GBP000
==============  ======  ======
Turnover           444     450
==============  ======  ======
Cost of sales    (323)   (322)
--------------  ------  ------
Gross margin       121     128
==============  ======  ======
Our artisan installation service continues to trade in line with
kitchen volume, so consequently sales were static for the period.
As well as making a valuable financial contribution we continue to
believe controlling the installation process plays a critical role
in enhancing customer's experience of the brand.
Investment in the Future
The first half of the year has seen further investment in our
existing showroom estate as we focus on rolling out the new
contemporary Pure and Urban ranges following successful testing in
Fulham and Chiswick. This has led to comprehensive refits at both
our Harrogate and Oxford showrooms, improving the competiveness of
the offering and generating fresh interest at both locations.
We continue to focus our efforts on meeting the customer demand
for our new contemporary products and have three further refits
planned for this financial year.
In the factory we have replaced our increasingly unreliable and
expensive to maintain spray line of 13 years with new machinery and
this investment combined with the purchase of new finishing and
sanding technology will stand us in good order to meet future
production demands in a competitive way.
Cash flow
Cash at bank and in hand at the end of the period was GBP863,000
(2014: GBP720,000) inclusive of customer deposits and advance
payments. Our bank loans at the end of the period were GBP816,000
repayable within 10 years.
Current trading
We believe the best measure of current trading to be the
aggregate of our dispatched sales and the forward order book, being
committed orders for which deposits have been taken. At the end of
the period the aggregate of these stood at GBP4.3 million in line
with the comparable period last year. Our statutory revenue
recognition policy remains that we only recognise sales at the
point orders are dispatched.
An update on trading will be made in June, following completion
of the third quarter, ending 31(st) May 2015. Although the second
half year is traditionally our stronger trading period we now
consider it unlikely that the losses in the first half will be
recovered in full and so expect to report a loss for the full
year.
New showrooms
Successful new showrooms are dependent on location, product
selection and great people.
Whilst we remain vigilant for opportunities in suitable
localities our immediate priority is to recruit and train talented
salespeople across our existing store portfolio. Once these people
are in place and our existing business is secure, your Board
believe it may be appropriate to continue with the cautious
expansion of our showroom portfolio.
Outlook
The Company maintains its focus on long standing heritage and
brand loyalty. The recent change in PR Company has led to improved
coverage in key titles and we have seen an improvement in enquiries
and interest in the business. The customer journey continues to be
at the heart of everything we do for all areas of the Company.
We are fortunate to have a management team with a proven ability
to react quickly to both opportunities and threats presented by
volatile economic conditions. The business continues to look
forward with confidence that once internal staffing issues are
resolved we will be able to return to profitable sales growth.
Malcolm Hepworth
Chairman
Enquiries:
Malcolm Hepworth,
Chairman John Lewis of Hungerford plc 01235 774300
Smith & Williamson Corporate
Martyn Fraser Finance Limited 0117 376 2213
INCOME STATEMENT
FOR THE SIX MONTHS ENDED 28 FEBRUARY
2015
Audited
Year
Unaudited 6 months ended
ended
28 February 28 February 31 August
2015 2014 2014
GBP'000 GBP'000 GBP'000
Note
Revenue 3,548 3,573 7,416
Cost of sales (1,630) (1,655) (3,530)
Gross profit 1,918 1,918 3,886
Selling and distribution
costs (267) (288) (499)
Administration expenses:
Share based payments - - (43)
Other (1,825) (1,564) (3,250)
Total (1,825) (1,564) (3,293)
(Loss)/profit before
share based payments (174) 66 137
---------------------------------- -------- -------- ------------ ------------ ------------
(Loss)/profit from
operations (174) 66 94
Finance income 3 1 2
Finance expenses (33) (17) (37)
(Loss)/Profit before
tax (204) 50 59
Taxation - - (15)
(Loss)/profit after
taxation (204) 50 44
============ ============ ============
(Loss)/earnings per
share 2
Basic (0.11)p 0.03p 0.02p
Fully diluted (0.11)p 0.03p 0.02p
STATEMENT OF COMPREHENSIVE
INCOME
FOR THE SIX MONTHS ENDED 28 FEBRUARY
2015
Audited
Year
Unaudited 6 months ended
ended
28 February 28 February 31 August
2015 2014 2014
GBP'000 GBP'000 GBP'000
(Loss) / profit for
the period (204) 50 44
Total Comprehensive
Income (204) 50 44
============ ============ ============
BALANCE SHEET
AS AT 28 FEBRUARY
2015
Unaudited Unaudited Audited
28 February 28 February 31 August
2015 2014 2014
GBP'000 GBP'000 GBP'000
Non-Current Assets
Intangible assets 103 129 109
Tangible assets 2,629 2,494 2,690
Trade and other receivables 57 57 57
------------ ------------ ------------
2,789 2,680 2,856
------------ ------------ ------------
Current assets
Inventories 235 214 183
Trade and other receivables 367 274 294
Cash and cash equivalents 863 720 1,490
------------ ------------ ------------
1,465 1,208 1,967
Current liabilities (1,538) (1,306) (1,905)
Net current (liabilities)/assets (73) (98) 62
Total assets less
current
liabilities 2,716 2,582 2,918
Non-current liabilities (779) (494) (777)
Provisions for liabilities
and charges (31) (16) (31)
Net Assets 1,906 2,072 2,110
============ ============ ============
Equity
Share capital 187 187 187
Other reserves 1 1 1
Share premium account 1,188 1,188 1,188
Retained Earnings 530 696 734
Total Equity 1,906 2,072 2,110
============ ============ ============
STATEMENT OF CHANGES IN EQUITY
FOR THE SIX MONTHS ENDED 28 FEBRUARY
2015
Share Share Other Retained
Capital Premium Reserves Earnings Total
---------------------------------- -------- -------- ------------ ------------ ------------
GBP'000 GBP'000 GBP'000 GBP'000 GBP'000
At 31 August 2013
(Audited) 187 1,188 1 646 2,022
Profit for the period - - - 50 50
---------------------------------- -------- -------- ------------ ------------ ------------
At 28 February 2014
(Unaudited) 187 1,188 1 696 2,072
Loss for the period - - - (5) (5)
Share based payments - - - 43 43
---------------------------------- -------- -------- ------------ ------------ ------------
At 31 August 2014
(Audited) 187 1,188 1 734 2,110
Loss for the period - - - (204) (204)
At 28 February 2015
(Unaudited) 187 1,188 1 530 1,906
================================== ======== ======== ============ ============ ============
STATEMENT OF CASH
FLOWS
FOR THE SIX MONTHS ENDED 28 FEBRUARY
2015
Unaudited Unaudited Audited
6 months 6 months Year
ended ended ended
28 February 28 February 31 August
2015 2014 2014
GBP'000 GBP'000 GBP'000
(Loss)/Profit from
operations (174) 66 94
Depreciation and amortisation 164 125 288
Share based payments - - 43
Increase / (decrease)
in inventories (52) (22) 9
Increase / (decrease)
in receivables (73) (37) (57)
(Decrease) / increase
in payables (361) (217) 382
Loss / (profit) on disposal of
property plant and equipment (7) 9 4
Net cash from operating
activities (503) (76) 763
Cash flows from financing
activities (34) (36) 280
Cash flows from investing
activies (90) (290) (676)
Net (decrease) / increase
in cash and cash equivalents (627) (402) 367
------------ ------------ ------------
Net cash and cash equivalents
at the start of the year 1,490 1,122 1,123
Net cash and cash equivalents
at the end of the year 863 720 1,490
============ ============ ============
NOTES:
1. This interim financial statement has been prepared on the
basis of accounting policies adopted by the Company and set
out in the annual report and accounts for the year ended 31
August 2014. The Company does not anticipate any change in
these accounting policies for the year ended 31 August 2015.
As permitted, this interim report has been prepared in accordance
with the AIM Rules and not in accordance with IAS 34 "Interim
financial reporting".
2. Basic and fully diluted loss per ordinary share is calculated
as follows:
6 months 6 months Year
ended ended ended
28 February 28 February 31 August
2015 2014 2014
Profit / (loss) attributable to
ordinary shareholders (GBP'000) (204) 50 44
Weighted average number of
shares in issue 186,745,519 186,745,519 186,745,519
Dilution due to share
options - 11,853,752 16,263,222
------------ ------------ ------------
Shares used to calculate diluted
earnings per share 186,745,519 198,599,271 203,008,741
Basic earnings per ordinary (0.11) 0.02
share (pence) p 0.03 p p
Diluted earnings per ordinary (0.11) 0.02
share (pence) p 0.03 p p
At 28th February 2015 the basic and diluted loss per share
is the same, as the vesting of share option awards would reduce
the loss per share and is, therefore, anti-dilutive.
3. Copies of the 2015 interim accounts will be available to
shareholders on the Company's website www.john-lewis.co.uk
This information is provided by RNS
The company news service from the London Stock Exchange
END
IR UGUPGAUPAGQM
John Lewis Of Hungerford (LSE:JLH)
Historical Stock Chart
From Jun 2024 to Jul 2024

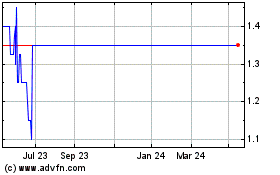
John Lewis Of Hungerford (LSE:JLH)
Historical Stock Chart
From Jul 2023 to Jul 2024
