The Group operates in two principal geographical areas: Republic
of Ireland (country of domicile), and the United Kingdom. The
Group's revenue from continuing operations from external customers
and information about its non-current assets* by geographical
location are detailed below:
                          Revenue from Jointly          Non-current assets*
                           Controlled Entities
                          and External Customers
                                       (Restated)
                           6 Months      6 Months         As at           As at
                                 to            to
                        31 Dec 2012   31 Dec 2011   31 Dec 2012          30 Jun
                                                                           2012
                                EUR           EUR           EUR             EUR
 Republic of Ireland              -        45,608     2,571,224         757,329
 United Kingdom           1,764,791     7,334,934       529,016               -

                          1,764,791     7,380,542     3,100,240         757,329
* Non-current assets excluding financial instruments and
investment in jointly controlled entities.
The management information provided to the chief operating
decision maker does not include an analysis by reportable segment
of assets and liabilities and accordingly no analysis by reportable
segment of total assets or total liabilities is disclosed.
                                                   6 months   6 months
                                                      ended      ended
 6.   INCOME TAX EXPENSE                        31 Dec 2012     31 Dec
                                                                  2011
      Income tax expense comprises:                     EUR        EUR
      Current tax                                         -          -
      Deferred tax                                        -          -

      Income tax expense recognised in profit             -          -
       or loss
An income tax charge does not arise for the six months ended 31
December 2012 or 31 December 2011 as the effective tax rate
applicable to expected total annual earnings is Nil as the Group
has sufficient tax losses coming forward to offset against any
taxable profits. A deferred tax asset has not been recognised for
the losses coming forward.
                                                           (Restated)
 7.    LOSS PER SHARE                          6 months      6 months
                                                  ended         ended
                                            31 Dec 2012   31 Dec 2011
                                                    EUR           EUR
       Basic (loss)/earnings per share
  From continuing operations                    (0.002)       (0.003)
  From discontinued operations                        -         0.002
  Total basic loss per share                    (0.002)       (0.001)

       Diluted (loss)/earnings per share
  From continuing operations                    (0.002)       (0.002)
  From discontinued operations                    0.001         0.001
  Total diluted loss per share                  (0.001)       (0.001)
Basic (loss)/earnings per share
The loss and weighted average number of ordinary shares used in
the calculation of the basic (loss)/earnings per share are as
follows:
                                                        6 months      6 months
                                                           ended         ended
                                                     31 Dec 2012   31 Dec 2011
                                                             EUR           EUR

 Loss for period attributable to equity
  holders of the parent                                (886,726)     (366,696)
 Profit for period from discontinued operations
  used in the calculation of basic earnings
  per share from discontinued operations                 155,456       326,380
 Losses used in the calculation of basic
  loss per share from continuing operations          (1,042,182)     (693,076)

 Weighted average number of ordinary shares
  for
 the purposes of basic loss per share                551,919,336   225,281,916
Diluted (loss)/earnings per share
The loss used in the calculation of all diluted earnings per
share measures is the same as those for the equivalent basic
earnings per share measures, as outlined above.
The weighted average number of ordinary shares for the purposes
of diluted loss per share reconciles to the weighted average number
of ordinary shares used in the calculation of basic loss per share
as follows:
                                            6 months      6 months
                                               ended         ended
                                         31 Dec 2012   31 Dec 2011

 Weighted average number of ordinary
  shares used
 in the calculation of basic loss per
  share                                  551,919,336   255,281,916

 "A" Shares in issue                      99,117,952    99,117,952

 Weighted average number of ordinary
  shares used in the
 calculation of diluted earnings per
  share                                  651,037,288   354,399,868
Share warrants which could potentially dilute basic earnings per
share in the future have not been included in the calculation of
diluted earnings per share as they are anti-dilutive for the
periods presented. The dilutive effect as a result of share
warrants in issue as at 31 December 2012 would be to increase the
weighted average number of shares by 37,511,646 (31 December 2011:
32,592,915).
Convertible preference shares which could potentially dilute
basic earnings per share in the future have not been included in
the calculation of diluted earnings per share as they are
anti-dilutive for the periods presented. The dilutive effect as a
result of preference shares in issue as at 31 December 2012 would
be to increase the weighted average number of shares by 3,125,000
(31 December 2011: 3,125,000).
Convertible loans which could potentially dilute basic earnings
per share have not been included in the calculation of diluted
earnings per share as they are anti-dilutive for the periods
presented. The dilutive effect as a result of loans in issue as at
31 December 2012 would be to increase the weighted average of
shares by Nil (31 December 2010: 21,000,000).
As noted in note 14 below, the Kedco Group will be required to
make a further issue of 59,737,418 ordinary shares in Kedco plc to
the former shareholders of Reforce Energy Limited ("Reforce") when
Reforce obtains eight planning permissions for renewable energy
projects from its project pipeline, as part of the agreement to
purchase Reforce. If this transaction had taken place prior to 31
December 2012, they would have affected the calculation of the
weighted average number of shares in issue for the purposes of
calculating both the basic earnings per share and diluted earnings
per share by 9,956,236 (assuming the shares were issued in December
2012).
   8.         FINANCIAL ASSETS

                                           31 Dec 2012     30 June
                                                              2012
                                                   EUR         EUR
 Loans advanced to Jointly Controlled
  Entities
 Balance at start of period                  7,608,687   7,351,666

 Loan eliminated as part of acquisition
  of jointly                                 (990,000)           -
  controlled entity

 Foreign currency exchange movement          (101,153)     257,021

 Balance at end of period                    6,517,534   7,608,687

   9.       INVESTMENT IN JOINTLY CONTROLLED ENTITIES
Details of the Group's interests in jointly controlled entities
at 31 December 2012 are as follows:
 Name of jointly         Country of         Shareholding   Principal activity
 controlled entity       incorporation
 Newry Biomass Limited   Northern Ireland       50%*       Energy utility
                                                            company

 Asdee Renewables        Republic of            50%        Energy utility
  Limited                 Ireland                           company

 Bridegreen Energy       Republic of            50%        Energy utility
  Limited                 Ireland                           company
* Under the terms of the joint venture agreement for Newry
Biomass Limited, the split of the share of profits in the company
are on the basis of (1) the aggregate amount of called up share
capital in the company and (2) the nominal holdings of loan notes
issued by the company. As a result of the loan notes issued by
Newry Biomass Limited in the period ended 31 December 2011, the
share of the profits/losses to which the Group is entitled to is
92%.
Summarised financial information in respect of the group's
interests in jointly controlled entities is as follows:
                                                     31 Dec       30 June
                                                       2012          2012
                                                        EUR           EUR

 Non-current assets                              13,325,399    11,095,301
 Current Assets                                      99,804     4,863,923
 Non-current liabilities                        (6,787,407)   (6,892,749)
 Current liabilities                            (6,090,189)   (9,705,017)

 Net assets/(liabilities)                           547,607     (638,542)

  Group's share of net assets/liabilities of
   jointly controlled entities                      246,539     (509,599)


                                                     6 months      6 months
                                                        ended         ended
                                                  31 Dec 2012   31 Dec 2011
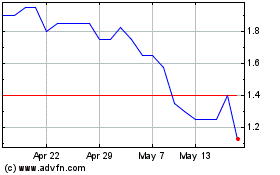
Eqtec (LSE:EQT)
Historical Stock Chart
From Jun 2024 to Jul 2024

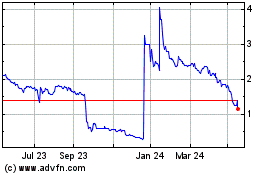
Eqtec (LSE:EQT)
Historical Stock Chart
From Jul 2023 to Jul 2024
