Chaarat has several other promising prospects also located
within the Kyrgyz Republic. An exploration programme is underway at
the Company's Chontash molybdenum-copper-gold-porphyry project,
located in the Akshirak range of mountains. A mining licence has
been obtained for the Mironovskoye polymetallic asset, located
about 120km east of Bishkek.
Consolidated income statement
For the six months ended
 30 June
                                               6 months     6 months to         12 months
                                                     to                                to
                                                30 June         30 June       31 December
                                                   2013            2012              2012
                                            (unaudited)     (unaudited)         (audited)
                                                    USD             USD               USD
Exploration expenses                        (6,756,622)     (2,819,809)       (6,301,714)

Payment for mining licence                  (5,666,213)               -                 -
Administrative expenses                     (2,865,015)     (2,441,901)       (5,905,089)
- Share options expense                       (338,383)       (275,583)         (588,514)
- Foreign exchange (loss)/gain                (551,330)        (11,998)           229,581
-----------------------------------------  ------------  --------------  ----------------
Total administrative expenses               (3,754,728)       2,729,482       (6,264,022)
Other operating income                              591         364,097           345,862
-----------------------------------------  ------------  --------------  ----------------
Operating loss                             (16,176,972)     (5,185,194)      (12,219,874)
Financial income                                110,315         347,275           730,086
-----------------------------------------  ------------  --------------  ----------------
Loss for the period, attributable
 to equity shareholders of
 the parent                                (16,066,657)     (4,837,919)      (11,489,788)
-----------------------------------------  ------------  --------------  ----------------
Loss per share (basic and
 diluted) - USD cents                            (6.41)         (1.93)c           (4.59)c
-----------------------------------------  ------------  --------------  ----------------


Consolidated statement of
 comprehensive income
For the six months ended
 30 June
                                                 6 months   6 months to        12 months
                                                       to                             to
                                                  30 June       30 June      31 December
                                                     2013          2012             2012
                                              (unaudited)   (unaudited)        (audited)
                                                      USD           USD              USD
Loss for the period, attributable
 to equity shareholders of
 the parent                                  (16,066,657)   (4,837,919)     (11,489,788)

Other comprehensive income:
Exchange differences on translating
 foreign operations and investments               731,264     (519,814)        (918,873)
Other comprehensive income
 for the period, net of tax                       731,264     (519,814)        (918,873)

Total comprehensive loss
 for the period attributable
 to equity shareholders of
 the parent                                  (15,335,393)   (5,357,733)     (12,408,661)
-------------------------------------------  ------------  ------------  ---------------


Consolidated balance sheet
At 30 June
                                               30 June             30 June          31 December
                                                  2013                2012                 2012
                                           (unaudited)         (unaudited)            (audited)
                                                   USD                 USD                  USD
Assets
Non-current assets
    Intangible assets                          120,942             156,231              129,740
    Mining exploration assets                8,349,367           8,349,367            8,349,367
    Mine properties                          8,353,682           4,913,369            8,400,984
    Property, plant and equipment            7,026,987           2,030,354            4,685,330
    Assets in construction                  15,018,098           7,821,718           15,598,101
    Other receivables                                -           1,878,355                    -
                                            38,869,076          25,149,394           37,163,522
 ---------------------------------  ------------------  ------------------   ------------------
Current assets
    Inventories                              2,336,790           1,291,950            2,783,323
    Trade and other receivables              2,697,557           6,853,233            3,143,397
    Cash and cash equivalents               20,727,659          52,611,254           36,944,060
                                            25,762,006          60,756,437           42,870,780
Total assets                                64,631,082          85,905,831           80,034,302
----------------------------------  ------------------  ------------------   ------------------


  Equity and liabilities

Equity attributable to
shareholders
    Share capital                            2,504,778           2,504,778            2,504,778
    Share premium                          128,551,662         128,551,662          128,551,662
    Other reserves                          14,808,155          14,437,527           14,618,604
    Translation reserve                    (1,257,789)         (1,589,994)          (1,989,053)
    Accumulated losses                    (82,549,024)        (60,111,184)         (66,631,199)
----------------------------------  ------------------  ------------------   ------------------
                                            62,057,782          83,792,789           77,054,792
 ---------------------------------  ------------------  ------------------   ------------------

  Non- current liabilities
----------------------------  ----  ------------------  ------------------   ------------------
     Deferred tax                              472,961             460,579              472,620
----------------------------------  ------------------  ------------------   ------------------
                                               472,961             460,579              472,620
Current liabilities
    Trade payables                           1,423,399             828,166              754,951
    Accrued liabilities                        676,940             824,297            1,751,939
----------------------------------  ------------------  ------------------   ------------------
                                             2,100,339           1,652,463            2,506,890
 ---------------------------------  ------------------  ------------------   ------------------
Total liabilities                            2,573,300           2,113,042            2,979,510
----------------------------------  ------------------  ------------------   ------------------
Total liabilities and equity                64,631,082          85,905,831           80,034,302
----------------------------------  ------------------  ------------------   ------------------


                                                                                  Consolidated statement of changes in equity
                                                                                          For the six months ended 30 June
                                                                  Share       Share      Accumulated     Other    Translation
                                                    capital    premium        losses      reserves    reserve           Total
                                                       USD        USD           USD          USD         USD              USD

                                                                                                                Balance at 31
                                                                                                                     December
                                2011              2,504,778  128,551,662  (55,420,195)  14,308,874  (1,070,180)    88,874,939
                         -----------------  ---------  -----------  ------------  ----------  -----------  ------------
                                                                                                                     Currency
                                translation               -            -             -           -    (519,814)     (519,814)
                         -----------------  ---------  -----------  ------------  ----------  -----------  ------------
                                                                                                                        Other
                                                                                                                comprehensive
                                income                    -            -             -           -    (519,814)     (519,814)
                         -----------------  ---------  -----------  ------------  ----------  -----------  ------------
                                                                                                             Loss for the six
                                                                                                                 months ended
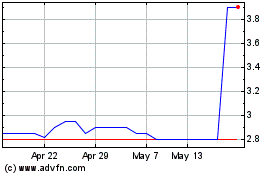
Chaarat Gold (LSE:CGH)
Historical Stock Chart
From Jun 2024 to Jul 2024

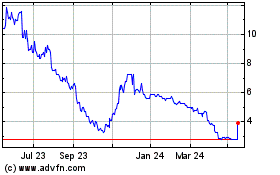
Chaarat Gold (LSE:CGH)
Historical Stock Chart
From Jul 2023 to Jul 2024
