false
Q3
--12-31
0001828748
http://fasb.org/us-gaap/2023#UsefulLifeTermOfLeaseMember
0001828748
2023-01-01
2023-09-30
0001828748
2023-11-10
0001828748
2023-09-30
0001828748
2022-12-31
0001828748
srt:DirectorMember
2023-09-30
0001828748
srt:DirectorMember
2022-12-31
0001828748
us-gaap:RelatedPartyMember
2023-09-30
0001828748
us-gaap:RelatedPartyMember
2022-12-31
0001828748
2023-07-01
2023-09-30
0001828748
2022-07-01
2022-09-30
0001828748
2022-01-01
2022-09-30
0001828748
us-gaap:CommonStockMember
2021-12-31
0001828748
us-gaap:AdditionalPaidInCapitalMember
2021-12-31
0001828748
us-gaap:RetainedEarningsMember
2021-12-31
0001828748
us-gaap:AccumulatedOtherComprehensiveIncomeMember
2021-12-31
0001828748
us-gaap:NoncontrollingInterestMember
2021-12-31
0001828748
2021-12-31
0001828748
us-gaap:CommonStockMember
2022-03-31
0001828748
us-gaap:AdditionalPaidInCapitalMember
2022-03-31
0001828748
us-gaap:RetainedEarningsMember
2022-03-31
0001828748
us-gaap:AccumulatedOtherComprehensiveIncomeMember
2022-03-31
0001828748
us-gaap:NoncontrollingInterestMember
2022-03-31
0001828748
2022-03-31
0001828748
us-gaap:CommonStockMember
2022-06-30
0001828748
us-gaap:AdditionalPaidInCapitalMember
2022-06-30
0001828748
us-gaap:RetainedEarningsMember
2022-06-30
0001828748
us-gaap:AccumulatedOtherComprehensiveIncomeMember
2022-06-30
0001828748
us-gaap:NoncontrollingInterestMember
2022-06-30
0001828748
2022-06-30
0001828748
us-gaap:CommonStockMember
2022-12-31
0001828748
us-gaap:AdditionalPaidInCapitalMember
2022-12-31
0001828748
us-gaap:RetainedEarningsMember
2022-12-31
0001828748
us-gaap:AccumulatedOtherComprehensiveIncomeMember
2022-12-31
0001828748
us-gaap:NoncontrollingInterestMember
2022-12-31
0001828748
us-gaap:CommonStockMember
2023-03-31
0001828748
us-gaap:AdditionalPaidInCapitalMember
2023-03-31
0001828748
us-gaap:RetainedEarningsMember
2023-03-31
0001828748
us-gaap:AccumulatedOtherComprehensiveIncomeMember
2023-03-31
0001828748
us-gaap:NoncontrollingInterestMember
2023-03-31
0001828748
2023-03-31
0001828748
us-gaap:CommonStockMember
2023-06-30
0001828748
us-gaap:AdditionalPaidInCapitalMember
2023-06-30
0001828748
us-gaap:RetainedEarningsMember
2023-06-30
0001828748
us-gaap:AccumulatedOtherComprehensiveIncomeMember
2023-06-30
0001828748
us-gaap:NoncontrollingInterestMember
2023-06-30
0001828748
2023-06-30
0001828748
us-gaap:CommonStockMember
2022-01-01
2022-03-31
0001828748
us-gaap:AdditionalPaidInCapitalMember
2022-01-01
2022-03-31
0001828748
us-gaap:RetainedEarningsMember
2022-01-01
2022-03-31
0001828748
us-gaap:AccumulatedOtherComprehensiveIncomeMember
2022-01-01
2022-03-31
0001828748
us-gaap:NoncontrollingInterestMember
2022-01-01
2022-03-31
0001828748
2022-01-01
2022-03-31
0001828748
us-gaap:CommonStockMember
2022-04-01
2022-06-30
0001828748
us-gaap:AdditionalPaidInCapitalMember
2022-04-01
2022-06-30
0001828748
us-gaap:RetainedEarningsMember
2022-04-01
2022-06-30
0001828748
us-gaap:AccumulatedOtherComprehensiveIncomeMember
2022-04-01
2022-06-30
0001828748
us-gaap:NoncontrollingInterestMember
2022-04-01
2022-06-30
0001828748
2022-04-01
2022-06-30
0001828748
us-gaap:CommonStockMember
2022-07-01
2022-09-30
0001828748
us-gaap:AdditionalPaidInCapitalMember
2022-07-01
2022-09-30
0001828748
us-gaap:RetainedEarningsMember
2022-07-01
2022-09-30
0001828748
us-gaap:AccumulatedOtherComprehensiveIncomeMember
2022-07-01
2022-09-30
0001828748
us-gaap:NoncontrollingInterestMember
2022-07-01
2022-09-30
0001828748
us-gaap:CommonStockMember
2023-01-01
2023-03-31
0001828748
us-gaap:AdditionalPaidInCapitalMember
2023-01-01
2023-03-31
0001828748
us-gaap:RetainedEarningsMember
2023-01-01
2023-03-31
0001828748
us-gaap:AccumulatedOtherComprehensiveIncomeMember
2023-01-01
2023-03-31
0001828748
us-gaap:NoncontrollingInterestMember
2023-01-01
2023-03-31
0001828748
2023-01-01
2023-03-31
0001828748
us-gaap:CommonStockMember
2023-04-01
2023-06-30
0001828748
us-gaap:AdditionalPaidInCapitalMember
2023-04-01
2023-06-30
0001828748
us-gaap:RetainedEarningsMember
2023-04-01
2023-06-30
0001828748
us-gaap:AccumulatedOtherComprehensiveIncomeMember
2023-04-01
2023-06-30
0001828748
us-gaap:NoncontrollingInterestMember
2023-04-01
2023-06-30
0001828748
2023-04-01
2023-06-30
0001828748
us-gaap:CommonStockMember
2023-07-01
2023-09-30
0001828748
us-gaap:AdditionalPaidInCapitalMember
2023-07-01
2023-09-30
0001828748
us-gaap:RetainedEarningsMember
2023-07-01
2023-09-30
0001828748
us-gaap:AccumulatedOtherComprehensiveIncomeMember
2023-07-01
2023-09-30
0001828748
us-gaap:NoncontrollingInterestMember
2023-07-01
2023-09-30
0001828748
us-gaap:CommonStockMember
2022-09-30
0001828748
us-gaap:AdditionalPaidInCapitalMember
2022-09-30
0001828748
us-gaap:RetainedEarningsMember
2022-09-30
0001828748
us-gaap:AccumulatedOtherComprehensiveIncomeMember
2022-09-30
0001828748
us-gaap:NoncontrollingInterestMember
2022-09-30
0001828748
2022-09-30
0001828748
us-gaap:CommonStockMember
2023-09-30
0001828748
us-gaap:AdditionalPaidInCapitalMember
2023-09-30
0001828748
us-gaap:RetainedEarningsMember
2023-09-30
0001828748
us-gaap:AccumulatedOtherComprehensiveIncomeMember
2023-09-30
0001828748
us-gaap:NoncontrollingInterestMember
2023-09-30
0001828748
ASFH:AsiaFINHoldingsCorpLabuanMember
2023-01-01
2023-09-30
0001828748
ASFH:AsiaFINHoldingsCorpLabuanMember
2023-09-30
0001828748
ASFH:AsiaFINHoldingsLimitedHongKongMember
2023-01-01
2023-09-30
0001828748
ASFH:AsiaFINHoldingsLimitedHongKongMember
2023-09-30
0001828748
ASFH:StarFINHoldingsLimitedMember
2023-01-01
2023-09-30
0001828748
ASFH:StarFINHoldingsLimitedMember
2023-09-30
0001828748
ASFH:StarFINAsiaSdnBhdMember
2023-01-01
2023-09-30
0001828748
ASFH:StarFINAsiaSdnBhdMember
2023-09-30
0001828748
ASFH:InsiteMYComSdnBhdMember
2023-01-01
2023-09-30
0001828748
ASFH:InsiteMYComSdnBhdMember
2023-09-30
0001828748
ASFH:InsiteMYSystemsSdnBhdMember
2023-01-01
2023-09-30
0001828748
ASFH:InsiteMYSystemsSdnBhdMember
2023-09-30
0001828748
ASFH:InsiteMYInnovationsSdnBhdMember
2023-01-01
2023-09-30
0001828748
ASFH:InsiteMYInnovationsSdnBhdMember
2023-09-30
0001828748
ASFH:OrangeFINAsiaSdnBhdMember
2023-01-01
2023-09-30
0001828748
ASFH:OrangeFINAsiaSdnBhdMember
2023-09-30
0001828748
ASFH:TellUSReportSdnBhdMember
2023-01-01
2023-09-30
0001828748
ASFH:TellUSReportSdnBhdMember
2023-09-30
0001828748
ASFH:MurniStarFINSdnBhdMember
2023-01-01
2023-09-30
0001828748
ASFH:MurniStarFINSdnBhdMember
2023-09-30
0001828748
ASFH:RenovationMember
2023-09-30
0001828748
us-gaap:ComputerEquipmentMember
srt:MinimumMember
2023-09-30
0001828748
us-gaap:ComputerEquipmentMember
srt:MaximumMember
2023-09-30
0001828748
us-gaap:FurnitureAndFixturesMember
2023-09-30
0001828748
ASFH:ElectricalFittingsMember
2023-09-30
0001828748
ASFH:HandphoneMember
2023-09-30
0001828748
us-gaap:OfficeEquipmentMember
2023-09-30
0001828748
ASFH:MotorVehicalMember
2023-09-30
0001828748
ASFH:PropertyMember
2023-09-30
0001828748
ASFH:PeriodEndMYRUSexchangeRateMember
2023-09-30
0001828748
ASFH:PeriodEndMYRUSexchangeRateMember
2022-09-30
0001828748
ASFH:PeriodAverageMYRUSexchangeRateMember
2023-09-30
0001828748
ASFH:PeriodAverageMYRUSexchangeRateMember
2022-09-30
0001828748
ASFH:PeriodEndHKUSexchangeRateMember
2023-09-30
0001828748
ASFH:PeriodEndHKUSexchangeRateMember
2022-09-30
0001828748
ASFH:PeriodAverageHKUSexchangeRateMember
2023-09-30
0001828748
ASFH:PeriodAverageHKUSexchangeRateMember
2022-09-30
0001828748
ASFH:StarFinHoldingsMember
2022-12-22
0001828748
ASFH:StarFinHoldingsMember
2022-12-21
2022-12-22
0001828748
us-gaap:TradeAccountsReceivableMember
2023-09-30
0001828748
us-gaap:TradeAccountsReceivableMember
2022-12-31
0001828748
us-gaap:ComputerEquipmentMember
2023-09-30
0001828748
us-gaap:ComputerEquipmentMember
2022-12-31
0001828748
us-gaap:FurnitureAndFixturesMember
2022-12-31
0001828748
us-gaap:ElectricTransmissionMember
2023-09-30
0001828748
us-gaap:ElectricTransmissionMember
2022-12-31
0001828748
ASFH:HandphoneMember
2022-12-31
0001828748
us-gaap:OfficeEquipmentMember
2022-12-31
0001828748
ASFH:RenovationMember
2022-12-31
0001828748
ASFH:MotorVehicalMember
2022-12-31
0001828748
ASFH:PropertyMember
2022-12-31
0001828748
us-gaap:ComputerEquipmentMember
2023-01-01
2023-09-30
0001828748
us-gaap:ComputerEquipmentMember
2022-01-01
2022-12-31
0001828748
us-gaap:FurnitureAndFixturesMember
2023-01-01
2023-09-30
0001828748
us-gaap:FurnitureAndFixturesMember
2022-01-01
2022-12-31
0001828748
us-gaap:ElectricTransmissionAndDistributionMember
2023-01-01
2023-09-30
0001828748
us-gaap:ElectricTransmissionAndDistributionMember
2022-01-01
2022-12-31
0001828748
ASFH:HandphoneMember
2023-01-01
2023-09-30
0001828748
ASFH:HandphoneMember
2022-01-01
2022-12-31
0001828748
us-gaap:OfficeEquipmentMember
2023-01-01
2023-09-30
0001828748
us-gaap:OfficeEquipmentMember
2022-01-01
2022-12-31
0001828748
ASFH:RenovationMember
2023-01-01
2023-09-30
0001828748
ASFH:RenovationMember
2022-01-01
2022-12-31
0001828748
2022-01-01
2022-12-31
0001828748
ASFH:PropertyMember
srt:DirectorMember
2022-01-01
2022-12-31
0001828748
srt:DirectorMember
2023-01-01
2023-09-30
0001828748
srt:ChiefExecutiveOfficerMember
2023-01-01
2023-09-30
0001828748
us-gaap:VehiclesMember
2021-04-30
2021-04-30
0001828748
2021-04-30
2021-04-30
0001828748
2021-04-30
0001828748
ASFH:HirePurchaseLoanMember
2023-09-30
0001828748
ASFH:InsiteMYInternationalIncMember
2023-01-01
2023-09-30
0001828748
ASFH:InsiteMYInternationalIncMember
2022-01-01
2022-09-30
0001828748
us-gaap:CustomerConcentrationRiskMember
2023-01-01
2023-09-30
0001828748
us-gaap:SupplierConcentrationRiskMember
2023-01-01
2023-09-30
0001828748
us-gaap:SalesRevenueNetMember
us-gaap:CustomerConcentrationRiskMember
ASFH:CustomerFMember
2023-07-01
2023-09-30
0001828748
us-gaap:SalesRevenueNetMember
us-gaap:CustomerConcentrationRiskMember
ASFH:CustomerFMember
2022-07-01
2022-09-30
0001828748
us-gaap:AccountsReceivableMember
us-gaap:CustomerConcentrationRiskMember
ASFH:CustomerFMember
2023-09-30
0001828748
us-gaap:AccountsReceivableMember
us-gaap:CustomerConcentrationRiskMember
ASFH:CustomerFMember
2022-09-30
0001828748
us-gaap:SalesRevenueNetMember
us-gaap:CustomerConcentrationRiskMember
ASFH:CustomerGMember
2023-07-01
2023-09-30
0001828748
us-gaap:SalesRevenueNetMember
us-gaap:CustomerConcentrationRiskMember
ASFH:CustomerGMember
2022-07-01
2022-09-30
0001828748
us-gaap:AccountsReceivableMember
us-gaap:CustomerConcentrationRiskMember
ASFH:CustomerGMember
2023-09-30
0001828748
us-gaap:AccountsReceivableMember
us-gaap:CustomerConcentrationRiskMember
ASFH:CustomerGMember
2022-09-30
0001828748
us-gaap:SalesRevenueNetMember
us-gaap:CustomerConcentrationRiskMember
ASFH:OthersMember
2023-07-01
2023-09-30
0001828748
us-gaap:SalesRevenueNetMember
us-gaap:CustomerConcentrationRiskMember
ASFH:OthersMember
2022-07-01
2022-09-30
0001828748
us-gaap:AccountsReceivableMember
us-gaap:CustomerConcentrationRiskMember
ASFH:OthersMember
2023-09-30
0001828748
us-gaap:AccountsReceivableMember
us-gaap:CustomerConcentrationRiskMember
ASFH:OthersMember
2022-09-30
0001828748
us-gaap:CostOfGoodsProductLineMember
us-gaap:SupplierConcentrationRiskMember
ASFH:SupplierAMember
2023-07-01
2023-09-30
0001828748
us-gaap:CostOfGoodsProductLineMember
us-gaap:SupplierConcentrationRiskMember
ASFH:SupplierAMember
2022-07-01
2022-09-30
0001828748
us-gaap:AccountsPayableMember
us-gaap:SupplierConcentrationRiskMember
ASFH:SupplierAMember
2023-07-01
2023-09-30
0001828748
us-gaap:AccountsPayableMember
us-gaap:SupplierConcentrationRiskMember
ASFH:SupplierAMember
2022-07-01
2022-09-30
0001828748
us-gaap:CostOfGoodsProductLineMember
us-gaap:SupplierConcentrationRiskMember
ASFH:SupplierBMember
2023-07-01
2023-09-30
0001828748
us-gaap:CostOfGoodsProductLineMember
us-gaap:SupplierConcentrationRiskMember
ASFH:SupplierBMember
2022-07-01
2022-09-30
0001828748
us-gaap:AccountsPayableMember
us-gaap:SupplierConcentrationRiskMember
ASFH:SupplierBMember
2023-07-01
2023-09-30
0001828748
us-gaap:AccountsPayableMember
us-gaap:SupplierConcentrationRiskMember
ASFH:SupplierBMember
2022-07-01
2022-09-30
0001828748
us-gaap:CostOfGoodsProductLineMember
us-gaap:SupplierConcentrationRiskMember
ASFH:OthersMember
2023-07-01
2023-09-30
0001828748
us-gaap:CostOfGoodsProductLineMember
us-gaap:SupplierConcentrationRiskMember
ASFH:OthersMember
2022-07-01
2022-09-30
0001828748
us-gaap:CostOfGoodsProductLineMember
us-gaap:SupplierConcentrationRiskMember
ASFH:SupplierAMember
2023-01-01
2023-09-30
0001828748
us-gaap:CostOfGoodsProductLineMember
us-gaap:SupplierConcentrationRiskMember
ASFH:SupplierAMember
2022-01-01
2022-09-30
0001828748
us-gaap:AccountsPayableMember
us-gaap:SupplierConcentrationRiskMember
ASFH:SupplierAMember
2023-01-01
2023-09-30
0001828748
us-gaap:AccountsPayableMember
us-gaap:SupplierConcentrationRiskMember
ASFH:SupplierAMember
2022-01-01
2022-09-30
0001828748
us-gaap:CostOfGoodsProductLineMember
us-gaap:SupplierConcentrationRiskMember
ASFH:SupplierBMember
2023-01-01
2023-09-30
0001828748
us-gaap:CostOfGoodsProductLineMember
us-gaap:SupplierConcentrationRiskMember
ASFH:SupplierBMember
2022-01-01
2022-09-30
0001828748
us-gaap:AccountsPayableMember
us-gaap:SupplierConcentrationRiskMember
ASFH:SupplierBMember
2023-01-01
2023-09-30
0001828748
us-gaap:AccountsPayableMember
us-gaap:SupplierConcentrationRiskMember
ASFH:SupplierBMember
2022-01-01
2022-09-30
0001828748
us-gaap:CostOfGoodsProductLineMember
us-gaap:SupplierConcentrationRiskMember
ASFH:OthersMember
2023-01-01
2023-09-30
0001828748
us-gaap:CostOfGoodsProductLineMember
us-gaap:SupplierConcentrationRiskMember
ASFH:OthersMember
2022-01-01
2022-09-30
0001828748
country:US
2023-01-01
2023-09-30
0001828748
country:US
2022-01-01
2022-09-30
0001828748
country:HK
2023-01-01
2023-09-30
0001828748
country:HK
2022-01-01
2022-09-30
0001828748
ASFH:BritishVirginiaIslandMember
2023-01-01
2023-09-30
0001828748
ASFH:BritishVirginiaIslandMember
2022-01-01
2022-09-30
0001828748
ASFH:LabuanMember
2023-01-01
2023-09-30
0001828748
ASFH:LabuanMember
2022-01-01
2022-09-30
0001828748
country:MY
2023-01-01
2023-09-30
0001828748
country:MY
2022-01-01
2022-09-30
0001828748
ASFH:InsiteMYInnovationsSdnBhdMember
2022-01-01
2022-12-31
0001828748
ASFH:InsiteMYSystemsSdnBhdMember
2022-01-01
2022-12-31
0001828748
ASFH:MrWongKaiCheongAndMrHooSweePingMember
2022-01-01
2022-12-31
0001828748
ASFH:InformationTechnologyBusinessMember
2023-01-01
2023-09-30
0001828748
ASFH:InformationTechnologyBusinessMember
2023-09-30
0001828748
ASFH:NonMalaysiaMember
2023-01-01
2023-09-30
0001828748
country:MY
2023-09-30
0001828748
ASFH:NonMalaysiaMember
2023-09-30
0001828748
ASFH:InformationTechnologyBusinessMember
2022-01-01
2022-09-30
0001828748
ASFH:InformationTechnologyBusinessMember
2022-09-30
0001828748
ASFH:NonMalaysiaMember
2022-01-01
2022-09-30
0001828748
country:MY
2022-09-30
0001828748
ASFH:NonMalaysiaMember
2022-09-30
iso4217:USD
xbrli:shares
iso4217:USD
xbrli:shares
iso4217:HKD
xbrli:shares
iso4217:MYR
xbrli:pure
UNITED
STATES
SECURITIES
AND EXCHANGE COMMISSION
Washington,
D.C. 20549
FORM
10-Q
☒
QUARTERLY REPORT PURSUANT TO SECTION 13 OR 15(d) OF THE SECURITIES EXCHANGE ACT OF 1934
For
the Quarterly Period Ended September 30, 2023
or
☐
TRANSITION REPORT PURSUANT TO SECTION 13 OR 15(d) OF THE SECURITIES EXCHANGE ACT OF 1934
For
the transition period from ______ to ______
Commission
File Number 000-56421
ASIAFIN
HOLDINGS CORP.
(Exact
name of registrant issuer as specified in its charter)
| Nevada |
|
7389 |
|
37-1950147 |
(State
or other jurisdiction of
incorporation
or organization) |
|
(Primary
Standard Industrial
Classification
Number) |
|
(IRS
Employer
Identification
Number) |
Suite
30.02, 30th Floor, Menara KH (Promet),
Jalan
Sultan Ismail, 50250 Kuala Lumpur, Malaysia.
(Address
of principal executive offices, including zip code)
+(60)3
2148 7170
(Registrant’s
telephone number, including area code)
Indicate
by check mark whether the registrant (1) has filed all reports required to be filed by Section 13 or 15(d) of the Securities Exchange
Act of 1934 during the preceding 12 months (or for such shorter period that the registrant was required to file such reports), and (2)
has been subject to such filing requirements for the past 90 days.
Yes
☒ No ☐
Indicate
by check mark whether the registrant has submitted electronically and posted on its corporate Web site, if any, every Interactive Data
File required to be submitted and posted pursuant to Rule 405 of Regulation S-T (section 232.405 of this chapter) during the preceding
twelve months (or shorter period that the registrant was required to submit and post such files).
Yes
☒ No ☐
Indicate
by check mark whether the registrant is a large accelerated filer, an accelerated filer, a non-accelerated filer, or a smaller reporting
company. See the definitions of “large accelerated filer,” “accelerated filer” and “smaller reporting company”
in Rule 12b-2 of the Exchange Act. (Check one):
| Large
Accelerated Filer ☐ |
Accelerated
Filer ☐ |
Non-accelerated
Filer ☒ |
Smaller
reporting company ☒ |
| |
|
|
Emerging
growth company ☒ |
If
an emerging growth company, indicate by check mark if the registrant has elected not to use the extended transition period for complying
with any new or revised financial accounting standards provided pursuant to Section 13(a) of the Exchange Act
Indicate
by check mark whether the registrant is a shell company (as defined in Rule 12b-2 of the Exchange Act).
Yes
☐ No ☒
APPLICABLE
ONLY TO ISSUERS INVOLVED IN BANKRUPTCY PROCEEDINGS DURING THE
PRECEDING
FIVE YEARS:
Indicate
by check mark whether the registrant has filed all documents and reports required to be filed by Sections 12, 13 or 15(d) of the Securities
Exchange Act of 1934 subsequent to the distribution of securities under a plan confirmed by a court.
N/A
Securities
registered pursuant to Section 12(b) of the Act:
| Title
of each class |
|
Trading
Symbol(s) |
|
Name
on each exchange on which registered |
| N/A |
|
N/A |
|
N/A |
APPLICABLE
ONLY TO CORPORATE ISSUERS:
Indicate
the number of shares outstanding of each of the issuer’s classes of common stock, as of the latest practicable date.
| Class |
|
Outstanding
at November 10, 2023 |
| Common
Stock, $0.0001 par value |
|
81,551,838 |
TABLE
OF CONTENTS
PART
I — FINANCIAL INFORMATION
ITEM
1. CONDENSED CONSOLIDATED FINANCIAL STATEMENTS
ASIAFIN
HOLDINGS CORP.
UNAUDITED
CONDENSED CONSOLIDATED BALANCE SHEETS
AS
OF SEPTEMBER 30, 2023 AND DECEMBER 31, 2022 (Audited)
(Currency
expressed in United States Dollars (“US$”), except for number of shares or otherwise stated)
| | |
As of
September 30, 2023 | | |
As of
December 31, 2022 | |
| | |
Unaudited | | |
Audited | |
| ASSETS | |
| | | |
| | |
| Current assets | |
| | | |
| | |
| Cash and cash equivalents | |
$ | 1,173,790 | | |
$ | 874,690 | |
| Trade receivables, net | |
| 530,241 | | |
| - | |
| Prepayment, deposits and other receivables | |
| 139,816 | | |
| 3,000 | |
| Tax assets | |
| 243,227 | | |
| - | |
| Total current assets | |
$ | 2,087,074 | | |
$ | 877,690 | |
| | |
| | | |
| | |
| Non-current Assets | |
| | | |
| | |
| Right-of-use assets, net | |
$ | 79,907 | | |
$ | - | |
| Property, plant and equipment, net | |
| 519,963 | | |
| - | |
| Deferred income tax assets | |
| 819 | | |
| - | |
| Investment in associates | |
| 7,968 | | |
| - | |
| Total non-current assets | |
$ | 608,657 | | |
$ | - | |
| | |
| | | |
| | |
| TOTAL ASSETS | |
$ | 2,695,731 | | |
$ | 877,690 | |
| | |
| | | |
| | |
| LIABILITIES AND STOCKHOLDERS’ EQUITY | |
| | | |
| | |
| Current liabilities | |
| | | |
| | |
| Other payables and accrued liabilities | |
$ | 549,907 | | |
$ | 17,805 | |
| Trade payable | |
| 22,556 | | |
| 3,357 | |
| Income tax payable | |
| 3,357 | | |
| - | |
| Amount due to director | |
| 221,038 | | |
| - | |
| Amount due to related parties | |
| 978 | | |
| - | |
| Hire purchase – current portion | |
| 7,406 | | |
| - | |
| Lease liability – current portion | |
| 74,204 | | |
| - | |
| Total current liabilities | |
$ | 879,446 | | |
$ | 21,162 | |
| | |
| | | |
| | |
| Non-current liabilities | |
| | | |
| | |
| Lease liability – non-current portion | |
| 5,703 | | |
| - | |
| Deferred tax liabilities | |
| 12,824 | | |
| - | |
| Total non-current liabilities | |
$ | 18,527 | | |
$ | - | |
| | |
| | | |
| | |
| TOTAL LIABILITIES | |
$ | 897,973 | | |
$ | 21,162 | |
| | |
| | | |
| | |
| STOCKHOLDERS’ EQUITY | |
| | | |
| | |
| Preferred shares, $0.0001 par value; 200,000,000 shares authorized; None issued and outstanding | |
$ | - | | |
$ | - | |
| Common stock, $0.0001 par value; 600,000,000 shares authorized; 81,551,838 and 73,319,800 shares issued and outstanding as of September 30, 2023 and December 31, 2022 | |
| 8,155 | | |
| 7,332 | |
| Additional paid-in capital | |
| 10,467,687 | | |
| 1,413,268 | |
| Accumulated other comprehensive loss | |
| (344,346 | ) | |
| - | |
| Accumulated deficit | |
| (8,333,541 | ) | |
| (564,072 | ) |
| Noncontrolling interest | |
| (197 | ) | |
| - | |
| | |
| | | |
| | |
| TOTAL STOCKHOLDERS’ EQUITY | |
$ | 1,797,758 | | |
$ | 856,528 | |
| | |
| | | |
| | |
| TOTAL LIABILITIES AND STOCKHOLDERS’ EQUITY | |
$ | 2,695,731 | | |
$ | 877,690 | |
See
accompanying notes to unaudited condensed consolidated financial statements.
ASIAFIN
HOLDINGS CORP.
UNAUDITED
CONDENSED CONSOLIDATED STATEMENTS OF OPERATIONS AND
COMPREHENSIVE LOSS
FOR
THE THREE AND NINE MONTHS ENDED SEPTEMBER 30, 2023 AND 2022
(Currency
expressed in United States Dollars (“US$”), except for number of shares or otherwise stated)
| | |
2023 | | |
2022 | | |
2023 | | |
2022 | |
| | |
Three months ended September 30, | | |
Nine months ended September 30, | |
| | |
2023 | | |
2022 | | |
2023 | | |
2022 | |
| REVENUE | |
$ | 695,145 | | |
$ | - | | |
$ | 1,813,426 | | |
$ | - | |
| | |
| | | |
| | | |
| | | |
| | |
| COST OF REVENUE | |
| (33,524 | ) | |
| - | | |
| (147,924 | ) | |
| - | |
| | |
| | | |
| | | |
| | | |
| | |
| GROSS PROFIT | |
| 661,621 | | |
| - | | |
| 1,665,502 | | |
| - | |
| | |
| | | |
| | | |
| | | |
| | |
| SELLING, GENERAL AND ADMINISTRATIVE EXPENSES | |
| (737,279 | ) | |
| (12,629 | ) | |
| (2,122,375 | ) | |
| (63,576 | ) |
| | |
| | | |
| | | |
| | | |
| | |
| LOSS FROM OPERATIONS | |
| (75,658 | ) | |
| (12,629 | ) | |
| (456,873 | ) | |
| (63,576 | ) |
| | |
| | | |
| | | |
| | | |
| | |
| OTHER INCOME | |
| 1,377 | | |
| 2,646 | | |
| 8,963 | | |
| 9,161 | |
| | |
| | | |
| | | |
| | | |
| | |
| | |
| | | |
| | | |
| | | |
| | |
| INCOME TAX PROVISION | |
| (310 | ) | |
| (896 | ) | |
| 29,409 | | |
| (1,137 | ) |
| | |
| | | |
| | | |
| | | |
| | |
| NET LOSS | |
| (74,591 | ) | |
| (10,879 | ) | |
| (418,501 | ) | |
| (55,552 | ) |
| Net income attributable to noncontrolling interest | |
| 197 | | |
| - | | |
| 197 | | |
| - | |
| | |
| | | |
| | | |
| | | |
| | |
| NET LOSS ATTRIBUTED TO COMMON SHAREHOLDERS OF ASIAFIN HOLDINGS CORP. | |
| (74,394 | ) | |
| (10,879 | ) | |
| (418,304 | ) | |
| (55,552 | ) |
| | |
| | | |
| | | |
| | | |
| | |
| Other comprehensive income: | |
| | | |
| | | |
| | | |
| | |
| - Foreign currency translation loss | |
| (8,636 | ) | |
| - | | |
| (84,294 | ) | |
| - | |
| | |
| | | |
| | | |
| | | |
| | |
| TOTAL COMPREHENSIVE LOSS | |
| (83,030 | ) | |
| (10,879 | ) | |
| (502,598 | ) | |
| (55,552 | ) |
| | |
| | | |
| | | |
| | | |
| | |
| NET LOSS PER SHARE, BASIC AND DILUTED | |
| (0.00 | ) | |
| (0.00 | ) | |
| (0.01 | ) | |
| (0.00 | ) |
| | |
| | | |
| | | |
| | | |
| | |
| WEIGHTED AVERAGE NUMBER OF COMMON SHARES OUTSTANDING, BASIC AND DILUTED | |
| 81,551,838 | | |
| 73,319,800 | | |
| 79,953,677 | | |
| 73,319,800 | |
See
accompanying notes to unaudited condensed consolidated financial statements.
ASIAFIN
HOLDINGS CORP.
UNAUDITED
CONDENSED CONSOLIDATED STATEMENT OF SHAREHOLDERS’ EQUITY
FOR
THE NINE MONTHS ENDED SEPTEMBER 30, 2023 AND 2022
(Currency
expressed in United States Dollars (“US$”), except for number of shares or otherwise stated)
| | |
NUMBER OF SHARES | | |
AMOUNT | | |
ADDITIONAL PAID-IN CAPITAL | | |
ACCUMULATED DEFICIT | | |
ACCUMULATED COMPREHENSIVE LOSS | | |
TOTAL STOCKHOLDERS’ EQUITY | |
| | |
COMMON STOCK | | |
| | |
| | |
| | |
| |
| | |
NUMBER OF SHARES | | |
AMOUNT | | |
ADDITIONAL PAID-IN CAPITAL | | |
ACCUMULATED DEFICIT | | |
ACCUMULATED COMPREHENSIVE LOSS | | |
TOTAL STOCKHOLDERS’ EQUITY | |
| Balance as of December 31, 2021 | |
| 73,319,800 | | |
$ | 7,332 | | |
$ | 1,413,268 | | |
$ | (451,870 | ) | |
$ | - | | - |
$ | 968,730 | |
| Issuance of share for acquisition of StarFIN Holdings Limited | |
| | | |
| | | |
| | | |
| | | |
| | | |
| | |
| Issuance of share for acquisition of StarFIN Holdings Limited, shares | |
| | | |
| | | |
| | | |
| | | |
| | | |
| | |
| Foreign currency
translation | |
| | | |
| | | |
| | | |
| | | |
| | | |
| | |
| Net loss for the period | |
| - | | |
| - | | |
| - | | |
| (6,365 | ) | |
| - | | - |
| (6,365 | ) |
| Balance as of March 31, 2022 | |
| 73,319,800 | | |
| 7,332 | | |
| 1,413,268 | | |
| (458,235 | ) | |
| - | | - |
| 962,365 | |
| Net loss for the period | |
| - | | |
| - | | |
| - | | |
| (38,308 | ) | |
| - | | - |
| (38,308 | ) |
| Balance as of June 30, 2022 | |
| 73,319,800 | | |
$ | 7,332 | | |
$ | 1,413,268 | | |
$ | (496,543 | ) | |
$ | - | | - |
$ | 924,057 | |
| Net loss for the period | |
| - | | |
| - | | |
| - | | |
| (10,879 | ) | |
| - | | - |
| (10,879 | ) |
| Balance as of September 30, 2022 | |
| 73,319,800 | | |
$ | 7,332 | | |
$ | 1,413,268 | | |
| (507,422 | ) | |
| - | | - |
| 913,178 | |
| | |
NUMBER
OF SHARES | | |
AMOUNT | | |
ADDITIONAL PAID-IN CAPITAL | | |
ACCUMULATED DEFICIT | | |
ACCUMULATED
COMPREHENSIVE LOSS | | |
NONCONTROLLING
INTEREST | | |
TOTAL STOCKHOLDERS’ EQUITY | |
| | |
COMMON
STOCK | | |
| | |
| | |
| | |
| | |
| |
| | |
NUMBER
OF SHARES | | |
AMOUNT | | |
ADDITIONAL PAID-IN CAPITAL | | |
ACCUMULATED DEFICIT | | |
ACCUMULATED
COMPREHENSIVE LOSS | | |
NONCONTROLLING
INTEREST | | |
TOTAL STOCKHOLDERS’ EQUITY | |
| Balance as of December 31, 2022 | |
| 73,319,800 | | |
$ | 7,332 | | |
$ | 1,413,268 | | |
$ | (564,072 | ) | |
$ | - | | |
$ | - | | |
$ | 856,528 | |
| Issuance of share for acquisition of StarFIN Holdings Limited
on February 23, 2023 | |
| 8,232,038 | | |
| 823 | | |
| 9,054,419 | | |
| (7,351,165 | ) | |
| (260,052 | ) | |
| - | | |
| 1,444,025 | |
| Issuance of share for acquisition of StarFIN Holdings Limited | |
| 8,232,038 | | |
| 823 | | |
| 9,054,419 | | |
| (7,351,165 | ) | |
| (260,052 | ) | |
| - | | |
| 1,444,025 | |
| Net loss for the period | |
| - | | |
| - | | |
| - | | |
| (334,636 | ) | |
| - | | |
| - | | |
| (334,636 | ) |
| Foreign currency
translation | |
| - | | |
| - | | |
| - | | |
| - | | |
| (4,653 | ) | |
| - | | |
| (4,653 | ) |
| Balance as of March 31, 2023 | |
| 81,551,838 | | |
| 8,155 | | |
| 10,467,687 | | |
| (8,249,873 | ) | |
| (264,705 | ) | |
| - | | |
| 1,961,264 | |
| | |
| | | |
| | | |
| | | |
| | | |
| | | |
| | | |
| | |
| Net loss for the period | |
| - | | |
| - | | |
| - | | |
| (9,274 | ) | |
| - | | |
| - | | |
| (9,274 | ) |
| Foreign currency
translation | |
| - | | |
| - | | |
| - | | |
| - | | |
| (71,005 | ) | |
| - | | |
| (71,005 | ) |
| Balance as of June 30, 2023 | |
| 81,551,838 | | |
$ | 8,155 | | |
$ | 10,467,687 | | |
$ | (8,259,147 | ) | |
$ | (335,710 | ) | |
$ | - | | |
$ | 1,880,985 | |
| Balance | |
| 81,551,838 | | |
$ | 8,155 | | |
$ | 10,467,687 | | |
$ | (8,259,147 | ) | |
$ | (335,710 | ) | |
$ | - | | |
$ | 1,880,985 | |
| Net loss for the period | |
| - | | |
| - | | |
| - | | |
| (74,394 | ) | |
| - | | |
| (197 | ) | |
| (74,591 | ) |
| Foreign currency translation | |
| - | | |
| - | | |
| - | | |
| - | | |
| (8,636 | ) | |
| - | | |
| (8,636 | ) |
| Balance as of September 30, 2023 | |
| 81,551,838 | | |
$ | 8,155 | | |
$ | 10,467,687 | | |
$ | (8,333,541 | ) | |
$ | (344,346 | ) | |
$ | (197 | ) | |
$ | 1,797,758 | |
| Balance | |
| 81,551,838 | | |
$ | 8,155 | | |
$ | 10,467,687 | | |
$ | (8,333,541 | ) | |
$ | (344,346 | ) | |
$ | (197 | ) | |
$ | 1,797,758 | |
See
accompanying notes to unaudited condensed consolidated financial statements
ASIAFIN
HOLDINGS CORP.
UNAUDITED
CONDENSED CONSOLIDATED STATEMENT OF CASH FLOWS
FOR
THE NINE MONTHS ENDED SEPTEMBER 30, 2023 AND 2022
(Currency
expressed in United States Dollars (“US$”), except for number of shares or otherwise stated)
| | |
Nine Months Ended September 30, 2023 | | |
Nine Months Ended September 30, 2022 | |
| | |
| | |
| |
| CASH FLOWS FROM OPERATING ACTIVITIES: | |
| | | |
| | |
| Net loss | |
$ | (418,304 | ) | |
$ | (55,552 | ) |
| Minority interest | |
| (197 | ) | |
| - | |
| Share of loss from operation of associate | |
| 154 | | |
| - | |
| | |
| | | |
| | |
| Adjustments to reconcile net profit to net cash used in operating activities: | |
| | | |
| | |
| Depreciation and amortization | |
| 125,937 | | |
| - | |
| | |
| | | |
| | |
| Changes in operating assets and liabilities: | |
| | | |
| | |
| Account payable | |
| (660 | ) | |
| (4,200 | ) |
| Account receivable | |
| 104,750 | | |
| - | |
| Prepayment, deposits and other receivables | |
| 54,214 | | |
| (1,751 | ) |
| Other payables and accrued liabilities | |
| (223,644 | ) | |
| (3,200 | ) |
| Deferred revenue | |
| 63,123 | | |
| - | |
| Tax assets | |
| 73,277 | | |
| - | |
| Deferred income tax assets | |
| 4,257 | | |
| - | |
| Income tax payable | |
| - | | |
| 896 | |
| Change in lease liability | |
| (65,252 | ) | |
| - | |
| | |
| | | |
| | |
| Net cash used in operating activities | |
$ | (282,345 | ) | |
$ | (63,807 | ) |
| | |
| | | |
| | |
| CASH FLOWS FROM INVESTING ACTIVITIES: | |
| | | |
| | |
| Purchase of property, plant and equipment | |
| (30,320 | ) | |
| - | |
| Net cash used in financing activities | |
$ | (30,320 | ) | |
$ | - | |
| | |
| | | |
| | |
| CASH FLOWS FROM FINANCING ACTIVITIES: | |
| | | |
| | |
| Repayment to director | |
| (46,724 | ) | |
| - | |
| Repayment of hire purchase | |
| (8,405 | ) | |
| - | |
| Advances to related companies | |
| (617 | ) | |
| - | |
| Net cash used in financing activities | |
$ | (55,746 | ) | |
$ | - | |
| | |
| | | |
| | |
| Effect of exchange rate changes on cash and cash equivalents | |
$ | (37,969 | ) | |
$ | - | |
| | |
| | | |
| | |
| Net changes in cash and cash equivalents | |
$ | (406,380 | ) | |
$ | (63,807 | ) |
| Cash and cash equivalents, beginning of year | |
| 1,580,170 | | |
| 980,681 | |
| | |
| | | |
| | |
| CASH AND CASH EQUIVALENTS, END OF YEAR | |
$ | 1,173,790 | | |
$ | 916,874 | |
| | |
| | | |
| | |
| SUPPLEMENTAL CASH FLOWS INFORMATION | |
| | | |
| | |
| Cash paid for income taxes | |
$ | 56,576 | | |
$ | 241 | |
| Cash paid for interest paid | |
$ | 334 | | |
$ | - | |
See
accompanying notes to unaudited condensed consolidated financial statements.
ASIAFIN
HOLDINGS CORP.
NOTES
TO UNAUDITED CONDENSED CONSOLIDATED FINANCIAL STATEMENTS
FOR
THE NINE MONTHS ENDED SEPTEMBER 30, 2023 AND 2022
(Currency
expressed in United States Dollars (“US$”), except for number of shares or otherwise stated)
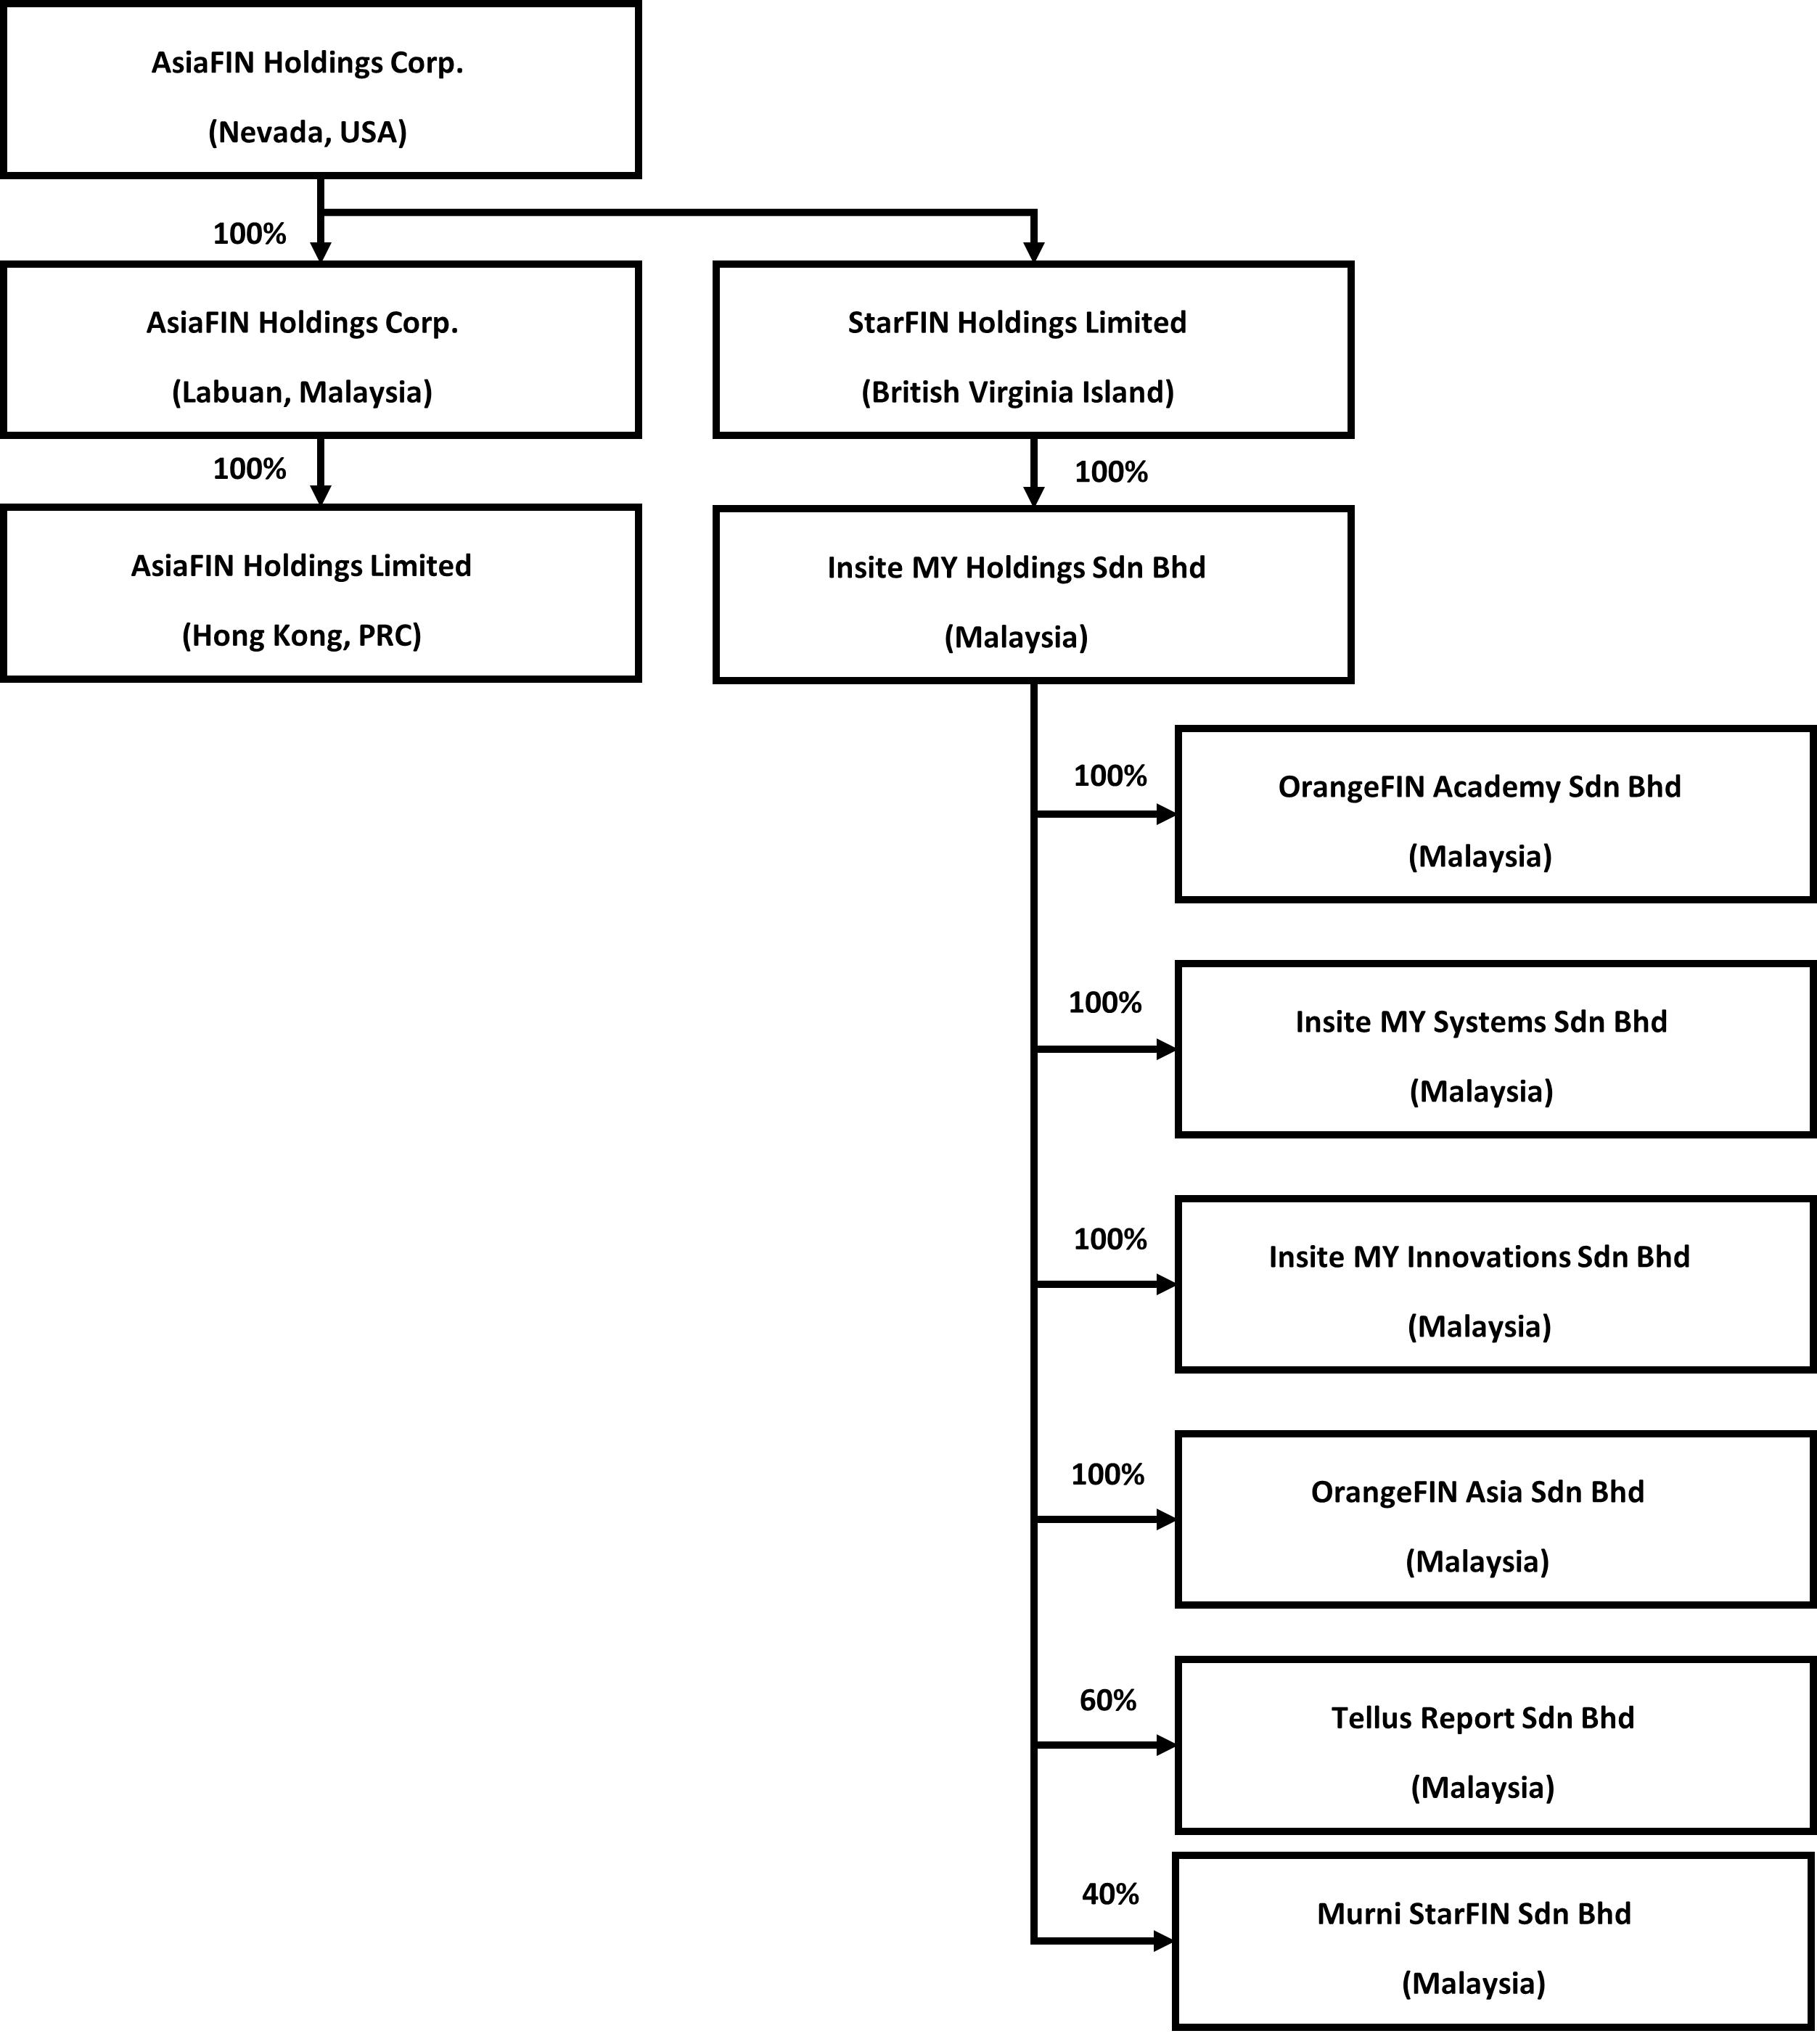
1.
ORGANIZATION AND BUSINESS BACKGROUND
AsiaFIN
Holdings Corp. (“the Company”) was incorporated under the jurisdiction of Nevada on June 14, 2019. The Company, through its
wholly owned subsidiaries, provides information technology services. Details of the Company’s subsidiaries and associate:
SCHEDULE OF SUBSIDIARIES
| No. |
|
Subsidiary
Company
Name |
|
Domicile
and Date of Incorporation |
|
Particulars
of
Issued
Capital |
|
Principal
Activities |
| 1 |
|
AsiaFIN
Holdings Corp. |
|
Labuan
at July 15, 2019 |
|
1
shares of common stock |
|
Investment
holding company |
| |
|
|
|
|
|
|
|
|
| 2 |
|
AsiaFIN
Holdings Limited |
|
Hong
Kong at July 5, 2019 |
|
1
shares of common stock |
|
Investment
holding company |
| |
|
|
|
|
|
|
|
|
| 3 |
|
StarFIN
Holdings Limited |
|
British
Virgin Island at August 19, 2021 |
|
10,000
shares of common stock |
|
Investment
holding company |
| |
|
|
|
|
|
|
|
|
| 4 |
|
Insite
MY Holdings Sdn Bhd (FKA StarFIN Asia Sdn Bhd) |
|
Malaysia
at May 24, 2018 |
|
11,400,102
shares of common stock |
|
Investment
holding company |
| |
|
|
|
|
|
|
|
|
| 5 |
|
OrangeFIN
Academy Sdn Bhd (FKA Insite MY.Com Sdn Bhd) |
|
Malaysia
at February 2, 2000 |
|
100,000
shares of common stock |
|
Provision
of business system integration and management services |
| |
|
|
|
` |
|
|
|
|
| 6 |
|
Insite
MY Systems Sdn Bhd |
|
Malaysia
at January 18, 2000 |
|
500,000
shares of common stock |
|
Provision
of information technology services |
| |
|
|
|
|
|
|
|
|
| 7 |
|
Insite
MY Innovations Sdn Bhd |
|
Malaysia
at January 18, 2010 |
|
540,000
shares of common stock |
|
Provision
of information technology services |
| |
|
|
|
|
|
|
|
|
| 8 |
|
OrangeFIN
Asia Sdn Bhd |
|
Malaysia
at January 25, 2018 |
|
50,000
shares of common stock |
|
Provision
of computer programming activities and services |
| |
|
|
|
|
|
|
|
|
| 9 |
|
TellUS
Report Sdn Bhd |
|
Malaysia
at September 22, 2023 |
|
60
shares of common stock |
|
Provision
of information technology services |
| No. |
|
Associate
Company
Name |
|
Domicile
and Date of Incorporation |
|
Particulars
of
Issued
Capital |
|
Principal
Activities |
| 1 |
|
Murni
StarFIN Sdn Bhd |
|
Malaysia
at September 9, 2022 |
|
100,000
shares of common stock |
|
Provision
of information technology services |
Mr.
Wong Kai Cheong is the common director of all of aforementioned companies.
2.
SUMMARY OF SIGNIFICANT ACCOUNTING POLICIES
Basis
of Presentation
These
accompanying financial statements have been prepared in accordance with generally accepted accounting principles in the United States
of America (“US GAAP”).
The
accompanying financial statements include the accounts of the Company and its subsidiaries and associates. Intercompany transactions
and balances were eliminated in consolidation. The Company has adopted December 31 as its fiscal year end. Below is the organization
chart of the Group.
The
accompanying unaudited condensed consolidated financial statements as of and for the nine months ended September 30, 2023 and 2022 have
been prepared pursuant to the rules and regulations of the Securities and Exchange Commission (the “SEC”) that permit reduced
disclosure for interim periods. Certain information and footnote disclosures normally included in financial statements prepared in accordance
with accounting principles generally accepted in the United States of America (“US GAAP”) have been condensed or omitted.
In the opinion of management, all adjustments (consisting of normal recurring accruals) considered necessary for a fair presentation
have been included. Operating results for the period ended September 30, 2023 are not necessarily indicative of the results that may
be expected for the year ending December 31, 2023. The Condensed Consolidated Balance Sheet information as of December 31, 2022 was derived
from the Company’s audited Consolidated Financial Statements as of and for the year ended December 31, 2022 included in the Company’s
Annual Report on Form 10-K filed with the SEC on February 16, 2023. These financial statements should be read in conjunction with that
report.
The
accompanying unaudited condensed consolidated financial statements include the accounts of the Company and its wholly owned subsidiaries
and majority-owned subsidiaries which the Company controls and entities for which the Company is the primary beneficiary. For those consolidated
subsidiaries where the Company’s ownership is less than 100%, the outside shareholders’ interests are shown as noncontrolling
interests in equity. Acquired businesses are included in the consolidated financial statements from the date on which control is transferred
to the Company. Subsidiaries are deconsolidated from the date that control ceases. All inter-company accounts and transactions have been
eliminated in consolidation.
Use
of Estimates
In
preparing these financial statements, management makes estimates and assumptions that affect the reported amounts of assets and liabilities
in the balance sheets and revenues and expenses during the years reported. Actual results may differ from these estimates.
Cash
and Cash Equivalents
The
Company considers short-term, highly liquid investments with an original maturity of 90 days or less to be cash equivalents.
Our
deposit in Malaysia banks are secured by Perbadanan Insurans Deposit Malaysia, compensating up to a limit of Malaysia Ringgit MYR250,000
per deposit per member bank, which is equivalent to $53,191, if any of our bank fail.
Property,
Plant and Equipment
Property,
plant and equipment are stated at cost, with depreciation and amortization provided using the straight-line method over the following
periods:
SCHEDULE
OF PLANT AND EQUIPMENT DEPRECIATION PERIODS
| Asset
Categories |
|
Depreciation
Periods |
| Renovation |
|
over
the remaining lease period |
| Computer
Systems |
|
4
to 5 years |
| Furniture
and Fittings |
|
10
years |
| Electrical
Fittings |
|
10
years |
| Handphone |
|
5
years |
| Office
Equipment |
|
10
years |
| Motor
Vehicle |
|
5
years |
| Property |
|
50
years |
Revenue
recognition
The
Company through subsidiaries generate multiple streams of revenues based on different business model adopted by each subsidiary through
provisions of services and recognized upon customer obtained control of promised services and recognized in an amount that reflects the
consideration that the Company expects to receive in exchange for those services. In addition, the standard requires disclosure of the
nature, amount, timing, and uncertainty of revenue and cash flows arising from contracts with customers. The Company applies the following
five-step model in order to determine this amount:
(i)
Identify contract with customer;
(ii)
Identify distinct performance obligations in contract, including promises if any;
(iii)
Measurement of the transaction price, including the constraint on variable consideration;
(iv)
Allocation of the transaction price to the performance obligations; and
(v)
Recognition of revenue when (or as) the Company satisfies each performance obligation.
Cost
of revenue
Cost
of revenue includes direct costs associated with provision of services such as development costs, purchases of third-party software,
maintenance fees and consultation fees.
Income
tax expense
Income
taxes are determined in accordance with the provisions of ASC Topic 740, “Income Taxes” (“ASC Topic 740”). Under
this method, deferred tax assets and liabilities are recognized for the future tax consequences attributable to differences between the
financial statement carrying amounts of existing assets and liabilities and their respective tax basis. Deferred tax assets and liabilities
are measured using enacted income tax rates expected to apply to taxable income in the years in which those temporary differences are
expected to be recovered or settled. Any effect on deferred tax assets and liabilities of a change in tax rates is recognized in income
in the period that includes the enactment date.
ASC
740 prescribes a comprehensive model for how companies should recognize, measure, present, and disclosed in their financial statements
uncertain tax positions taken or expected to be taken on a tax return. Under ASC 740, tax positions must initially be recognized in the
financial statements when it is more likely than not the position will be sustained upon examination by the tax authorities. Such tax
positions must initially and subsequently be measured as the largest amount of tax benefit that has a greater than 50% likelihood of
being realized upon ultimate settlement with the tax authority assuming full knowledge of the position and relevant facts.
The
Company conducts major businesses in Malaysia and is subject to tax in their own jurisdictions. As a result of its business activities,
the Company will file separate tax returns that are subject to examination by the foreign tax authorities.
Going concern
The accompanying financial statements have been prepared
on a going concern basis, which contemplates the realization of assets and the settlement of liabilities and commitments in the normal
course of business.
As reflected in the accompanying financial statements,
for the nine months ended September 30, 2023, the Company incurred a net loss of $418,304 and negative operating cash flow of $282,345.
These factors raise substantial doubt about the Company’s ability to continue as a going concern within one year of the date that
the financial statements are issued.
The Company does not have sufficient revenue to cover
its operating cost due to the research and development activities performed in the initial stage. The Company’s ability to continue
as a going concern is dependent upon improving its profitability and the continuing financial support from its major shareholders. Management
believes the existing shareholders or external financing will provide the additional cash to meet the Company’s obligations as they
become due.
No assurance can be given that any future financing,
if needed, will be available. These and other factors raise substantial doubt about the Company’s ability to continue as a going
concern. These financial statements do not include any adjustments to reflect the possible future effects on the recoverability in profitability
that may result in the Company not being able to continue as a going concern.
Foreign
currencies translation
Transactions
denominated in currencies other than the functional currency are translated into the functional currency at the exchange rates prevailing
at the dates of the transaction. Monetary assets and liabilities denominated in currencies other than the functional currency are translated
into the functional currency using the applicable exchange rates at the balance sheet dates. The resulting exchange differences are recorded
in the statement of operations and comprehensive income (loss).
The
functional currency of the Company is the United States Dollars (“US$”) and the accompanying financial statements have been
expressed in US$. In addition, the Company’s subsidiary maintains its books and record in Malaysia Ringgits (“MYR”),
United States Dollars (“US$”) and Hong Kong Dollars (“HK$”), which is the respective functional currency as being
the primary currency of the economic environment in which the entity operates.
In
general, for consolidation purposes, assets and liabilities of its subsidiaries whose functional currency is not US$ are translated into
US$, in accordance with ASC Topic 830-30, “Translation of Financial Statement”, using the exchange rate on the balance sheet
date. Revenues and expenses are translated at average rates prevailing during the period. The gains and losses resulting from translation
of financial statements of foreign subsidiary are recorded as a separate component of accumulated other comprehensive income.
Translation
of amounts from the local currency of the Company into US$1 has been made at the following exchange rates for the respective periods:
SCHEDULE OF FOREIGN EXCHANGE RATE
| | |
As of and for the period ended September 30 | |
| | |
2023 | | |
2022 | |
| Period-end MYR : US$1 exchange rate | |
| 4.70 | | |
| 4.53 | |
| Period-average MYR : US$1 exchange rate | |
| 4.53 | | |
| 4.35 | |
| Period-end HK$ : US$1 exchange rate | |
| 7.75 | | |
| 7.85 | |
| Period-average HK$ : US$1 exchange rate | |
| 7.75 | | |
| 7.84 | |
Related
parties
Parties,
which can be a corporation or individual, are considered to be related if the Company has the ability, directly or indirectly, to control
the other party or exercise significant influence over the other party in making financial and operating decisions. Companies are also
considered to be related if they are subject to common control or common significant influence.
Fair
value of financial instruments
The
carrying value of the Company’s financial instruments: cash and cash equivalents, trade receivable, deposits and other receivables,
amount due to related parties and other payables approximate at their fair values because of the short-term nature of these financial
instruments.
The
Company also follows the guidance of the ASC Topic 820-10, “Fair Value Measurements and Disclosures” (“ASC 820-10”),
with respect to financial assets and liabilities that are measured at fair value. ASC 820-10 establishes a three-tier fair value hierarchy
that prioritizes the inputs used in measuring fair value as follows:
Level
1 : Observable inputs such as quoted prices in active markets;
Level
2 : Inputs, other than the quoted prices in active markets, that are observable either directly or indirectly; and
Level
3 : Unobservable inputs in which there is little or no market data, which require the reporting entity to develop its own assumptions.
As
of September 30, 2023, the Company did not have any nonfinancial assets and liabilities that are recognized or disclosed at fair value
in the financial statements, at least annually, on a recurring basis, nor did the Company have any assets or liabilities measured at
fair value on a non-recurring basis.
Net
Income/(Loss) per Share
The
Company calculates net income/(loss) per share in accordance with ASC Topic 260, “Earnings per Share”. Basic income/(loss)
per share is computed by dividing the net income/(loss) by the weighted-average number of common shares outstanding during the period.
Diluted income per share is computed similar to basic income/(loss) per share except that the denominator is increased to include the
number of additional common shares that would have been outstanding if the potential common stock equivalents had been issued and if
the additional common shares were dilutive.
Lease
The
Company offices for fixed periods pre-emptive extension options. The Company recognizes lease payments for its short-term lease on a
straight-line basis over the lease term.
Lease
liability is initially and subsequently measured at the present value of the unpaid lease payments at the lease commencement date. The
right-of-use asset is initially measured at cost, which comprises the initial amount of the lease liability adjusted for lease payments
made at or before the lease commencement date, plus any initial direct costs incurred less any lease incentives received. Costs associated
with operating lease assets are recognized on a straight-line basis within operating expenses over the term of the lease.
In
determining the present value of the unpaid lease payments, ASC 842 requires a lessee to discount its unpaid lease payments using the
interest rate implicit in the lease or, if that rate cannot be readily determined, its incremental borrowing rate. As most of the Company
leases do not provide an implicit rate, the Company uses its incremental borrowing rate as the discount rate for the lease. The Company
incremental borrowing rate is estimated to approximate the interest rate on a collateralized basis with similar terms and payments.
Acquisition
Agreement
The
acquisition of StarFIN Holdings Limited. (“SFHL”) has been accounted for under the purchase method of accounting in accordance
with Statement of Financial Accounting Standards No. 141, “Business Combinations”. Under the purchase method of accounting,
the purchase price is allocated to the assets acquired and liabilities assumed based on their estimated fair values.
The
allocation of the purchase price has been prepared based on preliminary estimates of fair values. However, actual amounts recorded upon
the finalization of estimates of fair values may differ from the information presented in these unaudited pro forma condensed combined
consolidated financial statements. The Company estimates of the fair values of the assets and liabilities of SFHL have been combined
with the recorded values of the assets and liabilities of SFHL in the audited condensed combined financial information, goodwill was
immediately impaired upon recognition.
Recently
Adopted Accounting Standards
In
June 2016, the FASB issued Accounting Standards Update No. 2016-13, Financial Instruments—Credit Losses (Topic 326): Measurement
of Credit Losses on Financial Instruments, which introduced the expected credit losses methodology for the measurement of credit losses
on financial assets measured at amortized cost basis, replacing the previous incurred loss methodology. In November 2019, the FASB issued
ASU 2019-10 highlighted the adoption timeline. For smaller reporting entities, Topic 326 is effective for annual periods beginning after
December 15, 2022, including interim periods within those fiscal years, of which is effective for the Company on January 1, 2023.
Credit
loss rate is determined by historical collection based on aging schedule, adjusted for current conditions using reasonable and supportable
forecasts. Based on the aging categorization and the adjusted loss rate per category, an allowance for credit losses is calculated by
multiplying the adjusted loss rate with the amortized cost in the respective age category.
Recently
Issued Accounting Standards
The
Company reviews new accounting standards as issued. Management has not identified any other new standards that it believes will have
a significant impact on the Company’s financial statements.
3.
BUSINESS COMBINATIONS
On
December 22, 2022, the Company acquired 100% equity interest in StarFIN Holdings Limited in exchange, the Company issue 8,232,038 restricted
shares of the Company’s common stock, valued at $9,055,242. The consideration was derived from an agreed valuation of SFHL at $9,055,242.
The acquisition was consummated on January 20, 2023.
The
acquisition of SFHL has been accounted for under the purchase method of accounting in accordance with Statement of Financial Accounting
Standards No. 141, “Business Combinations.” Under the purchase method of accounting, the purchase price is allocated to the
assets acquired and liabilities assumed based on their estimated fair values.
The
allocation of the purchase price has been prepared based on preliminary estimates of fair values. However, actual amounts recorded upon
the finalization of estimates of fair values may differ from the information presented in these unaudited pro forma condensed combined
consolidated financial statements. The Company estimates of the fair values of the assets and liabilities of SFHL have been combined
with the recorded values of the assets and liabilities of SFHL in the audited condensed combined financial information, goodwill was
immediately impaired upon recognition. Allocation of the purchase price is summarized below:
SCHEDULE
OF PURCHASE PRICE ALLOCATION
| | |
| | |
| Cash and cash equivalents | |
$ | 705,480 | |
| Trade receivables, net | |
| 676,396 | |
| Deposits paid, prepayments and other receivables | |
| 202,414 | |
| Tax assets | |
| 539,969 | |
| Investment in Associates – Murni StarFIN Sdn Bhd | |
| 8,657 | |
| Property, plant and equipment, net | |
| 585,816 | |
| Trade payable | |
| (24,736 | ) |
| Accrued expenses and other payables | |
| (734,476 | ) |
| Deferred tax liabilities | |
| (213,524 | ) |
| Hire purchase loan | |
| (16,554 | ) |
| Amount due to directors | |
| (283,703 | ) |
| Amount due to related parties | |
| (1,673 | ) |
| Adjustment for foreign exchange fluctuation | |
| 260,052 | |
| Fair value of StarFIN Holdings Limited | |
$ | 1,704,118 | |
| Fair value of consideration | |
| (9,055,242 | ) |
| Goodwill | |
$ | 7,351,124 | |
| Goodwill impairment | |
| (7,351,124 | ) |
4.
TRADE RECEIVABLE
SCHEDULE OF TRADE RECEIVABLE
| | |
As of September 30, 2023 | | |
As of December 31, 2022 | |
| Trade receivable, gross | |
$ | 612,461 | | |
$ | - | |
| Allowance for expected credit loss | |
| (82,220 | ) | |
| - | |
| Trade receivable, net | |
$ | 530,241 | | |
$ | - | |
5.
PREPAYMENT, DEPOSITS AND OTHER RECEIVABLES
SCHEDULE OF PREPAID EXPENSES AND DEPOSITS AND OTHER RECEIVABLES
| | |
As of September 30, 2023 | | |
As of December 31, 2022 | |
| Prepaid expenses | |
| 109,044 | | |
| - | |
| Other receivables | |
| 353 | | |
| 3,000 | |
| Other deposits | |
| 30,419 | | |
| - | |
| Total | |
$ | 139,816 | | |
$ | 3,000 | |
The
rental deposits represent the deposit of the tenancy agreements.
Prepaid
expenses include website domain, third party software maintenance and subscription, rental, employee and motor vehicle insurance.
Other
receivables includes receivables from management of car park for director and employees.
Other
deposits primarily consist of deposit made for security deposit for renovation.
6.
PROPERTY, PLANT AND EQUIPMENT, NET
SCHEDULE OF PLANT AND EQUIPMENT
| | |
As of September 30, 2023 | | |
As of December 31, 2022 | |
| Computer systems | |
$ | 253,420 | | |
$ | - | |
| Furniture and fittings | |
| 78,128 | | |
| - | |
| Electrical fittings | |
| 9,587 | | |
| - | |
| Handphone | |
| 48,358 | | |
| - | |
| Office equipment | |
| 91,146 | | |
| - | |
| Renovation | |
| 81,221 | | |
| - | |
| Motor vehicle | |
| 356,492 | | |
| - | |
| Property | |
| 394,019 | | |
| - | |
| Total property, plant and equipment | |
$ | 1,312,371 | | |
$ | - | |
| Less: Accumulated depreciation | |
| (792,408 | ) | |
| - | |
| Total property, plant and equipment, net | |
$ | 519,963 | | |
$ | - | |
SCHEDULE OF INVESTMENT IN PROPERTY AND PLANT
| | |
For nine months
ended
September 30,
2023 | | |
For the year
ended
December 31,
2022 | |
| Investment in computer systems | |
$ | 17,479 | | |
$ | - | |
| Investment in furniture and fittings | |
| 374 | | |
| - | |
| Investment in electrical fittings | |
| 280 | | |
| - | |
| Investment in handphone | |
| 1,874 | | |
| - | |
| Investment in office equipment | |
| 6,216 | | |
| - | |
| Investment in renovation | |
| 4,097 | | |
| - | |
| Total investment in property and plant | |
$ | 30,320 | | |
$ | - | |
| | |
| | | |
| | |
| Depreciation for the period | |
| 34,234 | | |
$ | - | |
For
the year ended December 31, 2022, the Company acquired a property amounted $420,225 financed through loan from director which is unsecured,
non-interest bearing and payable on demand and cash in hand.
7.
OTHER PAYABLES AND ACCRUED LIABILITIES
SCHEDULE OF ACCRUED EXPENSES AND OTHER PAYABLES
| | |
As of September 30, 2023 | | |
As of December 31, 2022 | |
| Accrued expenses | |
$ | 205,112 | | |
$ | 17,805 | |
| Other payable | |
| 40,907 | | |
| - | |
| Receipt in advance | |
| 303,888 | | |
| - | |
| Total | |
$ | 549,907 | | |
$ | 17,805 | |
Accrued
expenses consist of outstanding audit fee, employee claims and salary, service tax and miscellaneous expenses.
Other
payable includes primarily service tax payable.
Receipt
in advance consist of monies received from customer but have yet to satisfied performance obligation.
8.
AMOUNT DUE TO DIRECTOR
As
of September 30, 2023, the company had an outstanding amount due to director amounted $221,038, mainly consist of a loan from Mr. Wong
Kai Cheng for the acquisition of property.
Aforementioned
amount is unsecured, non-interest bearing and payable on demand.
9.
AMOUNT DUE TO A RELATED PARTIES
As
of September 30, 2023, the Company has an outstanding amount due to a number of related companies with common director and shareholder
pertaining to miscellaneous expenses made by these related parties on behalf in aggregate amounted $978.
Aforementioned
amount is unsecured, non-interest bearing and payable on demand.
For
the nine months ended September 30, 2023, the Company has paid $69,366 to Ms. Tan Siew Meng, spouse of our Chief Executive Officer, Mr.
Wong Kai Cheong pertaining to leasing of office space.
10.
HIRE PURCHASE
On
April 30, 2021, the Company through subsidiary acquired a motor vehicle amounted $69,148 financed by $36,006 hire purchase loan for 36
months at a fixed flat rate of 1.88% per annum with first installment commencing June 5, 2021 and monthly installment amounted approximately
$1,063. Remaining balance finance through cash in hand.
For
the nine months ended September 30, 2023, the Company repaid $8,405 in hire purchase loan with an outstanding $7,406 as of September
30, 2023.
Maturities
of the loan for each of the two years and thereafter are as follows:
SCHEDULE OF MATURITIES OF THE LOAN
| Year ending December 31 | |
| | |
| 2023 | |
$ | 2,756 | |
| 2024 | |
$ | 4,650 | |
| Total | |
$ | 7,406 | |
11.
LEASE RIGHT-OF-USE ASSET AND LEASE LIABILITIES
SCHEDULE OF LEASE RIGHT OF USE ASSETS AND LEASE LIABILITIES
| Right-Of-Use Assets | |
| | |
| Purchase price allocation pertaining to acquisition of StarFIN Holdings Limited | |
$ | 134,807 | |
| New lease recognized | |
| 16,513 | |
| Amortization for the nine months ended September 30, 2023 | |
| (65,252 | ) |
| Adjustment for foreign currency translation difference | |
| (6,161 | ) |
| Balance as of September 30, 2023 | |
$ | 79,907 | |
| | |
| | |
| Lease Liability | |
| | |
| Purchase price allocation pertaining to acquisition of StarFIN Holdings Limited | |
$ | 134,807 | |
| New lease recognized | |
| 16,513 | |
| Imputed interest for nine months ended September 30, 2023 | |
| 4,114 | |
| Gross repayment for nine months ended September 30, 2023 | |
| (69,366 | ) |
| Adjustment for foreign currency translation difference | |
| (6,161 | ) |
| Balance as of September 30, 2023 | |
| 79,907 | |
| | |
| | |
| Lease liability current portion | |
| 74,204 | |
| Lease liability non-current portion | |
$ | 5,703 | |
Other
information:
SCHEDULE OF OTHER INFORMATION
| | |
Nine months ended
September 30, 2023 | | |
Nine months ended
September 30, 2022 | |
| Cash paid for amounts included in the measurement of lease liabilities: | |
| | | |
| | |
| Operating cash flow to operating lease | |
$ | 69,366 | | |
$ | - | |
| Right-of-use assets obtained in exchange for operating lease liabilities | |
| - | | |
| - | |
| Remaining lease term for operating lease (years) | |
| 1.02 | | |
| - | |
| Weighted average discount rate for operating lease | |
| 5.40 | % | |
| - | % |
12.
RELATED PARTY TRANSACTIONS
For the nine months ended September 30, 2023 and 2022, the Company has following transactions with related parties:
SCHEDULE
OF RELATED PARTIES TRANSACTIONS
| | |
Nine months ended September 30, 2023 | | |
Nine months ended September 30, 2022 | |
| Purchases | |
| | | |
| | |
| - Insite MY International, Inc. | |
$ | 92,632 | | |
$ | - | |
| | |
| | | |
| | |
| Total | |
$ | 92,632 | | |
$ | - | |
Our Chief Executive Officer, Mr. Wong Kai Cheong is a majority shareholder of Insite MY International, Inc.
13. CONCENTRATION OF RISK
For
the three months ended September 30, 2023, the Company generated total revenue of $695,145, of which two customers accounted for more
than 10% of the Company’s total revenue. For the three months ended September 30, 2022, the Company does not generate any revenue
and hence there was no customer accounted for more than 10% of the Company’s revenue. The customers who accounted for more than
10% of the Company’s total revenue and its outstanding receivable balance at period-end is presented below:
SCHEDULE OF CONCENTRATION OF RISK
| | |
For the three months ended September 30 | |
| | |
2023 | | |
2022 | | |
2023 | | |
2022 | | |
2023 | | |
2022 | |
| | |
Revenue | | |
Percentage of Revenue | | |
Accounts receivable, gross | |
| | |
| | |
| | |
| | |
| | |
| | |
| |
| Customer F | |
$ | 96,312 | | |
$ | - | | |
| 14 | % | |
| - | % | |
$ | - | | |
$ | - | |
| Customer G | |
| 71,499 | | |
| - | | |
| 10 | % | |
| - | | |
| 76,696 | | |
| - | |
| Others | |
| 527,334 | | |
| - | | |
| 76 | % | |
| - | % | |
| 535,765 | | |
| - | |
| Total | |
$ | 695,145 | | |
$ | - | | |
| 100 | % | |
| - | % | |
$ | 612,461 | | |
$ | - | |
For
the nine months ended September 30, 2023, the Company generated total revenue of $1,813,426, of which no customer accounted for more
than 10% of the Company’s total revenue. For the nine months ended September 30, 2022, the Company does not generate any revenue
and hence there was no customer accounted for more than 10% of the Company’s revenue.
For
the three months ended September 30, 2023, the Company incurred cost of revenue of $33,524, of which two suppliers accounted for more
than 10% of the Company’s cost of revenue. For the three months ended September 30, 2022, the Company does not incur any cost of
revenue and hence there was no supplier accounted for more than 10% of the Company’s cost of revenue. The suppliers who accounted
for more than 10% of the Company’s cost of revenue and its outstanding payable balance at period-end is presented below:
SCHEDULE OF CONCENTRATION OF RISK
| |
|
For
the three months ended September 30 |
|
| |
|
2023 |
|
|
2022 |
|
|
2023 |
|
|
2022 |
|
|
2023 |
|
|
2022 |
|
| |
|
Cost
of revenue |
|
|
Percentage
of
Cost
of revenue |
|
|
Accounts
payable,
trade |
|
| |
|
|
|
|
|
|
|
|
|
|
|
|
|
|
|
|
|
|
| Supplier
A |
|
$ |
46,018 |
|
|
$ |
- |
|
|
|
76 |
% |
|
|
- |
% |
|
$ |
19,027 |
|
|
$ |
- |
|
| Supplier
B |
|
|
9,362 |
|
|
|
- |
|
|
|
15 |
% |
|
|
- |
% |
|
|
3,367 |
|
|
|
- |
|
| Others |
|
|
5,358 |
|
|
|
- |
|
|
|
9 |
% |
|
|
- |
% |
|
|
162 |
|
|
|
- |
|
| Total |
|
$ |
33,524 |
|
|
$ |
- |
|
|
|
100 |
% |
|
|
- |
% |
|
$ |
22,556 |
|
|
$ |
- |
|
For
the nine months ended September 30, 2023, the Company incurred cost of revenue of $147,924, of which two suppliers accounted for more
than 10% of the Company’s cost of revenue. For the nine months ended September 30, 2022, the Company does not incur any cost of
revenue and hence there was no supplier accounted for more than 10% of the Company’s cost of revenue. The suppliers who accounted
for more than 10% of the Company’s cost of revenue and its outstanding payable balance at period-end is presented below:
| | |
For the nine months ended September 30 | |
| | |
2023 | | |
2022 | | |
2023 | | |
2022 | | |
2023 | | |
2022 | |
| | |
Cost of revenue | | |
Percentage of Cost of revenue | | |
Accounts payable, trade | |
| | |
| | |
| | |
| | |
| | |
| | |
| |
| Supplier A | |
$ | 92,632 | | |
$ | - | | |
| 63 | % | |
| - | % | |
$ | 19,027 | | |
$ | - | |
| Supplier B | |
| 32,053 | | |
| - | | |
| 22 | % | |
| - | % | |
| 3,367 | | |
| - | |
| Others | |
| 23,239 | | |
| - | | |
| 15 | % | |
| - | % | |
| 162 | | |
| - | |
| Total | |
$ | 147,924 | | |
$ | - | | |
| 100 | % | |
| - | % | |
$ | 22,556 | | |
$ | - | |
Our
Chief Executive Officer, Mr. Wong Kai Cheong is a majority shareholder of Supplier A.
14.
INCOME TAXES
The
loss before income taxes of the Company for the nine months ended September 30, 2023 and 2022 were comprised of the following:
SCHEDULE OF COMPONENTS OF LOSS BEFORE INCOME TAXES
| | |
| | | |
| | |
| | |
For the nine months ended September 30 | |
| | |
2023 | | |
2022 | |
| Tax jurisdictions from: | |
| | | |
| | |
| - Local | |
$ | ) | |
$ | ) |
| - Foreign, representing: | |
| | | |
| | |
| British Virginia Island (non-taxable jurisdiction) | |
| (300 | ) | |
| - | |
Provision
for income taxes consisted of the following:
SCHEDULE OF PROVISION FOR INCOME TAXES
| | |
| | | |
| | |
| | |
For the nine months ended September 30 | |
| | |
2023 | | |
2022 | |
| Current: | |
| | | |
| | |
| - Local | |
$ | - | | |
$ | - | |
| - Foreign | |
$ | (29,409 | ) | |
$ | (1,137 | ) |
| | |
| | | |
| | |
| Deferred tax assets: | |
| | | |
| | |
| - Local | |
$ | - | | |
$ | - | |
| - Foreign | |
$ | 819 | | |
$ | - | |
| | |
| | | |
| | |
| Deferred tax liabilities: | |
| | | |
| | |
| - Local | |
$ | - | | |
$ | - | |
| - Foreign | |
$ | 12,824 | | |
$ | - | |
| | |
| | | |
| | |
| Income tax payable: | |
| | | |
| | |
| - Local | |
$ | - | | |
$ | - | |
| - Foreign | |
$ | 3,357 | | |
$ | - | |
| | |
| | | |
| | |
| Income tax assets: | |
| | | |
| | |
| - Local | |
$ | - | | |
$ | - | |
| - Foreign | |
$ | 243,227 | | |
$ | - | |
All
Malaysia companies are subject to the Malaysia Corporate Tax Laws at a two-tier corporate income tax rate based on amount of paid-up
capital. The 2022 tax rate for company with paid-up capital of MYR2,500,000
(approximately $567,872) or less and
that are not part of a group containing a company exceeding this capitalization threshold is 17%
on the first MYR600,000
(approximately $136,289)
taxable profit with the remaining balance being taxed at 24%.
15.
DIVIDEND
For
the year ended December 31, 2022, Insite MY Innovations Sdn Bhd and Insite MY Systems Sdn Bhd, passed a board resolution for
declaration of dividend amounted MYR1,700,000
(approximately $385,680)
and MYR4,294,000
(approximately $974,182),
respectively to StarFIN Asia Sdn Bhd. Subsequently, StarFIN Asia Sdn Bhd passed a board resolution for declaration of dividend
amounted MYR5,794,000
(approximately $1,314,488) to Mr. Wong Kai Cheong and Mr. Hoo Swee Ping, before acquired by StarFIN Holdings Limited on January 20,
2023.
No
dividend was declared for the nine months ended September 30, 2023.
16.
FOREIGN CURRENCY EXCHANGE RATE
The
Company cannot guarantee that the current exchange rate will remain stable, therefore there is a possibility that the Company could post
the same amount of income for two comparable periods and because of the fluctuating exchange rate post higher or lower income depending
on exchange rate converted into US$ at the end of the financial year. The exchange rate could fluctuate depending on changes in political
and economic environments without notice.
17.
SEGMENT REPORTING
ASC
280, “Segment Reporting” establishes standards for reporting information about operating segments on a basis consistent with
the Company’s internal organization structure as well as information about services categories, business segments and major customers
in financial statements. The Company has single reportable segment based on business unit, information technology business and two reportable
segments based on country, Malaysia and Non-Malaysia.
In
accordance with the “Segment Reporting” Topic of the ASC, the Company’s chief operating decision maker has been identified
as the Chief Executive Officer and President, who reviews operating results to make decisions about allocating resources and assessing
performance for the entire Company. Existing guidance, which is based on a management approach to segment reporting, establishes requirements
to report selected segment information quarterly and to report annually entity-wide disclosures about products and services, major customers,
and the countries in which the entity holds material assets and reports revenue. All material operating units qualify for aggregation
under “Segment Reporting” due to their similar customer base and similarities in economic characteristics; nature of products
and services; and procurement, manufacturing and distribution processes.
SCHEDULE OF SEGMENT REPORTING
| | |
For the Nine Months Ended and As of September 30, 2023 | |
| By Business Unit | |
Information Technology Business | | |
Total | |
| Revenue | |
$ | 1,813,426 | | |
$ | 1,813,426 | |
| | |
| | | |
| | |
| Cost of revenue | |
| (147,924 | ) | |
| (147,924 | ) |
| | |
| | | |
| | |
| Gross profit | |
$ | 1,665,502 | | |
$ | 1,665,502 | |
| | |
| | | |
| | |
| Selling, general and administrative expenses and other income | |
| (2,122,375 | ) | |
| (2,122,375 | ) |
| | |
| | | |
| | |
| Loss from operations | |
| (456,873 | ) | |
| (456,873 | ) |
| | |
| | | |
| | |
| Total assets | |
$ | 2,695,731 | | |
$ | 2,695,731 | |
| Capital expenditure | |
$ | 30,320 | | |
$ | 30,320 | |
| | |
For the Nine Months Ended and As of September 30, 2023 | |
| By Country | |
Malaysia | | |
Non-Malaysia | | |
Total | |
| Revenue | |
$ | 1,813,426 | | |
$ | - | | |
$ | 1,813,426 | |
| | |
| | | |
| | | |
| | |
| Cost of revenue | |
| (147,924 | ) | |
| - | | |
| (147,924 | ) |
| | |
| | | |
| | | |
| | |
| Gross profit | |
$ | 1,665,502 | | |
$ | - | | |
$ | 1,665,502 | |
| | |
| | | |
| | | |
| | |
| Selling, general and administrative expenses and other income | |
| (1,927,468 | ) | |
| (194,907 | ) | |
| (2,122,375 | ) |
| | |
| | | |
| | | |
| | |
| Loss from operations | |
| (261,966 | ) | |
| (194,907 | ) | |
| (456,873 | ) |
| | |
| | | |
| | | |
| | |
| Total assets | |
$ | 2,658,020 | | |
$ | 37,711 | | |
$ | 2,695,731 | |
| Capital expenditure | |
$ | 30,320 | | |
$ | - | | |
$ | 30,320 | |
| | |
For the Nine Months Ended and As of September 30, 2022 | |
| By Business Unit | |
Information Technology Business | | |
Total | |
| Revenue | |
$ | - | | |
$ | - | |
| | |
| | | |
| | |
| Cost of revenue | |
| - | | |
| - | |
| | |
| | | |
| | |
| Gross profit | |
$ | - | | |
$ | - | |
| | |
| | | |
| | |
| General and administrative expenses and other income | |
| (63,576 | ) | |
| (63,576 | ) |
| | |
| | | |
| | |
| Loss from operations | |
| (63,576 | ) | |
| (63,576 | ) |
| | |
| | | |
| | |
| Total assets | |
$ | 919,874 | | |
$ | 919,874 | |
| Capital expenditure | |
$ | - | | |
$ | - | |
| | |
For the Nine Months Ended and As of September 30, 2022 | |
| By Country | |
Malaysia | | |
Non-Malaysia | | |
Total | |
| Revenue | |
$ | - | | |
$ | - | | |
$ | - | |
| | |
| | | |
| | | |
| | |
| Cost of revenue | |
| - | | |
| - | | |
| - | |
| | |
| | | |
| | | |
| | |
| Gross profit | |
$ | - | | |
$ | - | | |
$ | - | |
| | |
| | | |
| | | |
| | |
| General and administrative expenses and other income | |
| - | | |
| (63,576 | ) | |
| (63,576 | ) |
| | |
| | | |
| | | |
| | |
| Loss from operations | |
| - | | |
| (63,576 | ) | |
| (63,576 | ) |
| | |
| | | |
| | | |
| | |
| Total assets | |
$ | - | | |
$ | 919,874 | | |
$ | 919,874 | |
| Capital expenditure | |
$ | - | | |
$ | - | | |
$ | - | |
18.
SUBSEQUENT EVENTS
In
accordance with ASC Topic 855, “Subsequent Events”, which establishes general standards of accounting for and disclosure
of events that occur after the balance sheet date but before financial statements are issued, the Company has evaluated all events or
transactions that occurred after September 30, 2023 up through the date the Company presented these unaudited financial statements.
ITEM
2. MANAGEMENT’S DISCUSSION AND ANALYSIS OF FINANCIAL CONDITION AND RESULTS OF OPERATIONS
The
information contained in this quarter report on Form 10-Q is intended to update the information contained in our Form 10-K dated February
16, 2023, for the year ended December 31, 2022 and presumes that readers have access to, and will have read, the “Management’s
Discussion and Analysis of Financial Condition and Results of Operations” and other information contained in such Form 10-K. The
following discussion and analysis also should be read together with our financial statements and the notes to the financial statements
included elsewhere in this Form 10-Q.
The
following discussion contains certain statements that may be deemed “forward-looking statements” within the meaning of the
Private Securities Litigation Reform Act of 1995. Such statements appear in a number of places in this Report, including, without limitation,
“Management’s Discussion and Analysis of Financial Condition and Results of Operations.” These statements are not guarantees
of future performance and involve risks, uncertainties and requirements that are difficult to predict or are beyond our control. Forward-looking
statements speak only as of the date of this quarter report. You should not put undue reliance on any forward-looking statements. We
strongly encourage investors to carefully read the factors described in our Form S-1/A registration statement, filed on March 19, 2021,
in the section entitled “Risk Factors” for a description of certain risks that could, among other things, cause actual results
to differ from these forward-looking statements. We assume no responsibility to update the forward-looking statements contained in this
quarter report on Form 10-Q. The following should also be read in conjunction with the unaudited Condensed Consolidated Financial Statements
and notes thereto that appear elsewhere in this report.
Company
Overview
Our
Company offer range of system solutions in Payment Processing, Robotic Process Automation (RPA), and Regulatory Technology (RegTech)
to financial institutions, regulatory agencies, professional service providers and private enterprises from various industries, with
existing client in the Asia region with over 60 key bank customers on payment processing and our Robotic Process Automation solution
company has more than 100 customers in Asia. Our solutions includes:
Payment
Processing
We
have our own web-based payment processing system for check clearing used in central banks, financial institutions and payment system
providers. This image-based check truncation system (CTS) is similar to the one used in the United States of America, under the CHECK21
standards. Our CTS systems are sold in Malaysia, Singapore, Indonesia, Philippines, Myanmar, Thailand, Pakistan and Bangladesh.
We
also have a ISO20022 compliant payment gateway solutions for central bank and financial institutions that is capable of supporting the
Straight Through Processing (STP) of all types of payment transactions (including SWIFT, Real-Time Gross Settlement (RTGS), GIRO (NACHA
standards) and FAST payment and extendable to interface with various types of payment gateways. Our STP payment gateway are sold in Malaysia,
Myanmar and Indonesia.
RegTech
We
have a regulatory and financial reporting (RegTech) system which conform to XBRL reporting standards and other compliance reporting required
by Regulatory agencies such as Central Bank, Securities Commission, Tax Authority Department and Companies Registry. Our reporting platform
covers financial statistic reporting, credit risk exposure and analysis, risk management reports, FATCA & CRS reporting, external
sector reporting, Goods and Services Tax (GST) reporting for reporting entities. We have more than 20 financial institutions using our
platform.
Robotic
Process Automation
We
have our own Artificial Intelligent (AI) based, Robotic Process Automation Software (RPA) solutions for financial institutions, large
corporations and small medium enterprises. RPA utilises software Robots for the automation of mundane, labour intensive, manual computer
operations. Robots are utilized for the processes where it helps to reduce operational costs and also costs arising from human error.
Our system automate the capturing of customer information from identity cards, passports and other identification peripherals. Our solution
automatically extract data from customers’ identity card, passport, etc. and immediately fill-in the forms, eliminating the friction
and errors caused by manual input, through Intelligent Character Recognition technology and other AI based technologies. Information
extracted from an official identification document will then be checked against existing financial institutions database for regulatory
screening in Internal Blacklist Check, Anti Money Laundering, Credit Scoring Check, FATCA, Common Reporting Standard (CRS) and ESG reporting,
etc.
Results
of operations
Three
months ended September 30, 2023 and 2022
Revenues
For
the three months ended September 30, 2023, the Company generated revenue in the amount of $695,145. The revenue was generated as a result
of the Company having provided services related to information technology business to the customers.
For
the three months ended September 30, 2022, the Company does not generate any revenue.
Selling,
General and Administrative Expenses
For
the three months ended September 30, 2023, the Company had selling, general and administrative expenses in the amount of $737,279. These
were primarily comprised of salary expenses, audit fees, insurance and other professional fees.
For
the three months ended September 30, 2022, the Company had general and administrative expenses in the amount of $12,629. These were primarily
comprised of audit fees and other professional fees.
The
significant increase of the general and administrative expenses was the result of the significant increase in salary expenses as the
Company hired more employees to expand their business.
Net
Loss
For
the three months ended September 30, 2023, the Company has incurred a net loss of $74,394.
For
the three months ended September 30, 2022, the Company has incurred a net loss of $10,879.
Nine
months ended September 30, 2023 and 2022
Revenues
For
the nine months ended September 30, 2023, the Company generated revenue in the amount of $1,813,426. The revenue was generated as a result
of the Company having provided services related to information technology business to the customers.
For
the nine months ended September 30, 2022, the Company does not generate any revenue.
Selling,
General and Administrative Expenses
For
the nine months ended September 30, 2023, the Company had selling, general and administrative expenses in the amount of $2,122,375. These
were primarily comprised of salary expenses, audit fees, insurance and other professional fees.
For
the nine months ended September 30, 2022, the Company had general and administrative expenses in the amount of $63,576. These were primarily
comprised of audit fees and other professional fees.
The
significant increase of the general and administrative expenses was the result of the significant increase in salary expenses as the
Company hired more employees to expand their business.
Net
Loss
For
the nine months ended September 30, 2023, the Company has incurred a net loss of $418,304.
For
the nine months ended September 30, 2022, the Company has incurred a net loss of $55,552.
Liquidity
and Capital Resources
Nine
months ended September 30, 2023 and 2022
Cash
Used In Operating Activities
For the nine months ended September 30, 2023, the Company has used $282,345 in operating activity, of which primarily consist of net loss,
minority interest, decrease in account payable, decrease in other payables and accrued liabilities and reduction in lease liability contra
by share of loss from operation of associate, depreciation and amortization, decrease in account receivable, decrease in prepayment, deposits
and other receivables, increase in deferred revenue, increase in tax assets and increase in deferred income tax assets.
For
the nine months ended September 30, 2022, the Company has used $63,807 in operating activity, of which primarily consist of net loss,
decrease in account payable, increase in prepayment, deposits and other receivables and decrease in other payables and accrued liabilities
contra by decrease in income tax payable.
Cash
Used In Investing Activities
For
the nine months ended September 30, 2023 and 2022, the Company has invested $30,320 and $0 in investing activities, respectively for
the acquisition of computer systems and office equipment.
Cash
Provided by Financing Activities
For
the nine months ended September 30, 2023, the Company has used $55,746 in financing activity, primarily consist of advances to director.
For
the nine months ended September 30, 2022, the Company did not receive nor used any cash in financing activity.
Off-balance
Sheet Arrangements
We
have no significant off-balance sheet arrangements that have or are reasonably likely to have a current or future effect on our financial
condition, changes in our financial condition, revenues or expenses, results of operations, liquidity, capital expenditures or capital
resources that are material to our stockholders as of September 30, 2023.
Contractual
Obligations
As
a smaller reporting company, we are not required to provide the aforementioned information.
Critical
Accounting Policies
The
Company reviews new accounting standards as issued. Management has not identified any other new standards that it believes will have
a significant impact on the Company’s consolidated financial statements.
Item
3 Quantitative and Qualitative Disclosures About Market Risk.
As
a “smaller reporting company” as defined by Item 10 of Regulation S-K, the Company is not required to provide information
required by this Item.
Item
4 Controls and Procedures.
Disclosure
Controls and Procedures
We
maintain disclosure controls and procedures, as defined in Rule 13a-15(e) promulgated under the Securities Exchange Act of 1934 (the
“Exchange Act”), that are designed to ensure that information required to be disclosed by us in the reports that we file
or submit under the Exchange Act is recorded, processed, summarized and reported within the time periods specified in the Securities
and Exchange Commission’s rules and forms and that such information is accumulated and communicated to our management, including
our principal executive and principal financial officers, or persons performing similar functions, as appropriate, to allow timely decisions
regarding required disclosure.
We
carried out an evaluation, under the supervision and with the participation of our management, including our chief executive officer,
of the effectiveness of our disclosure controls and procedures as of September 30, 2023. Based on the evaluation of these disclosure
controls and procedures, and in light of the material weaknesses found in our internal controls over financial reporting, our chief executive
officer concluded that our disclosure controls and procedures were not effective. The matters involving internal controls and procedures
that our management considered to be material weaknesses under the standards of the Public Company Accounting Oversight Board were: (i)
lack of a functioning audit committee due to a lack of a majority of independent members and a lack of a majority of outside directors
on our board of directors, resulting in ineffective oversight in the establishment and monitoring of required internal controls and procedures;
(ii) inadequate segregation of duties and effective risk assessment; (iii) insufficient written policies and procedures for accounting
and financial reporting with respect to the requirements and application of both US GAAP and SEC guidelines; and (iv) lack of internal
audit function due to the fact that the Company lacks qualified resources to perform the internal audit functions properly and that the
scope and effectiveness of the internal audit function are yet to be developed. The aforementioned material weaknesses were identified
by our chief executive officer in connection with the review of our financial statements as of September 30, 2023.
Management’s
Report on Internal Control over Financial Reporting
Our
management is responsible for establishing and maintaining adequate internal control over financial reporting as defined in Rules 13a-15(f)
and 15d-15(f) under the Exchange Act. Our internal control over financial reporting is designed to provide reasonable assurance regarding
the reliability of financial reporting and the preparation of financial statements for external purposes in accordance with generally
accepted accounting principles. The internal controls for the Company are provided by executive management’s review and approval
of all transactions. Our internal control over financial reporting also includes those policies and procedures that:
| |
1. |
pertain
to the maintenance of records that in reasonable detail accurately and fairly reflect the transactions and dispositions of our assets; |
| |
|
|
| |
2. |
provide
reasonable assurance that transactions are recorded as necessary to permit preparation of financial statements in accordance with
U.S. GAAP, and that our receipts and expenditures are being made only in accordance with the authorization of our management; and |
| |
|
|
| |
3. |
provide
reasonable assurance regarding prevention or timely detection of unauthorized acquisition, use or disposition of our assets that
could have a material effect on the financial statements. |
Because
of its inherent limitations, internal control over financial reporting may not prevent or detect misstatements. Also, projections of
any evaluation of effectiveness to future periods are subject to the risk that controls may become inadequate because of changes in conditions,
or that the degree of compliance with the policies or procedures may deteriorate.
Management
assessed the effectiveness of the Company’s internal control over financial reporting as of September 30, 2023. In making this
assessment, management used the criteria set forth by the Committee of Sponsoring Organizations of the Treadway Commission in Internal
Control-Integrated Framework. Management’s assessment included an evaluation of the design of our internal control over financial
reporting and testing of the operational effectiveness of these controls.
As
of September 30, 2023, management assessed the effectiveness of our internal control over financial reporting based on the criteria for
effective internal control over financial reporting established in Internal Control — Integrated Framework issued by the Committee
of Sponsoring Organizations of the Treadway Commission (“COSO”) in 2013 and SEC guidance on conducting such assessments.
Based on such evaluation, the Company’s management concluded that, during the period covered by this Report, our internal control
over financial reporting were not effective due to the presence of material weaknesses.
Changes
in Internal Control over Financial Reporting:
There
were no changes in our internal control over financial reporting during the nine months ending September 30, 2023, that have materially
affected, or are reasonably likely to materially affect, our internal control over financial reporting.
PART
II — OTHER INFORMATION
Item
1. Legal Proceedings
We
are not subjected to nor engaged in any litigation, arbitration or claim of material importance, and no litigation, arbitration or claim
of material importance is known to us to be pending or threatened by or against our Company that would have a material adverse effect
on our Company’s results of operations or financial condition. Further, there are no proceedings in which any of our directors,
officers or affiliates, or any beneficial shareholder are an adverse party or has a material interest adverse to our Company.
Item
2. Unregistered Sales of Equity Securities and Use of Proceeds
None.
Item
3. Defaults Upon Senior Securities
None.
Item
4. Mine Safety Disclosures
Not
applicable.
Item
5. Other Information.
None.
ITEM
6. Exhibits
SIGNATURES
Pursuant
to the requirements of Section 13 or 15(d) of the Securities Exchange Act of 1934, the Registrant has duly caused this Report to be signed
on its behalf by the undersigned, thereunto duly authorized.
| |
AsiaFIN
Holdings Corp. |
| |
(Name
of Registrant) |
| |
|
| Date:
November 13, 2023 |
By: |
/s/
Wong Kai Cheong |
| |
Title:
|
Chief
Executive Officer,
President,
Director, Secretary and Treasurer |
| |
|
(Principal
Executive Officer) |
| |
|
|
| Date:
November 13, 2023 |
By: |
/s/
Cham Hui Yin |
| |
Title:
|
Finance
Manager |
| |
|
(Principal
Financial Officer and Principal Accounting Officer) |
EXHIBIT
31.1
CERTIFICATION
I,
WONG KAI CHEONG, certify that:
1.
I have reviewed this quarterly report on Form 10-Q of AsiaFIN Holdings Corp. (the “Company”) for the quarter ended September
30, 2023;
2.
Based on my knowledge, this quarterly report does not contain any untrue statement of a material fact or omit to state a material fact
necessary to make the statements made, in light of the circumstances under which such statements were made, not misleading with respect
to the period covered by this report;
3.
Based on my knowledge, the financial statements, and other financial information included in this report, fairly present in all material
respects the financial condition, results of operations and cash flows of the registrant as of, and for, the periods presented in this
report;
4.
The registrant’s other certifying officer and I are responsible for establishing and maintaining disclosure controls and procedures
(as defined in Exchange Act Rules 13a-15I and 15d-15(e)) and internal control over financial reporting (as defined in Exchange Act Rules
13a-15(f) and 15d-15(f)) for the registrant and have:
| |
a. |
Designed
such disclosure controls and procedures, or caused such disclosure controls and procedures to be designed under our supervision,
to ensure that material information relating to the registrant, including its consolidated subsidiaries, is made known to us by others
within those entities, particularly during the period in which this report is being prepared; |
| |
|
|
| |
b. |
Designed
such internal control over financial reporting, or caused such internal control to be designed under our supervision, to provide
reasonable assurance regarding the reliability of financial reporting and the preparation of financial statements for external purposes
in accordance with generally accepted accounting principles. |
| |
|
|
| |
c. |
Evaluated
the effectiveness of the registrant’s disclosure controls and procedures and presented in this report our conclusions about
the effectiveness of the disclosure controls and procedures, as of the end of the period covered by this report based on such evaluation;
and |
| |
|
|
| |
d. |
Disclosed
in this report any change in the registrant’s internal control over financial reporting that occurred during the registrant’s
most recent fiscal quarter (the registrant’s fourth fiscal quarter in the case of an annual report) that has materially affected,
or is reasonably likely to materially affect, the registrant’s internal control over financial reporting; and |
5.
The registrant’s other certifying officer and I have disclosed, based on our most recent evaluation of internal control over financial
reporting, to the registrant’s auditors and the audit committee of the registrant’s board of directors (or persons performing
the equivalent functions):
| |
a. |
All
significant deficiencies and material weaknesses in the design or operation of internal control over financial reporting which are
reasonably likely to adversely affect the registrant’s ability to record, process, summarize and report financial information;
and |
| |
|
|
| |
b. |
Any
fraud, whether or not material, that involves management or other employees who have a significant role in the registrant’s
internal control over financial reporting. |
| Date:
November 13, 2023 |
By:
|
/s/
WONG KAI CHEONG |
| |
|
WONG
KAI CHEONG |
| |
|
Chief
Executive Officer,
President,
Director, Secretary and Treasurer |
| |
|
(Principal
Executive Officer) |
EXHIBIT
31.2
CERTIFICATION
I,
CHAM HUI YIN, certify that:
1.
I have reviewed this quarterly report on Form 10-Q of AsiaFIN Holdings Corp. (the “Company”) for the quarter ended September
30, 2023;
2.
Based on my knowledge, this quarterly report does not contain any untrue statement of a material fact or omit to state a material fact
necessary to make the statements made, in light of the circumstances under which such statements were made, not misleading with respect
to the period covered by this report;
3.
Based on my knowledge, the financial statements, and other financial information included in this report, fairly present in all material
respects the financial condition, results of operations and cash flows of the registrant as of, and for, the periods presented in this
report;
4.
The registrant’s other certifying officer and I are responsible for establishing and maintaining disclosure controls and procedures
(as defined in Exchange Act Rules 13a-15(e) and 15d-15(e)) and internal control over financial reporting (as defined in Exchange Act
Rules 13a-15(f) and 15d-15(f)) for the registrant and have:
| |
a. |
Designed
such disclosure controls and procedures, or caused such disclosure controls and procedures to be designed under our supervision,
to ensure that material information relating to the registrant, including its consolidated subsidiaries, is made known to us by others
within those entities, particularly during the period in which this report is being prepared; |
| |
|
|
| |
b. |
Designed
such internal control over financial reporting, or caused such internal control to be designed under our supervision, to provide
reasonable assurance regarding the reliability of financial reporting and the preparation of financial statements for external purposes
in accordance with generally accepted accounting principles. |
| |
|
|
| |
c. |
Evaluated
the effectiveness of the registrant’s disclosure controls and procedures and presented in this report our conclusions about
the effectiveness of the disclosure controls and procedures, as of the end of the period covered by this report based on such evaluation;
and |
| |
|
|
| |
d. |
Disclosed
in this report any change in the registrant’s internal control over financial reporting that occurred during the registrant’s
most recent fiscal quarter (the registrant’s fourth fiscal quarter in the case of an annual report) that has materially affected,
or is reasonably likely to materially affect, the registrant’s internal control over financial reporting; and |
5.
The registrant’s other certifying officer and I have disclosed, based on our most recent evaluation of internal control over financial
reporting, to the registrant’s auditors and the audit committee of the registrant’s board of directors (or persons performing
the equivalent functions):
| |
a. |
All
significant deficiencies and material weaknesses in the design or operation of internal control over financial reporting which are
reasonably likely to adversely affect the registrant’s ability to record, process, summarize and report financial information;
and |
| |
|
|
| |
b. |
Any
fraud, whether or not material, that involves management or other employees who have a significant role in the registrant’s
internal control over financial reporting. |
| Date:
November 13, 2023 |
By:
|
/s/
CHAM HUI YIN |
| |
|
CHAM
HUI YIN |
| |
|
Finance
Manager |
| |
|
(Principal
Financial Officer and Principal Accounting Officer) |
EXHIBIT
32.1
CERTIFICATION
PURSUANT
TO 18
U.S.C.
SECTION 1350,
AS
ADOPTED
PURSUANT
TO
SECTION
906 OF THE SARBANES-OXLEY
ACT
OF 2002
In
connection with the quarterly report of AsiaFIN Holdings Corp. (the “Company”) on Form 10-Q for the period ending September
30, 2023 as filed with the Securities and Exchange Commission on the date hereof (the “Report”), The undersigned hereby certifies,
pursuant to 18 U.S.C. § 1350, as adopted pursuant to § 906 of the Sarbanes-Oxley Act of 2002, that, to the best of my knowledge
and belief:
| |
(1) |
The
Report fully complies with the requirements of section 13(a) or 15(d) of the Securities Exchange Act of 1934; and |
| |
|
|
| |
(2) |
The
information contained in the Report fairly presents, in all material respects, the financial condition and result of operations of
the Company. |
| Date:
November 13, 2023 |
By:
|
/s/
WONG KAI CHEONG |
| |
|
WONG
KAI CHEONG |
| |
|
Chief
Executive Officer,
President,
Director, Secretary and Treasurer |
| |
|
(Principal
Executive Officer) |
A
signed original of this written statement required by Section 906, or other document authenticating, acknowledging, or otherwise adopting
the signature that appears in typed form within the electronic version of this written statement has been provided to the Company and
will be retained by the Company and furnished to the Securities and Exchange Commission or its staff upon request.
EXHIBIT
32.2
CERTIFICATION
PURSUANT
TO 18
U.S.C.
SECTION 1350,
AS
ADOPTED
PURSUANT
TO
SECTION
906 OF THE SARBANES-OXLEY
ACT
OF 2002
In
connection with the quarterly report of AsiaFIN Holdings Corp. (the “Company”) on Form 10-Q for the period ending September
30, 2023 as filed with the Securities and Exchange Commission on the date hereof (the “Report”), The undersigned hereby certifies,
pursuant to 18 U.S.C. § 1350, as adopted pursuant to § 906 of the Sarbanes-Oxley Act of 2002, that, to the best of my knowledge
and belief:
| |
(1) |
The
Report fully complies with the requirements of section 13(a) or 15(d) of the Securities Exchange Act of 1934; and |
| |
|
|
| |
(2) |
The
information contained in the Report fairly presents, in all material respects, the financial condition and result of operations of
the Company. |
| Date:
November 13, 2023 |
By:
|
/s/
CHAM HUI YIN |
| |
|
CHAM
HUI YIN |
| |
|
Finance
Manager |
| |
|
(Principal
Financial Officer and Principal Accounting Officer) |
A
signed original of this written statement required by Section 906, or other document authenticating, acknowledging, or otherwise adopting
the signature that appears in typed form within the electronic version of this written statement has been provided to the Company and
will be retained by the Company and furnished to the Securities and Exchange Commission or its staff upon request.
v3.23.3
Cover - shares
|
9 Months Ended |
|
Sep. 30, 2023 |
Nov. 10, 2023 |
| Cover [Abstract] |
|
|
| Document Type |
10-Q
|
|
| Amendment Flag |
false
|
|
| Document Quarterly Report |
true
|
|
| Document Transition Report |
false
|
|
| Document Period End Date |
Sep. 30, 2023
|
|
| Document Fiscal Period Focus |
Q3
|
|
| Document Fiscal Year Focus |
2023
|
|
| Current Fiscal Year End Date |
--12-31
|
|
| Entity File Number |
000-56421
|
|
| Entity Registrant Name |
ASIAFIN
HOLDINGS CORP.
|
|
| Entity Central Index Key |
0001828748
|
|
| Entity Tax Identification Number |
37-1950147
|
|
| Entity Incorporation, State or Country Code |
NV
|
|
| Entity Address, Address Line One |
Suite
30.02, 30th Floor
|
|
| Entity Address, Address Line Two |
Menara KH (Promet)
|
|
| Entity Address, Address Line Three |
Jalan
Sultan Ismail
|
|
| Entity Address, City or Town |
Kuala Lumpur
|
|
| Entity Address, Country |
MY
|
|
| Entity Address, Postal Zip Code |
50250
|
|
| City Area Code |
+(60)
|
|
| Local Phone Number |
3
2148 7170
|
|
| Entity Current Reporting Status |
Yes
|
|
| Entity Interactive Data Current |
Yes
|
|
| Entity Filer Category |
Non-accelerated Filer
|
|
| Entity Small Business |
true
|
|
| Entity Emerging Growth Company |
true
|
|
| Elected Not To Use the Extended Transition Period |
false
|
|
| Entity Shell Company |
false
|
|
| Entity Common Stock, Shares Outstanding |
|
81,551,838
|
| X |
- DefinitionBoolean flag that is true when the XBRL content amends previously-filed or accepted submission.
| Name: |
dei_AmendmentFlag |
| Namespace Prefix: |
dei_ |
| Data Type: |
xbrli:booleanItemType |
| Balance Type: |
na |
| Period Type: |
duration |
|
| X |
- DefinitionEnd date of current fiscal year in the format --MM-DD.
| Name: |
dei_CurrentFiscalYearEndDate |
| Namespace Prefix: |
dei_ |
| Data Type: |
xbrli:gMonthDayItemType |
| Balance Type: |
na |
| Period Type: |
duration |
|
| X |
- DefinitionFiscal period values are FY, Q1, Q2, and Q3. 1st, 2nd and 3rd quarter 10-Q or 10-QT statements have value Q1, Q2, and Q3 respectively, with 10-K, 10-KT or other fiscal year statements having FY.
| Name: |
dei_DocumentFiscalPeriodFocus |
| Namespace Prefix: |
dei_ |
| Data Type: |
dei:fiscalPeriodItemType |
| Balance Type: |
na |
| Period Type: |
duration |
|
| X |
- DefinitionThis is focus fiscal year of the document report in YYYY format. For a 2006 annual report, which may also provide financial information from prior periods, fiscal 2006 should be given as the fiscal year focus. Example: 2006.
| Name: |
dei_DocumentFiscalYearFocus |
| Namespace Prefix: |
dei_ |
| Data Type: |
xbrli:gYearItemType |
| Balance Type: |
na |
| Period Type: |
duration |
|
| X |
- DefinitionFor the EDGAR submission types of Form 8-K: the date of the report, the date of the earliest event reported; for the EDGAR submission types of Form N-1A: the filing date; for all other submission types: the end of the reporting or transition period. The format of the date is YYYY-MM-DD.
| Name: |
dei_DocumentPeriodEndDate |
| Namespace Prefix: |
dei_ |
| Data Type: |
xbrli:dateItemType |
| Balance Type: |
na |
| Period Type: |
duration |
|
| X |
- DefinitionBoolean flag that is true only for a form used as an quarterly report. Reference 1: http://www.xbrl.org/2003/role/presentationRef
-Publisher SEC
-Name Form 10-Q
-Number 240
-Section 308
-Subsection a
| Name: |
dei_DocumentQuarterlyReport |
| Namespace Prefix: |
dei_ |
| Data Type: |
xbrli:booleanItemType |
| Balance Type: |
na |
| Period Type: |
duration |
|
| X |
- DefinitionBoolean flag that is true only for a form used as a transition report. Reference 1: http://www.xbrl.org/2003/role/presentationRef
-Publisher SEC
-Name Forms 10-K, 10-Q, 20-F
-Number 240
-Section 13
-Subsection a-1
| Name: |
dei_DocumentTransitionReport |
| Namespace Prefix: |
dei_ |
| Data Type: |
xbrli:booleanItemType |
| Balance Type: |
na |
| Period Type: |
duration |
|
| X |
- DefinitionThe type of document being provided (such as 10-K, 10-Q, 485BPOS, etc). The document type is limited to the same value as the supporting SEC submission type, or the word 'Other'.
| Name: |
dei_DocumentType |
| Namespace Prefix: |
dei_ |
| Data Type: |
dei:submissionTypeItemType |
| Balance Type: |
na |
| Period Type: |
duration |
|
| X |
- DefinitionAddress Line 1 such as Attn, Building Name, Street Name
| Name: |
dei_EntityAddressAddressLine1 |
| Namespace Prefix: |
dei_ |
| Data Type: |
xbrli:normalizedStringItemType |
| Balance Type: |
na |
| Period Type: |
duration |
|
| X |
- DefinitionAddress Line 2 such as Street or Suite number
| Name: |
dei_EntityAddressAddressLine2 |
| Namespace Prefix: |
dei_ |
| Data Type: |
xbrli:normalizedStringItemType |
| Balance Type: |
na |
| Period Type: |
duration |
|
| X |
- DefinitionAddress Line 3 such as an Office Park
| Name: |
dei_EntityAddressAddressLine3 |
| Namespace Prefix: |
dei_ |
| Data Type: |
xbrli:normalizedStringItemType |
| Balance Type: |
na |
| Period Type: |
duration |
|
| X |
- Definition
+ References
+ Details
| Name: |
dei_EntityAddressCityOrTown |
| Namespace Prefix: |
dei_ |
| Data Type: |
xbrli:normalizedStringItemType |
| Balance Type: |
na |
| Period Type: |
duration |
|
| X |
- DefinitionISO 3166-1 alpha-2 country code.
| Name: |
dei_EntityAddressCountry |
| Namespace Prefix: |
dei_ |
| Data Type: |
dei:countryCodeItemType |
| Balance Type: |
na |
| Period Type: |
duration |
|
| X |
- DefinitionCode for the postal or zip code
| Name: |
dei_EntityAddressPostalZipCode |
| Namespace Prefix: |
dei_ |
| Data Type: |
xbrli:normalizedStringItemType |
| Balance Type: |
na |
| Period Type: |
duration |
|
| X |
- DefinitionA unique 10-digit SEC-issued value to identify entities that have filed disclosures with the SEC. It is commonly abbreviated as CIK. Reference 1: http://www.xbrl.org/2003/role/presentationRef
-Publisher SEC
-Name Exchange Act
-Number 240
-Section 12
-Subsection b-2
| Name: |
dei_EntityCentralIndexKey |
| Namespace Prefix: |
dei_ |
| Data Type: |
dei:centralIndexKeyItemType |
| Balance Type: |
na |
| Period Type: |
duration |
|
| X |
- DefinitionIndicate number of shares or other units outstanding of each of registrant's classes of capital or common stock or other ownership interests, if and as stated on cover of related periodic report. Where multiple classes or units exist define each class/interest by adding class of stock items such as Common Class A [Member], Common Class B [Member] or Partnership Interest [Member] onto the Instrument [Domain] of the Entity Listings, Instrument.
| Name: |
dei_EntityCommonStockSharesOutstanding |
| Namespace Prefix: |
dei_ |
| Data Type: |
xbrli:sharesItemType |
| Balance Type: |
na |
| Period Type: |
instant |
|
| X |
- DefinitionIndicate 'Yes' or 'No' whether registrants (1) have filed all reports required to be filed by Section 13 or 15(d) of the Securities Exchange Act of 1934 during the preceding 12 months (or for such shorter period that registrants were required to file such reports), and (2) have been subject to such filing requirements for the past 90 days. This information should be based on the registrant's current or most recent filing containing the related disclosure.
| Name: |
dei_EntityCurrentReportingStatus |
| Namespace Prefix: |
dei_ |
| Data Type: |
dei:yesNoItemType |
| Balance Type: |
na |
| Period Type: |
duration |
|
| X |
- DefinitionIndicate if registrant meets the emerging growth company criteria. Reference 1: http://www.xbrl.org/2003/role/presentationRef
-Publisher SEC
-Name Exchange Act
-Number 240
-Section 12
-Subsection b-2
| Name: |
dei_EntityEmergingGrowthCompany |
| Namespace Prefix: |
dei_ |
| Data Type: |
xbrli:booleanItemType |
| Balance Type: |
na |
| Period Type: |
duration |
|
| X |
- DefinitionCommission file number. The field allows up to 17 characters. The prefix may contain 1-3 digits, the sequence number may contain 1-8 digits, the optional suffix may contain 1-4 characters, and the fields are separated with a hyphen.
| Name: |
dei_EntityFileNumber |
| Namespace Prefix: |
dei_ |
| Data Type: |
dei:fileNumberItemType |
| Balance Type: |
na |
| Period Type: |
duration |
|
| X |
- DefinitionIndicate whether the registrant is one of the following: Large Accelerated Filer, Accelerated Filer, Non-accelerated Filer. Definitions of these categories are stated in Rule 12b-2 of the Exchange Act. This information should be based on the registrant's current or most recent filing containing the related disclosure. Reference 1: http://www.xbrl.org/2003/role/presentationRef
-Publisher SEC
-Name Exchange Act
-Number 240
-Section 12
-Subsection b-2
| Name: |
dei_EntityFilerCategory |
| Namespace Prefix: |
dei_ |
| Data Type: |
dei:filerCategoryItemType |
| Balance Type: |
na |
| Period Type: |
duration |
|
| X |
- DefinitionTwo-character EDGAR code representing the state or country of incorporation.
| Name: |
dei_EntityIncorporationStateCountryCode |
| Namespace Prefix: |
dei_ |
| Data Type: |
dei:edgarStateCountryItemType |
| Balance Type: |
na |
| Period Type: |
duration |
|
| X |
- DefinitionBoolean flag that is true when the registrant has submitted electronically every Interactive Data File required to be submitted pursuant to Rule 405 of Regulation S-T during the preceding 12 months (or for such shorter period that the registrant was required to submit such files). Reference 1: http://www.xbrl.org/2003/role/presentationRef
-Publisher SEC
-Name Regulation S-T
-Number 232
-Section 405
| Name: |
dei_EntityInteractiveDataCurrent |
| Namespace Prefix: |
dei_ |
| Data Type: |
dei:yesNoItemType |
| Balance Type: |
na |
| Period Type: |
duration |
|
| X |
- DefinitionThe exact name of the entity filing the report as specified in its charter, which is required by forms filed with the SEC. Reference 1: http://www.xbrl.org/2003/role/presentationRef
-Publisher SEC
-Name Exchange Act
-Number 240
-Section 12
-Subsection b-2
| Name: |
dei_EntityRegistrantName |
| Namespace Prefix: |
dei_ |
| Data Type: |
xbrli:normalizedStringItemType |
| Balance Type: |
na |
| Period Type: |
duration |
|
| X |
- DefinitionBoolean flag that is true when the registrant is a shell company as defined in Rule 12b-2 of the Exchange Act. Reference 1: http://www.xbrl.org/2003/role/presentationRef
-Publisher SEC
-Name Exchange Act
-Number 240
-Section 12
-Subsection b-2
| Name: |
dei_EntityShellCompany |
| Namespace Prefix: |
dei_ |
| Data Type: |
xbrli:booleanItemType |
| Balance Type: |
na |
| Period Type: |
duration |
|
| X |
- DefinitionIndicates that the company is a Smaller Reporting Company (SRC). Reference 1: http://www.xbrl.org/2003/role/presentationRef
-Publisher SEC
-Name Exchange Act
-Number 240
-Section 12
-Subsection b-2
| Name: |
dei_EntitySmallBusiness |
| Namespace Prefix: |
dei_ |
| Data Type: |
xbrli:booleanItemType |
| Balance Type: |
na |
| Period Type: |
duration |
|
| X |
- DefinitionThe Tax Identification Number (TIN), also known as an Employer Identification Number (EIN), is a unique 9-digit value assigned by the IRS. Reference 1: http://www.xbrl.org/2003/role/presentationRef
-Publisher SEC
-Name Exchange Act
-Number 240
-Section 12
-Subsection b-2
| Name: |
dei_EntityTaxIdentificationNumber |
| Namespace Prefix: |
dei_ |
| Data Type: |
dei:employerIdItemType |
| Balance Type: |
na |
| Period Type: |
duration |
|
| X |
- DefinitionLocal phone number for entity.
| Name: |
dei_LocalPhoneNumber |
| Namespace Prefix: |
dei_ |
| Data Type: |
xbrli:normalizedStringItemType |
| Balance Type: |
na |
| Period Type: |
duration |
|
v3.23.3
Condensed Consolidated Balance Sheets - USD ($)
|
Sep. 30, 2023 |
Dec. 31, 2022 |
| Current assets |
|
|
| Cash and cash equivalents |
$ 1,173,790
|
$ 874,690
|
| Trade receivables, net |
530,241
|
|
| Prepayment, deposits and other receivables |
139,816
|
3,000
|
| Tax assets |
243,227
|
|
| Total current assets |
2,087,074
|
877,690
|
| Non-current Assets |
|
|
| Right-of-use assets, net |
79,907
|
|
| Property, plant and equipment, net |
519,963
|
|
| Deferred income tax assets |
819
|
|
| Investment in associates |
7,968
|
|
| Total non-current assets |
608,657
|
|
| TOTAL ASSETS |
2,695,731
|
877,690
|
| Current liabilities |
|
|
| Other payables and accrued liabilities |
549,907
|
17,805
|
| Trade payable |
22,556
|
3,357
|
| Income tax payable |
3,357
|
|
| Hire purchase – current portion |
7,406
|
|
| Lease liability – current portion |
74,204
|
|
| Total current liabilities |
879,446
|
21,162
|
| Non-current liabilities |
|
|
| Lease liability – non-current portion |
5,703
|
|
| Deferred tax liabilities |
12,824
|
|
| Total non-current liabilities |
18,527
|
|
| TOTAL LIABILITIES |
897,973
|
21,162
|
| STOCKHOLDERS’ EQUITY |
|
|
| Preferred shares, $0.0001 par value; 200,000,000 shares authorized; None issued and outstanding |
|
|
| Common stock, $0.0001 par value; 600,000,000 shares authorized; 81,551,838 and 73,319,800 shares issued and outstanding as of September 30, 2023 and December 31, 2022 |
8,155
|
7,332
|
| Additional paid-in capital |
10,467,687
|
1,413,268
|
| Accumulated other comprehensive loss |
(344,346)
|
|
| Accumulated deficit |
(8,333,541)
|
(564,072)
|
| Noncontrolling interest |
(197)
|
|
| TOTAL STOCKHOLDERS’ EQUITY |
1,797,758
|
856,528
|
| TOTAL LIABILITIES AND STOCKHOLDERS’ EQUITY |
2,695,731
|
877,690
|
| Director [Member] |
|
|
| Current liabilities |
|
|
| Amount due to related parties |
221,038
|
|
| Related Party [Member] |
|
|
| Current liabilities |
|
|
| Amount due to related parties |
$ 978
|
|
| X |
- DefinitionAmount of liabilities incurred to vendors for goods and services received, and accrued liabilities classified as other, payable within one year or the normal operating cycle, if longer.
| Name: |
us-gaap_AccountsPayableAndOtherAccruedLiabilitiesCurrent |
| Namespace Prefix: |
us-gaap_ |
| Data Type: |
xbrli:monetaryItemType |
| Balance Type: |
credit |
| Period Type: |
instant |
|
| X |
- DefinitionCarrying value as of the balance sheet date of obligations incurred (and for which invoices have typically been received) and payable to vendors for goods and services received that are used in an entity's business. Used to reflect the current portion of the liabilities (due within one year or within the normal operating cycle if longer). Reference 1: http://fasb.org/us-gaap/role/ref/legacyRef
-Name Accounting Standards Codification
-Topic 210
-SubTopic 10
-Section S99
-Paragraph 1
-Subparagraph (SX 210.5-02.19(a))
-Publisher FASB
-URI https://asc.fasb.org//1943274/2147480566/210-10-S99-1
Reference 2: http://fasb.org/us-gaap/role/ref/legacyRef
-Name Accounting Standards Codification
-Topic 210
-SubTopic 10
-Section 45
-Paragraph 8
-Publisher FASB
-URI https://asc.fasb.org//1943274/2147483467/210-10-45-8
| Name: |
us-gaap_AccountsPayableTradeCurrent |
| Namespace Prefix: |
us-gaap_ |
| Data Type: |
xbrli:monetaryItemType |
| Balance Type: |
credit |
| Period Type: |
instant |
|
| X |
- DefinitionAmount, after allowance for credit loss, of right to consideration from customer for product sold and service rendered in normal course of business, classified as current. Reference 1: http://www.xbrl.org/2003/role/disclosureRef
-Topic 310
-SubTopic 10
-Name Accounting Standards Codification
-Section 45
-Paragraph 2
-Publisher FASB
-URI https://asc.fasb.org//1943274/2147481990/310-10-45-2
Reference 2: http://www.xbrl.org/2003/role/disclosureRef
-Topic 310
-SubTopic 10
-Name Accounting Standards Codification
-Section 45
-Paragraph 9
-Publisher FASB
-URI https://asc.fasb.org//1943274/2147481990/310-10-45-9
| Name: |
us-gaap_AccountsReceivableNetCurrent |
| Namespace Prefix: |
us-gaap_ |
| Data Type: |
xbrli:monetaryItemType |
| Balance Type: |
debit |
| Period Type: |
instant |
|
| X |
- DefinitionAmount, after tax, of accumulated increase (decrease) in equity from transaction and other event and circumstance from nonowner source. Reference 1: http://fasb.org/us-gaap/role/ref/legacyRef
-Name Accounting Standards Codification
-Topic 220
-SubTopic 10
-Section 45
-Paragraph 14A
-Publisher FASB
-URI https://asc.fasb.org//1943274/2147482790/220-10-45-14A
Reference 2: http://fasb.org/us-gaap/role/ref/legacyRef
-Topic 220
-SubTopic 10
-Name Accounting Standards Codification
-Section 45
-Paragraph 11
-Publisher FASB
-URI https://asc.fasb.org//1943274/2147482790/220-10-45-11
Reference 3: http://www.xbrl.org/2003/role/disclosureRef
-Topic 944
-SubTopic 40
-Name Accounting Standards Codification
-Section 65
-Paragraph 2
-Subparagraph (g)(2)(ii)
-Publisher FASB
-URI https://asc.fasb.org//1943274/2147480016/944-40-65-2
Reference 4: http://www.xbrl.org/2003/role/disclosureRef
-Topic 944
-SubTopic 40
-Name Accounting Standards Codification
-Section 65
-Paragraph 2
-Subparagraph (h)(2)
-Publisher FASB
-URI https://asc.fasb.org//1943274/2147480016/944-40-65-2
Reference 5: http://www.xbrl.org/2003/role/disclosureRef
-Topic 210
-SubTopic 10
-Name Accounting Standards Codification
-Section S99
-Paragraph 1
-Subparagraph (SX 210.5-02(30)(a)(4))
-Publisher FASB
-URI https://asc.fasb.org//1943274/2147480566/210-10-S99-1
Reference 6: http://www.xbrl.org/2003/role/disclosureRef
-Topic 944
-SubTopic 210
-Name Accounting Standards Codification
-Section S99
-Paragraph 1
-Subparagraph (SX 210.7-03(a)(23)(a)(3))
-Publisher FASB
-URI https://asc.fasb.org//1943274/2147479440/944-210-S99-1
Reference 7: http://fasb.org/us-gaap/role/ref/legacyRef
-Name Accounting Standards Codification
-Topic 220
-SubTopic 10
-Section 45
-Paragraph 14
-Publisher FASB
-URI https://asc.fasb.org//1943274/2147482790/220-10-45-14
| Name: |
us-gaap_AccumulatedOtherComprehensiveIncomeLossNetOfTax |
| Namespace Prefix: |
us-gaap_ |
| Data Type: |
xbrli:monetaryItemType |
| Balance Type: |
credit |
| Period Type: |
instant |
|
| X |
- DefinitionAmount of excess of issue price over par or stated value of stock and from other transaction involving stock or stockholder. Includes, but is not limited to, additional paid-in capital (APIC) for common and preferred stock. Reference 1: http://www.xbrl.org/2003/role/exampleRef
-Topic 852
-SubTopic 10
-Name Accounting Standards Codification
-Section 55
-Paragraph 10
-Publisher FASB
-URI https://asc.fasb.org//1943274/2147481372/852-10-55-10
Reference 2: http://www.xbrl.org/2009/role/commonPracticeRef
-Topic 946
-SubTopic 210
-Name Accounting Standards Codification
-Section S99
-Paragraph 1
-Subparagraph (SX 210.6-04(18))
-Publisher FASB
-URI https://asc.fasb.org//1943274/2147479617/946-210-S99-1
Reference 3: http://fasb.org/us-gaap/role/ref/legacyRef
-Topic 210
-SubTopic 10
-Name Accounting Standards Codification
-Section S99
-Paragraph 1
-Subparagraph (SX 210.5-02(30)(a)(1))
-Publisher FASB
-URI https://asc.fasb.org//1943274/2147480566/210-10-S99-1
| Name: |
us-gaap_AdditionalPaidInCapital |
| Namespace Prefix: |
us-gaap_ |
| Data Type: |
xbrli:monetaryItemType |
| Balance Type: |
credit |
| Period Type: |
instant |
|
| X |
- DefinitionSum of the carrying amounts as of the balance sheet date of all assets that are recognized. Assets are probable future economic benefits obtained or controlled by an entity as a result of past transactions or events. Reference 1: http://www.xbrl.org/2003/role/disclosureRef
-Topic 810
-SubTopic 10
-Name Accounting Standards Codification
-Section 50
-Paragraph 3
-Subparagraph (bb)
-Publisher FASB
-URI https://asc.fasb.org//1943274/2147481203/810-10-50-3
Reference 2: http://www.xbrl.org/2003/role/disclosureRef
-Topic 810
-SubTopic 10
-Name Accounting Standards Codification
-Section 45
-Paragraph 25
-Subparagraph (a)
-Publisher FASB
-URI https://asc.fasb.org//1943274/2147481231/810-10-45-25
Reference 3: http://www.xbrl.org/2003/role/disclosureRef
-Topic 235
-SubTopic 10
-Name Accounting Standards Codification
-Section S99
-Paragraph 1
-Subparagraph (SX 210.4-08(g)(1)(ii))
-Publisher FASB
-URI https://asc.fasb.org//1943274/2147480678/235-10-S99-1
Reference 4: http://www.xbrl.org/2003/role/disclosureRef
-Topic 323
-SubTopic 10
-Name Accounting Standards Codification
-Section 50
-Paragraph 3
-Subparagraph (c)
-Publisher FASB
-URI https://asc.fasb.org//1943274/2147481687/323-10-50-3
Reference 5: http://www.xbrl.org/2003/role/disclosureRef
-Topic 825
-SubTopic 10
-Name Accounting Standards Codification
-Section 50
-Paragraph 28
-Subparagraph (f)
-Publisher FASB
-URI https://asc.fasb.org//1943274/2147482907/825-10-50-28
Reference 6: http://www.xbrl.org/2003/role/exampleRef
-Topic 852
-SubTopic 10
-Name Accounting Standards Codification
-Section 55
-Paragraph 10
-Publisher FASB
-URI https://asc.fasb.org//1943274/2147481372/852-10-55-10
Reference 7: http://www.xbrl.org/2003/role/exampleRef
-Topic 946
-SubTopic 830
-Name Accounting Standards Codification
-Section 55
-Paragraph 12
-Publisher FASB
-URI https://asc.fasb.org//1943274/2147480167/946-830-55-12
Reference 8: http://www.xbrl.org/2003/role/disclosureRef
-Topic 944
-SubTopic 210
-Name Accounting Standards Codification
-Section S99
-Paragraph 1
-Subparagraph (SX 210.7-03(a)(12))
-Publisher FASB
-URI https://asc.fasb.org//1943274/2147479440/944-210-S99-1
Reference 9: http://www.xbrl.org/2003/role/disclosureRef
-Topic 280
-SubTopic 10
-Name Accounting Standards Codification
-Section 50
-Paragraph 22
-Publisher FASB
-URI https://asc.fasb.org//1943274/2147482810/280-10-50-22
Reference 10: http://www.xbrl.org/2003/role/disclosureRef
-Topic 946
-SubTopic 210
-Name Accounting Standards Codification
-Section S99
-Paragraph 1
-Subparagraph (SX 210.6-04(8))
-Publisher FASB
-URI https://asc.fasb.org//1943274/2147479617/946-210-S99-1
Reference 11: http://www.xbrl.org/2003/role/disclosureRef
-Topic 210
-SubTopic 10
-Name Accounting Standards Codification
-Section S99
-Paragraph 1
-Subparagraph (SX 210.5-02(18))
-Publisher FASB
-URI https://asc.fasb.org//1943274/2147480566/210-10-S99-1
Reference 12: http://www.xbrl.org/2003/role/disclosureRef
-Topic 470
-SubTopic 10
-Name Accounting Standards Codification
-Section S99
-Paragraph 1A
-Subparagraph (SX 210.13-01(a)(4)(i))
-Publisher FASB
-URI https://asc.fasb.org//1943274/2147480097/470-10-S99-1A
Reference 13: http://www.xbrl.org/2009/role/commonPracticeRef
-Topic 470
-SubTopic 10
-Name Accounting Standards Codification
-Section S99
-Paragraph 1A
-Subparagraph (SX 210.13-01(a)(4)(ii))
-Publisher FASB
-URI https://asc.fasb.org//1943274/2147480097/470-10-S99-1A
Reference 14: http://www.xbrl.org/2009/role/commonPracticeRef
-Topic 470
-SubTopic 10
-Name Accounting Standards Codification
-Section S99
-Paragraph 1A
-Subparagraph (SX 210.13-01(a)(4)(iii))
-Publisher FASB
-URI https://asc.fasb.org//1943274/2147480097/470-10-S99-1A
Reference 15: http://www.xbrl.org/2003/role/disclosureRef
-Topic 470
-SubTopic 10
-Name Accounting Standards Codification
-Section S99
-Paragraph 1A
-Subparagraph (SX 210.13-01(a)(4)(iii)(A))
-Publisher FASB
-URI https://asc.fasb.org//1943274/2147480097/470-10-S99-1A
Reference 16: http://www.xbrl.org/2003/role/disclosureRef
-Topic 470
-SubTopic 10
-Name Accounting Standards Codification
-Section S99
-Paragraph 1A
-Subparagraph (SX 210.13-01(a)(4)(iv))
-Publisher FASB
-URI https://asc.fasb.org//1943274/2147480097/470-10-S99-1A
Reference 17: http://www.xbrl.org/2003/role/disclosureRef
-Topic 470
-SubTopic 10
-Name Accounting Standards Codification
-Section S99
-Paragraph 1A
-Subparagraph (SX 210.13-01(a)(5))
-Publisher FASB
-URI https://asc.fasb.org//1943274/2147480097/470-10-S99-1A
Reference 18: http://www.xbrl.org/2003/role/disclosureRef
-Topic 470
-SubTopic 10
-Name Accounting Standards Codification
-Section S99
-Paragraph 1B
-Subparagraph (SX 210.13-02(a)(4)(i))
-Publisher FASB
-URI https://asc.fasb.org//1943274/2147480097/470-10-S99-1B
Reference 19: http://www.xbrl.org/2003/role/disclosureRef
-Topic 470
-SubTopic 10
-Name Accounting Standards Codification
-Section S99
-Paragraph 1B
-Subparagraph (SX 210.13-02(a)(4)(iii)(A))
-Publisher FASB
-URI https://asc.fasb.org//1943274/2147480097/470-10-S99-1B
Reference 20: http://www.xbrl.org/2003/role/disclosureRef
-Topic 470
-SubTopic 10
-Name Accounting Standards Codification
-Section S99
-Paragraph 1B
-Subparagraph (SX 210.13-02(a)(4)(iii)(B))
-Publisher FASB
-URI https://asc.fasb.org//1943274/2147480097/470-10-S99-1B
Reference 21: http://www.xbrl.org/2003/role/disclosureRef
-Topic 470
-SubTopic 10
-Name Accounting Standards Codification
-Section S99
-Paragraph 1B
-Subparagraph (SX 210.13-02(a)(4)(iv))
-Publisher FASB
-URI https://asc.fasb.org//1943274/2147480097/470-10-S99-1B
Reference 22: http://www.xbrl.org/2003/role/disclosureRef
-Topic 470
-SubTopic 10
-Name Accounting Standards Codification
-Section S99
-Paragraph 1B
-Subparagraph (SX 210.13-02(a)(5))
-Publisher FASB
-URI https://asc.fasb.org//1943274/2147480097/470-10-S99-1B
Reference 23: http://www.xbrl.org/2009/role/commonPracticeRef
-Topic 852
-SubTopic 10
-Name Accounting Standards Codification
-Section 50
-Paragraph 7
-Subparagraph (a)
-Publisher FASB
-URI https://asc.fasb.org//1943274/2147481404/852-10-50-7
Reference 24: http://www.xbrl.org/2003/role/disclosureRef
-Topic 280
-SubTopic 10
-Name Accounting Standards Codification
-Section 50
-Paragraph 30
-Subparagraph (c)
-Publisher FASB
-URI https://asc.fasb.org//1943274/2147482810/280-10-50-30
Reference 25: http://www.xbrl.org/2003/role/disclosureRef
-Topic 280
-SubTopic 10
-Name Accounting Standards Codification
-Section 50
-Paragraph 32
-Subparagraph (d)
-Publisher FASB
-URI https://asc.fasb.org//1943274/2147482810/280-10-50-32
Reference 26: http://fasb.org/us-gaap/role/ref/legacyRef
-Topic 942
-SubTopic 210
-Name Accounting Standards Codification
-Section S99
-Paragraph 1
-Subparagraph (SX 210.9-03(11))
-Publisher FASB
-URI https://asc.fasb.org//1943274/2147479853/942-210-S99-1
| Name: |
us-gaap_Assets |
| Namespace Prefix: |
us-gaap_ |
| Data Type: |
xbrli:monetaryItemType |
| Balance Type: |
debit |
| Period Type: |
instant |
|
| X |
- DefinitionSum of the carrying amounts as of the balance sheet date of all assets that are expected to be realized in cash, sold, or consumed within one year (or the normal operating cycle, if longer). Assets are probable future economic benefits obtained or controlled by an entity as a result of past transactions or events. Reference 1: http://www.xbrl.org/2003/role/disclosureRef
-Topic 810
-SubTopic 10
-Name Accounting Standards Codification
-Section 50
-Paragraph 3
-Subparagraph (bb)
-Publisher FASB
-URI https://asc.fasb.org//1943274/2147481203/810-10-50-3
Reference 2: http://www.xbrl.org/2003/role/disclosureRef
-Topic 810
-SubTopic 10
-Name Accounting Standards Codification
-Section 45
-Paragraph 25
-Subparagraph (a)
-Publisher FASB
-URI https://asc.fasb.org//1943274/2147481231/810-10-45-25
Reference 3: http://www.xbrl.org/2003/role/disclosureRef
-Topic 235
-SubTopic 10
-Name Accounting Standards Codification
-Section S99
-Paragraph 1
-Subparagraph (SX 210.4-08(g)(1)(ii))
-Publisher FASB
-URI https://asc.fasb.org//1943274/2147480678/235-10-S99-1
Reference 4: http://www.xbrl.org/2003/role/disclosureRef
-Topic 323
-SubTopic 10
-Name Accounting Standards Codification
-Section 50
-Paragraph 3
-Subparagraph (c)
-Publisher FASB
-URI https://asc.fasb.org//1943274/2147481687/323-10-50-3
Reference 5: http://www.xbrl.org/2003/role/disclosureRef
-Topic 825
-SubTopic 10
-Name Accounting Standards Codification
-Section 50
-Paragraph 28
-Subparagraph (f)
-Publisher FASB
-URI https://asc.fasb.org//1943274/2147482907/825-10-50-28
Reference 6: http://www.xbrl.org/2003/role/exampleRef
-Topic 852
-SubTopic 10
-Name Accounting Standards Codification
-Section 55
-Paragraph 10
-Publisher FASB
-URI https://asc.fasb.org//1943274/2147481372/852-10-55-10
Reference 7: http://www.xbrl.org/2003/role/disclosureRef
-Topic 210
-SubTopic 10
-Name Accounting Standards Codification
-Section 45
-Paragraph 1
-Publisher FASB
-URI https://asc.fasb.org//1943274/2147483467/210-10-45-1
Reference 8: http://www.xbrl.org/2003/role/disclosureRef
-Topic 210
-SubTopic 10
-Name Accounting Standards Codification
-Section S99
-Paragraph 1
-Subparagraph (SX 210.5-02(9))
-Publisher FASB
-URI https://asc.fasb.org//1943274/2147480566/210-10-S99-1
Reference 9: http://www.xbrl.org/2003/role/disclosureRef
-Topic 470
-SubTopic 10
-Name Accounting Standards Codification
-Section S99
-Paragraph 1A
-Subparagraph (SX 210.13-01(a)(4)(i))
-Publisher FASB
-URI https://asc.fasb.org//1943274/2147480097/470-10-S99-1A
Reference 10: http://www.xbrl.org/2009/role/commonPracticeRef
-Topic 470
-SubTopic 10
-Name Accounting Standards Codification
-Section S99
-Paragraph 1A
-Subparagraph (SX 210.13-01(a)(4)(ii))
-Publisher FASB
-URI https://asc.fasb.org//1943274/2147480097/470-10-S99-1A
Reference 11: http://www.xbrl.org/2009/role/commonPracticeRef
-Topic 470
-SubTopic 10
-Name Accounting Standards Codification
-Section S99
-Paragraph 1A
-Subparagraph (SX 210.13-01(a)(4)(iii))
-Publisher FASB
-URI https://asc.fasb.org//1943274/2147480097/470-10-S99-1A
Reference 12: http://www.xbrl.org/2003/role/disclosureRef
-Topic 470
-SubTopic 10
-Name Accounting Standards Codification
-Section S99
-Paragraph 1A
-Subparagraph (SX 210.13-01(a)(4)(iii)(A))
-Publisher FASB
-URI https://asc.fasb.org//1943274/2147480097/470-10-S99-1A
Reference 13: http://www.xbrl.org/2003/role/disclosureRef
-Topic 470
-SubTopic 10
-Name Accounting Standards Codification
-Section S99
-Paragraph 1A
-Subparagraph (SX 210.13-01(a)(4)(iv))
-Publisher FASB
-URI https://asc.fasb.org//1943274/2147480097/470-10-S99-1A
Reference 14: http://www.xbrl.org/2003/role/disclosureRef
-Topic 470
-SubTopic 10
-Name Accounting Standards Codification
-Section S99
-Paragraph 1A
-Subparagraph (SX 210.13-01(a)(5))
-Publisher FASB
-URI https://asc.fasb.org//1943274/2147480097/470-10-S99-1A
Reference 15: http://www.xbrl.org/2003/role/disclosureRef
-Topic 470
-SubTopic 10
-Name Accounting Standards Codification
-Section S99
-Paragraph 1B
-Subparagraph (SX 210.13-02(a)(4)(i))
-Publisher FASB
-URI https://asc.fasb.org//1943274/2147480097/470-10-S99-1B
Reference 16: http://www.xbrl.org/2003/role/disclosureRef
-Topic 470
-SubTopic 10
-Name Accounting Standards Codification
-Section S99
-Paragraph 1B
-Subparagraph (SX 210.13-02(a)(4)(iii)(A))
-Publisher FASB
-URI https://asc.fasb.org//1943274/2147480097/470-10-S99-1B
Reference 17: http://www.xbrl.org/2003/role/disclosureRef
-Topic 470
-SubTopic 10
-Name Accounting Standards Codification
-Section S99
-Paragraph 1B
-Subparagraph (SX 210.13-02(a)(4)(iii)(B))
-Publisher FASB
-URI https://asc.fasb.org//1943274/2147480097/470-10-S99-1B
Reference 18: http://www.xbrl.org/2003/role/disclosureRef
-Topic 470
-SubTopic 10
-Name Accounting Standards Codification
-Section S99
-Paragraph 1B
-Subparagraph (SX 210.13-02(a)(4)(iv))
-Publisher FASB
-URI https://asc.fasb.org//1943274/2147480097/470-10-S99-1B
Reference 19: http://www.xbrl.org/2003/role/disclosureRef
-Topic 470
-SubTopic 10
-Name Accounting Standards Codification
-Section S99
-Paragraph 1B
-Subparagraph (SX 210.13-02(a)(5))
-Publisher FASB
-URI https://asc.fasb.org//1943274/2147480097/470-10-S99-1B
Reference 20: http://www.xbrl.org/2009/role/commonPracticeRef
-Topic 852
-SubTopic 10
-Name Accounting Standards Codification
-Section 50
-Paragraph 7
-Subparagraph (a)
-Publisher FASB
-URI https://asc.fasb.org//1943274/2147481404/852-10-50-7
| Name: |
us-gaap_AssetsCurrent |
| Namespace Prefix: |
us-gaap_ |
| Data Type: |
xbrli:monetaryItemType |
| Balance Type: |
debit |
| Period Type: |
instant |
|
| X |
- References
+ Details
| Name: |
us-gaap_AssetsCurrentAbstract |
| Namespace Prefix: |
us-gaap_ |
| Data Type: |
xbrli:stringItemType |
| Balance Type: |
na |
| Period Type: |
duration |
|
| X |
- DefinitionSum of the carrying amounts as of the balance sheet date of all assets that are expected to be realized in cash, sold or consumed after one year or beyond the normal operating cycle, if longer. Reference 1: http://www.xbrl.org/2003/role/disclosureRef
-Topic 810
-SubTopic 10
-Name Accounting Standards Codification
-Section 50
-Paragraph 3
-Subparagraph (bb)
-Publisher FASB
-URI https://asc.fasb.org//1943274/2147481203/810-10-50-3
Reference 2: http://www.xbrl.org/2003/role/disclosureRef
-Topic 810
-SubTopic 10
-Name Accounting Standards Codification
-Section 45
-Paragraph 25
-Subparagraph (a)
-Publisher FASB
-URI https://asc.fasb.org//1943274/2147481231/810-10-45-25
Reference 3: http://www.xbrl.org/2003/role/disclosureRef
-Topic 235
-SubTopic 10
-Name Accounting Standards Codification
-Section S99
-Paragraph 1
-Subparagraph (SX 210.4-08(g)(1)(ii))
-Publisher FASB
-URI https://asc.fasb.org//1943274/2147480678/235-10-S99-1
Reference 4: http://www.xbrl.org/2003/role/disclosureRef
-Topic 323
-SubTopic 10
-Name Accounting Standards Codification
-Section 50
-Paragraph 3
-Subparagraph (c)
-Publisher FASB
-URI https://asc.fasb.org//1943274/2147481687/323-10-50-3
Reference 5: http://www.xbrl.org/2003/role/disclosureRef
-Topic 825
-SubTopic 10
-Name Accounting Standards Codification
-Section 50
-Paragraph 28
-Subparagraph (f)
-Publisher FASB
-URI https://asc.fasb.org//1943274/2147482907/825-10-50-28
Reference 6: http://www.xbrl.org/2003/role/disclosureRef
-Topic 470
-SubTopic 10
-Name Accounting Standards Codification
-Section S99
-Paragraph 1A
-Subparagraph (SX 210.13-01(a)(4)(i))
-Publisher FASB
-URI https://asc.fasb.org//1943274/2147480097/470-10-S99-1A
Reference 7: http://www.xbrl.org/2009/role/commonPracticeRef
-Topic 470
-SubTopic 10
-Name Accounting Standards Codification
-Section S99
-Paragraph 1A
-Subparagraph (SX 210.13-01(a)(4)(ii))
-Publisher FASB
-URI https://asc.fasb.org//1943274/2147480097/470-10-S99-1A
Reference 8: http://www.xbrl.org/2009/role/commonPracticeRef
-Topic 470
-SubTopic 10
-Name Accounting Standards Codification
-Section S99
-Paragraph 1A
-Subparagraph (SX 210.13-01(a)(4)(iii))
-Publisher FASB
-URI https://asc.fasb.org//1943274/2147480097/470-10-S99-1A
Reference 9: http://www.xbrl.org/2003/role/disclosureRef
-Topic 470
-SubTopic 10
-Name Accounting Standards Codification
-Section S99
-Paragraph 1A
-Subparagraph (SX 210.13-01(a)(4)(iii)(A))
-Publisher FASB
-URI https://asc.fasb.org//1943274/2147480097/470-10-S99-1A
Reference 10: http://www.xbrl.org/2003/role/disclosureRef
-Topic 470
-SubTopic 10
-Name Accounting Standards Codification
-Section S99
-Paragraph 1A
-Subparagraph (SX 210.13-01(a)(4)(iv))
-Publisher FASB
-URI https://asc.fasb.org//1943274/2147480097/470-10-S99-1A
Reference 11: http://www.xbrl.org/2003/role/disclosureRef
-Topic 470
-SubTopic 10
-Name Accounting Standards Codification
-Section S99
-Paragraph 1A
-Subparagraph (SX 210.13-01(a)(5))
-Publisher FASB
-URI https://asc.fasb.org//1943274/2147480097/470-10-S99-1A
Reference 12: http://www.xbrl.org/2003/role/disclosureRef
-Topic 470
-SubTopic 10
-Name Accounting Standards Codification
-Section S99
-Paragraph 1B
-Subparagraph (SX 210.13-02(a)(4)(i))
-Publisher FASB
-URI https://asc.fasb.org//1943274/2147480097/470-10-S99-1B
Reference 13: http://www.xbrl.org/2003/role/disclosureRef
-Topic 470
-SubTopic 10
-Name Accounting Standards Codification
-Section S99
-Paragraph 1B
-Subparagraph (SX 210.13-02(a)(4)(iii)(A))
-Publisher FASB
-URI https://asc.fasb.org//1943274/2147480097/470-10-S99-1B
Reference 14: http://www.xbrl.org/2003/role/disclosureRef
-Topic 470
-SubTopic 10
-Name Accounting Standards Codification
-Section S99
-Paragraph 1B
-Subparagraph (SX 210.13-02(a)(4)(iii)(B))
-Publisher FASB
-URI https://asc.fasb.org//1943274/2147480097/470-10-S99-1B
Reference 15: http://www.xbrl.org/2003/role/disclosureRef
-Topic 470
-SubTopic 10
-Name Accounting Standards Codification
-Section S99
-Paragraph 1B
-Subparagraph (SX 210.13-02(a)(4)(iv))
-Publisher FASB
-URI https://asc.fasb.org//1943274/2147480097/470-10-S99-1B
Reference 16: http://www.xbrl.org/2003/role/disclosureRef
-Topic 470
-SubTopic 10
-Name Accounting Standards Codification
-Section S99
-Paragraph 1B
-Subparagraph (SX 210.13-02(a)(5))
-Publisher FASB
-URI https://asc.fasb.org//1943274/2147480097/470-10-S99-1B
Reference 17: http://www.xbrl.org/2009/role/commonPracticeRef
-Topic 852
-SubTopic 10
-Name Accounting Standards Codification
-Section 50
-Paragraph 7
-Subparagraph (a)
-Publisher FASB
-URI https://asc.fasb.org//1943274/2147481404/852-10-50-7
| Name: |
us-gaap_AssetsNoncurrent |
| Namespace Prefix: |
us-gaap_ |
| Data Type: |
xbrli:monetaryItemType |
| Balance Type: |
debit |
| Period Type: |
instant |
|
| X |
- References
+ Details
| Name: |
us-gaap_AssetsNoncurrentAbstract |
| Namespace Prefix: |
us-gaap_ |
| Data Type: |
xbrli:stringItemType |
| Balance Type: |
na |
| Period Type: |
duration |
|
| X |
- DefinitionAmount of currency on hand as well as demand deposits with banks or financial institutions. Includes other kinds of accounts that have the general characteristics of demand deposits. Also includes short-term, highly liquid investments that are both readily convertible to known amounts of cash and so near their maturity that they present insignificant risk of changes in value because of changes in interest rates. Excludes cash and cash equivalents within disposal group and discontinued operation. Reference 1: http://www.xbrl.org/2003/role/disclosureRef
-Topic 210
-SubTopic 10
-Name Accounting Standards Codification
-Section S99
-Paragraph 1
-Subparagraph (SX 210.5-02(1))
-Publisher FASB
-URI https://asc.fasb.org//1943274/2147480566/210-10-S99-1
Reference 2: http://www.xbrl.org/2003/role/exampleRef
-Topic 210
-SubTopic 10
-Name Accounting Standards Codification
-Section 45
-Paragraph 1
-Subparagraph (a)
-Publisher FASB
-URI https://asc.fasb.org//1943274/2147483467/210-10-45-1
Reference 3: http://fasb.org/us-gaap/role/ref/legacyRef
-Name Accounting Standards Codification
-Topic 230
-SubTopic 10
-Section 45
-Paragraph 4
-Publisher FASB
-URI https://asc.fasb.org//1943274/2147482740/230-10-45-4
| Name: |
us-gaap_CashAndCashEquivalentsAtCarryingValue |
| Namespace Prefix: |
us-gaap_ |
| Data Type: |
xbrli:monetaryItemType |
| Balance Type: |
debit |
| Period Type: |
instant |
|
| X |
- DefinitionAggregate par or stated value of issued nonredeemable common stock (or common stock redeemable solely at the option of the issuer). This item includes treasury stock repurchased by the entity. Note: elements for number of nonredeemable common shares, par value and other disclosure concepts are in another section within stockholders' equity. Reference 1: http://www.xbrl.org/2003/role/exampleRef
-Topic 852
-SubTopic 10
-Name Accounting Standards Codification
-Section 55
-Paragraph 10
-Publisher FASB
-URI https://asc.fasb.org//1943274/2147481372/852-10-55-10
Reference 2: http://www.xbrl.org/2003/role/disclosureRef
-Topic 944
-SubTopic 210
-Name Accounting Standards Codification
-Section S99
-Paragraph 1
-Subparagraph (SX 210.7-03(a)(22))
-Publisher FASB
-URI https://asc.fasb.org//1943274/2147479440/944-210-S99-1
Reference 3: http://fasb.org/us-gaap/role/ref/legacyRef
-Topic 210
-SubTopic 10
-Name Accounting Standards Codification
-Section S99
-Paragraph 1
-Subparagraph (SX 210.5-02(29))
-Publisher FASB
-URI https://asc.fasb.org//1943274/2147480566/210-10-S99-1
| Name: |
us-gaap_CommonStockValue |
| Namespace Prefix: |
us-gaap_ |
| Data Type: |
xbrli:monetaryItemType |
| Balance Type: |
credit |
| Period Type: |
instant |
|
| X |
- DefinitionAmount of investment in equity method investee and investment in and advance to affiliate. Reference 1: http://www.xbrl.org/2009/role/commonPracticeRef
-Topic 210
-SubTopic 10
-Name Accounting Standards Codification
-Section S99
-Paragraph 1
-Subparagraph (SX 210.5-02(18))
-Publisher FASB
-URI https://asc.fasb.org//1943274/2147480566/210-10-S99-1
| Name: |
us-gaap_InvestmentsInAffiliatesSubsidiariesAssociatesAndJointVentures |
| Namespace Prefix: |
us-gaap_ |
| Data Type: |
xbrli:monetaryItemType |
| Balance Type: |
debit |
| Period Type: |
instant |
|
| X |
- DefinitionSum of the carrying amounts as of the balance sheet date of all liabilities that are recognized. Liabilities are probable future sacrifices of economic benefits arising from present obligations of an entity to transfer assets or provide services to other entities in the future. Reference 1: http://www.xbrl.org/2003/role/disclosureRef
-Topic 810
-SubTopic 10
-Name Accounting Standards Codification
-Section 50
-Paragraph 3
-Subparagraph (c)
-Publisher FASB
-URI https://asc.fasb.org//1943274/2147481203/810-10-50-3
Reference 2: http://www.xbrl.org/2003/role/disclosureRef
-Topic 810
-SubTopic 10
-Name Accounting Standards Codification
-Section 45
-Paragraph 25
-Subparagraph (b)
-Publisher FASB
-URI https://asc.fasb.org//1943274/2147481231/810-10-45-25
Reference 3: http://www.xbrl.org/2003/role/disclosureRef
-Topic 810
-SubTopic 10
-Name Accounting Standards Codification
-Section 50
-Paragraph 3
-Subparagraph (bb)
-Publisher FASB
-URI https://asc.fasb.org//1943274/2147481203/810-10-50-3
Reference 4: http://www.xbrl.org/2003/role/disclosureRef
-Topic 235
-SubTopic 10
-Name Accounting Standards Codification
-Section S99
-Paragraph 1
-Subparagraph (SX 210.4-08(g)(1)(ii))
-Publisher FASB
-URI https://asc.fasb.org//1943274/2147480678/235-10-S99-1
Reference 5: http://www.xbrl.org/2003/role/disclosureRef
-Topic 323
-SubTopic 10
-Name Accounting Standards Codification
-Section 50
-Paragraph 3
-Subparagraph (c)
-Publisher FASB
-URI https://asc.fasb.org//1943274/2147481687/323-10-50-3
Reference 6: http://www.xbrl.org/2003/role/disclosureRef
-Topic 825
-SubTopic 10
-Name Accounting Standards Codification
-Section 50
-Paragraph 28
-Subparagraph (f)
-Publisher FASB
-URI https://asc.fasb.org//1943274/2147482907/825-10-50-28
Reference 7: http://www.xbrl.org/2003/role/exampleRef
-Topic 946
-SubTopic 830
-Name Accounting Standards Codification
-Section 55
-Paragraph 12
-Publisher FASB
-URI https://asc.fasb.org//1943274/2147480167/946-830-55-12
Reference 8: http://www.xbrl.org/2003/role/disclosureRef
-Topic 946
-SubTopic 210
-Name Accounting Standards Codification
-Section S99
-Paragraph 1
-Subparagraph (SX 210.6-04(14))
-Publisher FASB
-URI https://asc.fasb.org//1943274/2147479617/946-210-S99-1
Reference 9: http://www.xbrl.org/2003/role/disclosureRef
-Topic 470
-SubTopic 10
-Name Accounting Standards Codification
-Section S99
-Paragraph 1A
-Subparagraph (SX 210.13-01(a)(4)(i))
-Publisher FASB
-URI https://asc.fasb.org//1943274/2147480097/470-10-S99-1A
Reference 10: http://www.xbrl.org/2009/role/commonPracticeRef
-Topic 470
-SubTopic 10
-Name Accounting Standards Codification
-Section S99
-Paragraph 1A
-Subparagraph (SX 210.13-01(a)(4)(ii))
-Publisher FASB
-URI https://asc.fasb.org//1943274/2147480097/470-10-S99-1A
Reference 11: http://www.xbrl.org/2003/role/disclosureRef
-Topic 470
-SubTopic 10
-Name Accounting Standards Codification
-Section S99
-Paragraph 1A
-Subparagraph (SX 210.13-01(a)(4)(iii)(A))
-Publisher FASB
-URI https://asc.fasb.org//1943274/2147480097/470-10-S99-1A
Reference 12: http://www.xbrl.org/2003/role/disclosureRef
-Topic 470
-SubTopic 10
-Name Accounting Standards Codification
-Section S99
-Paragraph 1A
-Subparagraph (SX 210.13-01(a)(4)(iv))
-Publisher FASB
-URI https://asc.fasb.org//1943274/2147480097/470-10-S99-1A
Reference 13: http://www.xbrl.org/2003/role/disclosureRef
-Topic 470
-SubTopic 10
-Name Accounting Standards Codification
-Section S99
-Paragraph 1A
-Subparagraph (SX 210.13-01(a)(5))
-Publisher FASB
-URI https://asc.fasb.org//1943274/2147480097/470-10-S99-1A
Reference 14: http://www.xbrl.org/2003/role/disclosureRef
-Topic 470
-SubTopic 10
-Name Accounting Standards Codification
-Section S99
-Paragraph 1B
-Subparagraph (SX 210.13-02(a)(4)(i))
-Publisher FASB
-URI https://asc.fasb.org//1943274/2147480097/470-10-S99-1B
Reference 15: http://www.xbrl.org/2003/role/disclosureRef
-Topic 470
-SubTopic 10
-Name Accounting Standards Codification
-Section S99
-Paragraph 1B
-Subparagraph (SX 210.13-02(a)(4)(iii)(A))
-Publisher FASB
-URI https://asc.fasb.org//1943274/2147480097/470-10-S99-1B
Reference 16: http://www.xbrl.org/2003/role/disclosureRef
-Topic 470
-SubTopic 10
-Name Accounting Standards Codification
-Section S99
-Paragraph 1B
-Subparagraph (SX 210.13-02(a)(4)(iii)(B))
-Publisher FASB
-URI https://asc.fasb.org//1943274/2147480097/470-10-S99-1B
Reference 17: http://www.xbrl.org/2003/role/disclosureRef
-Topic 470
-SubTopic 10
-Name Accounting Standards Codification
-Section S99
-Paragraph 1B
-Subparagraph (SX 210.13-02(a)(4)(iv))
-Publisher FASB
-URI https://asc.fasb.org//1943274/2147480097/470-10-S99-1B
Reference 18: http://www.xbrl.org/2003/role/disclosureRef
-Topic 470
-SubTopic 10
-Name Accounting Standards Codification
-Section S99
-Paragraph 1B
-Subparagraph (SX 210.13-02(a)(5))
-Publisher FASB
-URI https://asc.fasb.org//1943274/2147480097/470-10-S99-1B
Reference 19: http://www.xbrl.org/2009/role/commonPracticeRef
-Topic 852
-SubTopic 10
-Name Accounting Standards Codification
-Section 50
-Paragraph 7
-Subparagraph (a)
-Publisher FASB
-URI https://asc.fasb.org//1943274/2147481404/852-10-50-7
Reference 20: http://www.xbrl.org/2009/role/commonPracticeRef
-Topic 852
-SubTopic 10
-Name Accounting Standards Codification
-Section 50
-Paragraph 7
-Subparagraph (b)
-Publisher FASB
-URI https://asc.fasb.org//1943274/2147481404/852-10-50-7
Reference 21: http://www.xbrl.org/2003/role/exampleRef
-Topic 280
-SubTopic 10
-Name Accounting Standards Codification
-Section 50
-Paragraph 30
-Subparagraph (d)
-Publisher FASB
-URI https://asc.fasb.org//1943274/2147482810/280-10-50-30
Reference 22: http://fasb.org/us-gaap/role/ref/legacyRef
-Name Accounting Standards Codification
-Topic 210
-SubTopic 10
-Section S99
-Paragraph 1
-Subparagraph (SX 210.5-02.19-26)
-Publisher FASB
-URI https://asc.fasb.org//1943274/2147480566/210-10-S99-1
| Name: |
us-gaap_Liabilities |
| Namespace Prefix: |
us-gaap_ |
| Data Type: |
xbrli:monetaryItemType |
| Balance Type: |
credit |
| Period Type: |
instant |
|
| X |
- DefinitionAmount of liabilities and equity items, including the portion of equity attributable to noncontrolling interests, if any. Reference 1: http://www.xbrl.org/2003/role/exampleRef
-Topic 852
-SubTopic 10
-Name Accounting Standards Codification
-Section 55
-Paragraph 10
-Publisher FASB
-URI https://asc.fasb.org//1943274/2147481372/852-10-55-10
Reference 2: http://www.xbrl.org/2003/role/disclosureRef
-Topic 944
-SubTopic 210
-Name Accounting Standards Codification
-Section S99
-Paragraph 1
-Subparagraph (SX 210.7-03(a)(25))
-Publisher FASB
-URI https://asc.fasb.org//1943274/2147479440/944-210-S99-1
Reference 3: http://www.xbrl.org/2009/role/commonPracticeRef
-Topic 235
-SubTopic 10
-Name Accounting Standards Codification
-Section S99
-Paragraph 1
-Subparagraph (SX 210.4-08(g)(1)(ii))
-Publisher FASB
-URI https://asc.fasb.org//1943274/2147480678/235-10-S99-1
Reference 4: http://www.xbrl.org/2009/role/commonPracticeRef
-Topic 323
-SubTopic 10
-Name Accounting Standards Codification
-Section 50
-Paragraph 3
-Subparagraph (c)
-Publisher FASB
-URI https://asc.fasb.org//1943274/2147481687/323-10-50-3
Reference 5: http://www.xbrl.org/2009/role/commonPracticeRef
-Topic 825
-SubTopic 10
-Name Accounting Standards Codification
-Section 50
-Paragraph 28
-Subparagraph (f)
-Publisher FASB
-URI https://asc.fasb.org//1943274/2147482907/825-10-50-28
Reference 6: http://fasb.org/us-gaap/role/ref/legacyRef
-Topic 942
-SubTopic 210
-Name Accounting Standards Codification
-Section S99
-Paragraph 1
-Subparagraph (SX 210.9-03(23))
-Publisher FASB
-URI https://asc.fasb.org//1943274/2147479853/942-210-S99-1
Reference 7: http://fasb.org/us-gaap/role/ref/legacyRef
-Topic 210
-SubTopic 10
-Name Accounting Standards Codification
-Section S99
-Paragraph 1
-Subparagraph (SX 210.5-02(32))
-Publisher FASB
-URI https://asc.fasb.org//1943274/2147480566/210-10-S99-1
| Name: |
us-gaap_LiabilitiesAndStockholdersEquity |
| Namespace Prefix: |
us-gaap_ |
| Data Type: |
xbrli:monetaryItemType |
| Balance Type: |
credit |
| Period Type: |
instant |
|
| X |
- DefinitionTotal obligations incurred as part of normal operations that are expected to be paid during the following twelve months or within one business cycle, if longer. Reference 1: http://www.xbrl.org/2003/role/disclosureRef
-Topic 810
-SubTopic 10
-Name Accounting Standards Codification
-Section 50
-Paragraph 3
-Subparagraph (c)
-Publisher FASB
-URI https://asc.fasb.org//1943274/2147481203/810-10-50-3
Reference 2: http://www.xbrl.org/2003/role/disclosureRef
-Topic 810
-SubTopic 10
-Name Accounting Standards Codification
-Section 45
-Paragraph 25
-Subparagraph (b)
-Publisher FASB
-URI https://asc.fasb.org//1943274/2147481231/810-10-45-25
Reference 3: http://www.xbrl.org/2003/role/disclosureRef
-Topic 810
-SubTopic 10
-Name Accounting Standards Codification
-Section 50
-Paragraph 3
-Subparagraph (bb)
-Publisher FASB
-URI https://asc.fasb.org//1943274/2147481203/810-10-50-3
Reference 4: http://www.xbrl.org/2003/role/disclosureRef
-Topic 235
-SubTopic 10
-Name Accounting Standards Codification
-Section S99
-Paragraph 1
-Subparagraph (SX 210.4-08(g)(1)(ii))
-Publisher FASB
-URI https://asc.fasb.org//1943274/2147480678/235-10-S99-1
Reference 5: http://www.xbrl.org/2003/role/disclosureRef
-Topic 323
-SubTopic 10
-Name Accounting Standards Codification
-Section 50
-Paragraph 3
-Subparagraph (c)
-Publisher FASB
-URI https://asc.fasb.org//1943274/2147481687/323-10-50-3
Reference 6: http://www.xbrl.org/2003/role/disclosureRef
-Topic 825
-SubTopic 10
-Name Accounting Standards Codification
-Section 50
-Paragraph 28
-Subparagraph (f)
-Publisher FASB
-URI https://asc.fasb.org//1943274/2147482907/825-10-50-28
Reference 7: http://www.xbrl.org/2003/role/exampleRef
-Topic 852
-SubTopic 10
-Name Accounting Standards Codification
-Section 55
-Paragraph 10
-Publisher FASB
-URI https://asc.fasb.org//1943274/2147481372/852-10-55-10
Reference 8: http://www.xbrl.org/2003/role/disclosureRef
-Topic 210
-SubTopic 10
-Name Accounting Standards Codification
-Section 45
-Paragraph 5
-Publisher FASB
-URI https://asc.fasb.org//1943274/2147483467/210-10-45-5
Reference 9: http://www.xbrl.org/2003/role/disclosureRef
-Topic 470
-SubTopic 10
-Name Accounting Standards Codification
-Section S99
-Paragraph 1A
-Subparagraph (SX 210.13-01(a)(4)(i))
-Publisher FASB
-URI https://asc.fasb.org//1943274/2147480097/470-10-S99-1A
Reference 10: http://www.xbrl.org/2009/role/commonPracticeRef
-Topic 470
-SubTopic 10
-Name Accounting Standards Codification
-Section S99
-Paragraph 1A
-Subparagraph (SX 210.13-01(a)(4)(ii))
-Publisher FASB
-URI https://asc.fasb.org//1943274/2147480097/470-10-S99-1A
Reference 11: http://www.xbrl.org/2003/role/disclosureRef
-Topic 470
-SubTopic 10
-Name Accounting Standards Codification
-Section S99
-Paragraph 1A
-Subparagraph (SX 210.13-01(a)(4)(iii)(A))
-Publisher FASB
-URI https://asc.fasb.org//1943274/2147480097/470-10-S99-1A
Reference 12: http://www.xbrl.org/2003/role/disclosureRef
-Topic 470
-SubTopic 10
-Name Accounting Standards Codification
-Section S99
-Paragraph 1A
-Subparagraph (SX 210.13-01(a)(4)(iv))
-Publisher FASB
-URI https://asc.fasb.org//1943274/2147480097/470-10-S99-1A
Reference 13: http://www.xbrl.org/2003/role/disclosureRef
-Topic 470
-SubTopic 10
-Name Accounting Standards Codification
-Section S99
-Paragraph 1A
-Subparagraph (SX 210.13-01(a)(5))
-Publisher FASB
-URI https://asc.fasb.org//1943274/2147480097/470-10-S99-1A
Reference 14: http://www.xbrl.org/2003/role/disclosureRef
-Topic 470
-SubTopic 10
-Name Accounting Standards Codification
-Section S99
-Paragraph 1B
-Subparagraph (SX 210.13-02(a)(4)(i))
-Publisher FASB
-URI https://asc.fasb.org//1943274/2147480097/470-10-S99-1B
Reference 15: http://www.xbrl.org/2003/role/disclosureRef
-Topic 470
-SubTopic 10
-Name Accounting Standards Codification
-Section S99
-Paragraph 1B
-Subparagraph (SX 210.13-02(a)(4)(iii)(A))
-Publisher FASB
-URI https://asc.fasb.org//1943274/2147480097/470-10-S99-1B
Reference 16: http://www.xbrl.org/2003/role/disclosureRef
-Topic 470
-SubTopic 10
-Name Accounting Standards Codification
-Section S99
-Paragraph 1B
-Subparagraph (SX 210.13-02(a)(4)(iii)(B))
-Publisher FASB
-URI https://asc.fasb.org//1943274/2147480097/470-10-S99-1B
Reference 17: http://www.xbrl.org/2003/role/disclosureRef
-Topic 470
-SubTopic 10
-Name Accounting Standards Codification
-Section S99
-Paragraph 1B
-Subparagraph (SX 210.13-02(a)(4)(iv))
-Publisher FASB
-URI https://asc.fasb.org//1943274/2147480097/470-10-S99-1B
Reference 18: http://www.xbrl.org/2003/role/disclosureRef
-Topic 470
-SubTopic 10
-Name Accounting Standards Codification
-Section S99
-Paragraph 1B
-Subparagraph (SX 210.13-02(a)(5))
-Publisher FASB
-URI https://asc.fasb.org//1943274/2147480097/470-10-S99-1B
Reference 19: http://www.xbrl.org/2009/role/commonPracticeRef
-Topic 852
-SubTopic 10
-Name Accounting Standards Codification
-Section 50
-Paragraph 7
-Subparagraph (a)
-Publisher FASB
-URI https://asc.fasb.org//1943274/2147481404/852-10-50-7
Reference 20: http://www.xbrl.org/2009/role/commonPracticeRef
-Topic 852
-SubTopic 10
-Name Accounting Standards Codification
-Section 50
-Paragraph 7
-Subparagraph (b)
-Publisher FASB
-URI https://asc.fasb.org//1943274/2147481404/852-10-50-7
Reference 21: http://fasb.org/us-gaap/role/ref/legacyRef
-Name Accounting Standards Codification
-Topic 210
-SubTopic 10
-Section S99
-Paragraph 1
-Subparagraph (SX 210.5-02.21)
-Publisher FASB
-URI https://asc.fasb.org//1943274/2147480566/210-10-S99-1
| Name: |
us-gaap_LiabilitiesCurrent |
| Namespace Prefix: |
us-gaap_ |
| Data Type: |
xbrli:monetaryItemType |
| Balance Type: |
credit |
| Period Type: |
instant |
|
| X |
- References
+ Details
| Name: |
us-gaap_LiabilitiesCurrentAbstract |
| Namespace Prefix: |
us-gaap_ |
| Data Type: |
xbrli:stringItemType |
| Balance Type: |
na |
| Period Type: |
duration |
|
| X |
- DefinitionAmount of obligation due after one year or beyond the normal operating cycle, if longer. Reference 1: http://fasb.org/us-gaap/role/ref/legacyRef
-Name Accounting Standards Codification
-Section S99
-Paragraph 1
-Subparagraph (SX 210.5-02(22))
-SubTopic 10
-Topic 210
-Publisher FASB
-URI https://asc.fasb.org//1943274/2147480566/210-10-S99-1
Reference 2: http://www.xbrl.org/2003/role/disclosureRef
-Topic 810
-SubTopic 10
-Name Accounting Standards Codification
-Section 50
-Paragraph 3
-Subparagraph (c)
-Publisher FASB
-URI https://asc.fasb.org//1943274/2147481203/810-10-50-3
Reference 3: http://www.xbrl.org/2003/role/disclosureRef
-Topic 810
-SubTopic 10
-Name Accounting Standards Codification
-Section 45
-Paragraph 25
-Subparagraph (b)
-Publisher FASB
-URI https://asc.fasb.org//1943274/2147481231/810-10-45-25
Reference 4: http://www.xbrl.org/2003/role/disclosureRef
-Topic 810
-SubTopic 10
-Name Accounting Standards Codification
-Section 50
-Paragraph 3
-Subparagraph (bb)
-Publisher FASB
-URI https://asc.fasb.org//1943274/2147481203/810-10-50-3
Reference 5: http://www.xbrl.org/2003/role/disclosureRef
-Topic 235
-SubTopic 10
-Name Accounting Standards Codification
-Section S99
-Paragraph 1
-Subparagraph (SX 210.4-08(g)(1)(ii))
-Publisher FASB
-URI https://asc.fasb.org//1943274/2147480678/235-10-S99-1
Reference 6: http://www.xbrl.org/2003/role/disclosureRef
-Topic 323
-SubTopic 10
-Name Accounting Standards Codification
-Section 50
-Paragraph 3
-Subparagraph (c)
-Publisher FASB
-URI https://asc.fasb.org//1943274/2147481687/323-10-50-3
Reference 7: http://www.xbrl.org/2003/role/disclosureRef
-Topic 825
-SubTopic 10
-Name Accounting Standards Codification
-Section 50
-Paragraph 28
-Subparagraph (f)
-Publisher FASB
-URI https://asc.fasb.org//1943274/2147482907/825-10-50-28
Reference 8: http://www.xbrl.org/2003/role/disclosureRef
-Topic 470
-SubTopic 10
-Name Accounting Standards Codification
-Section S99
-Paragraph 1A
-Subparagraph (SX 210.13-01(a)(4)(i))
-Publisher FASB
-URI https://asc.fasb.org//1943274/2147480097/470-10-S99-1A
Reference 9: http://www.xbrl.org/2009/role/commonPracticeRef
-Topic 470
-SubTopic 10
-Name Accounting Standards Codification
-Section S99
-Paragraph 1A
-Subparagraph (SX 210.13-01(a)(4)(ii))
-Publisher FASB
-URI https://asc.fasb.org//1943274/2147480097/470-10-S99-1A
Reference 10: http://www.xbrl.org/2003/role/disclosureRef
-Topic 470
-SubTopic 10
-Name Accounting Standards Codification
-Section S99
-Paragraph 1A
-Subparagraph (SX 210.13-01(a)(4)(iii)(A))
-Publisher FASB
-URI https://asc.fasb.org//1943274/2147480097/470-10-S99-1A
Reference 11: http://www.xbrl.org/2003/role/disclosureRef
-Topic 470
-SubTopic 10
-Name Accounting Standards Codification
-Section S99
-Paragraph 1A
-Subparagraph (SX 210.13-01(a)(4)(iv))
-Publisher FASB
-URI https://asc.fasb.org//1943274/2147480097/470-10-S99-1A
Reference 12: http://www.xbrl.org/2003/role/disclosureRef
-Topic 470
-SubTopic 10
-Name Accounting Standards Codification
-Section S99
-Paragraph 1A
-Subparagraph (SX 210.13-01(a)(5))
-Publisher FASB
-URI https://asc.fasb.org//1943274/2147480097/470-10-S99-1A
Reference 13: http://www.xbrl.org/2003/role/disclosureRef
-Topic 470
-SubTopic 10
-Name Accounting Standards Codification
-Section S99
-Paragraph 1B
-Subparagraph (SX 210.13-02(a)(4)(i))
-Publisher FASB
-URI https://asc.fasb.org//1943274/2147480097/470-10-S99-1B
Reference 14: http://www.xbrl.org/2003/role/disclosureRef
-Topic 470
-SubTopic 10
-Name Accounting Standards Codification
-Section S99
-Paragraph 1B
-Subparagraph (SX 210.13-02(a)(4)(iii)(A))
-Publisher FASB
-URI https://asc.fasb.org//1943274/2147480097/470-10-S99-1B
Reference 15: http://www.xbrl.org/2003/role/disclosureRef
-Topic 470
-SubTopic 10
-Name Accounting Standards Codification
-Section S99
-Paragraph 1B
-Subparagraph (SX 210.13-02(a)(4)(iii)(B))
-Publisher FASB
-URI https://asc.fasb.org//1943274/2147480097/470-10-S99-1B
Reference 16: http://www.xbrl.org/2003/role/disclosureRef
-Topic 470
-SubTopic 10
-Name Accounting Standards Codification
-Section S99
-Paragraph 1B
-Subparagraph (SX 210.13-02(a)(4)(iv))
-Publisher FASB
-URI https://asc.fasb.org//1943274/2147480097/470-10-S99-1B
Reference 17: http://www.xbrl.org/2003/role/disclosureRef
-Topic 470
-SubTopic 10
-Name Accounting Standards Codification
-Section S99
-Paragraph 1B
-Subparagraph (SX 210.13-02(a)(5))
-Publisher FASB
-URI https://asc.fasb.org//1943274/2147480097/470-10-S99-1B
Reference 18: http://www.xbrl.org/2009/role/commonPracticeRef
-Topic 852
-SubTopic 10
-Name Accounting Standards Codification
-Section 50
-Paragraph 7
-Subparagraph (a)
-Publisher FASB
-URI https://asc.fasb.org//1943274/2147481404/852-10-50-7
Reference 19: http://www.xbrl.org/2009/role/commonPracticeRef
-Topic 852
-SubTopic 10
-Name Accounting Standards Codification
-Section 50
-Paragraph 7
-Subparagraph (b)
-Publisher FASB
-URI https://asc.fasb.org//1943274/2147481404/852-10-50-7
Reference 20: http://fasb.org/us-gaap/role/ref/legacyRef
-Topic 210
-SubTopic 10
-Name Accounting Standards Codification
-Section S99
-Paragraph 1
-Subparagraph (SX 210.5-02(23))
-Publisher FASB
-URI https://asc.fasb.org//1943274/2147480566/210-10-S99-1
Reference 21: http://fasb.org/us-gaap/role/ref/legacyRef
-Topic 210
-SubTopic 10
-Name Accounting Standards Codification
-Section S99
-Paragraph 1
-Subparagraph (SX 201.5-02(24))
-Publisher FASB
-URI https://asc.fasb.org//1943274/2147480566/210-10-S99-1
Reference 22: http://fasb.org/us-gaap/role/ref/legacyRef
-Topic 210
-SubTopic 10
-Name Accounting Standards Codification
-Section S99
-Paragraph 1
-Subparagraph (SX 201.5-02(25))
-Publisher FASB
-URI https://asc.fasb.org//1943274/2147480566/210-10-S99-1
Reference 23: http://fasb.org/us-gaap/role/ref/legacyRef
-Topic 210
-SubTopic 10
-Name Accounting Standards Codification
-Section S99
-Paragraph 1
-Subparagraph (SX 201.5-02(26))
-Publisher FASB
-URI https://asc.fasb.org//1943274/2147480566/210-10-S99-1
| Name: |
us-gaap_LiabilitiesNoncurrent |
| Namespace Prefix: |
us-gaap_ |
| Data Type: |
xbrli:monetaryItemType |
| Balance Type: |
credit |
| Period Type: |
instant |
|
| X |
- References
+ Details
| Name: |
us-gaap_LiabilitiesNoncurrentAbstract |
| Namespace Prefix: |
us-gaap_ |
| Data Type: |
xbrli:stringItemType |
| Balance Type: |
na |
| Period Type: |
duration |
|
| X |
- DefinitionAmount of equity (deficit) attributable to noncontrolling interest. Excludes temporary equity. Reference 1: http://www.xbrl.org/2003/role/disclosureRef
-Topic 235
-SubTopic 10
-Name Accounting Standards Codification
-Section S99
-Paragraph 1
-Subparagraph (SX 210.4-08(g)(1)(ii))
-Publisher FASB
-URI https://asc.fasb.org//1943274/2147480678/235-10-S99-1
Reference 2: http://www.xbrl.org/2003/role/disclosureRef
-Topic 323
-SubTopic 10
-Name Accounting Standards Codification
-Section 50
-Paragraph 3
-Subparagraph (c)
-Publisher FASB
-URI https://asc.fasb.org//1943274/2147481687/323-10-50-3
Reference 3: http://www.xbrl.org/2003/role/disclosureRef
-Topic 825
-SubTopic 10
-Name Accounting Standards Codification
-Section 50
-Paragraph 28
-Subparagraph (f)
-Publisher FASB
-URI https://asc.fasb.org//1943274/2147482907/825-10-50-28
Reference 4: http://www.xbrl.org/2003/role/disclosureRef
-Topic 944
-SubTopic 210
-Name Accounting Standards Codification
-Section S99
-Paragraph 1
-Subparagraph (SX 210.7-03(a)(24))
-Publisher FASB
-URI https://asc.fasb.org//1943274/2147479440/944-210-S99-1
Reference 5: http://www.xbrl.org/2003/role/disclosureRef
-Topic 946
-SubTopic 210
-Name Accounting Standards Codification
-Section S99
-Paragraph 1
-Subparagraph (SX 210.6-04(19))
-Publisher FASB
-URI https://asc.fasb.org//1943274/2147479617/946-210-S99-1
Reference 6: http://www.xbrl.org/2003/role/disclosureRef
-Topic 470
-SubTopic 10
-Name Accounting Standards Codification
-Section S99
-Paragraph 1A
-Subparagraph (SX 210.13-01(a)(4)(i))
-Publisher FASB
-URI https://asc.fasb.org//1943274/2147480097/470-10-S99-1A
Reference 7: http://www.xbrl.org/2003/role/disclosureRef
-Topic 470
-SubTopic 10
-Name Accounting Standards Codification
-Section S99
-Paragraph 1A
-Subparagraph (SX 210.13-01(a)(4)(iv))
-Publisher FASB
-URI https://asc.fasb.org//1943274/2147480097/470-10-S99-1A
Reference 8: http://www.xbrl.org/2003/role/disclosureRef
-Topic 470
-SubTopic 10
-Name Accounting Standards Codification
-Section S99
-Paragraph 1A
-Subparagraph (SX 210.13-01(a)(5))
-Publisher FASB
-URI https://asc.fasb.org//1943274/2147480097/470-10-S99-1A
Reference 9: http://www.xbrl.org/2003/role/disclosureRef
-Topic 470
-SubTopic 10
-Name Accounting Standards Codification
-Section S99
-Paragraph 1B
-Subparagraph (SX 210.13-02(a)(4)(i))
-Publisher FASB
-URI https://asc.fasb.org//1943274/2147480097/470-10-S99-1B
Reference 10: http://www.xbrl.org/2003/role/disclosureRef
-Topic 470
-SubTopic 10
-Name Accounting Standards Codification
-Section S99
-Paragraph 1B
-Subparagraph (SX 210.13-02(a)(4)(iv))
-Publisher FASB
-URI https://asc.fasb.org//1943274/2147480097/470-10-S99-1B
Reference 11: http://www.xbrl.org/2003/role/disclosureRef
-Topic 470
-SubTopic 10
-Name Accounting Standards Codification
-Section S99
-Paragraph 1B
-Subparagraph (SX 210.13-02(a)(5))
-Publisher FASB
-URI https://asc.fasb.org//1943274/2147480097/470-10-S99-1B
Reference 12: http://fasb.org/us-gaap/role/ref/legacyRef
-Topic 942
-SubTopic 210
-Name Accounting Standards Codification
-Section S99
-Paragraph 1
-Subparagraph (SX 210.9-03(22))
-Publisher FASB
-URI https://asc.fasb.org//1943274/2147479853/942-210-S99-1
Reference 13: http://fasb.org/us-gaap/role/ref/legacyRef
-Name Accounting Standards Codification
-Topic 210
-SubTopic 10
-Section S99
-Paragraph 1
-Subparagraph (SX 210.5-02.31)
-Publisher FASB
-URI https://asc.fasb.org//1943274/2147480566/210-10-S99-1
| Name: |
us-gaap_MinorityInterest |
| Namespace Prefix: |
us-gaap_ |
| Data Type: |
xbrli:monetaryItemType |
| Balance Type: |
credit |
| Period Type: |
instant |
|
| X |
- DefinitionPresent value of lessee's discounted obligation for lease payments from operating lease, classified as current. Reference 1: http://www.xbrl.org/2003/role/disclosureRef
-Topic 842
-SubTopic 20
-Name Accounting Standards Codification
-Section 45
-Paragraph 1
-Subparagraph (b)
-Publisher FASB
-URI https://asc.fasb.org//1943274/2147479041/842-20-45-1
| Name: |
us-gaap_OperatingLeaseLiabilityCurrent |
| Namespace Prefix: |
us-gaap_ |
| Data Type: |
xbrli:monetaryItemType |
| Balance Type: |
credit |
| Period Type: |
instant |
|
| X |
- DefinitionPresent value of lessee's discounted obligation for lease payments from operating lease, classified as noncurrent. Reference 1: http://www.xbrl.org/2003/role/disclosureRef
-Topic 842
-SubTopic 20
-Name Accounting Standards Codification
-Section 45
-Paragraph 1
-Subparagraph (b)
-Publisher FASB
-URI https://asc.fasb.org//1943274/2147479041/842-20-45-1
| Name: |
us-gaap_OperatingLeaseLiabilityNoncurrent |
| Namespace Prefix: |
us-gaap_ |
| Data Type: |
xbrli:monetaryItemType |
| Balance Type: |
credit |
| Period Type: |
instant |
|
| X |
- DefinitionAmount of lessee's right to use underlying asset under operating lease. Reference 1: http://www.xbrl.org/2003/role/disclosureRef
-Topic 842
-SubTopic 20
-Name Accounting Standards Codification
-Section 45
-Paragraph 1
-Subparagraph (a)
-Publisher FASB
-URI https://asc.fasb.org//1943274/2147479041/842-20-45-1
| Name: |
us-gaap_OperatingLeaseRightOfUseAsset |
| Namespace Prefix: |
us-gaap_ |
| Data Type: |
xbrli:monetaryItemType |
| Balance Type: |
debit |
| Period Type: |
instant |
|
| X |
- DefinitionAmount of liabilities classified as other, due within one year or the normal operating cycle, if longer. Reference 1: http://www.xbrl.org/2003/role/exampleRef
-Topic 852
-SubTopic 10
-Name Accounting Standards Codification
-Section 55
-Paragraph 10
-Publisher FASB
-URI https://asc.fasb.org//1943274/2147481372/852-10-55-10
Reference 2: http://fasb.org/us-gaap/role/ref/legacyRef
-Name Accounting Standards Codification
-Topic 210
-SubTopic 10
-Section S99
-Paragraph 1
-Subparagraph (SX 210.5-02.20)
-Publisher FASB
-URI https://asc.fasb.org//1943274/2147480566/210-10-S99-1
| Name: |
us-gaap_OtherLiabilitiesCurrent |
| Namespace Prefix: |
us-gaap_ |
| Data Type: |
xbrli:monetaryItemType |
| Balance Type: |
credit |
| Period Type: |
instant |
|
| X |
- DefinitionAggregate par or stated value of issued nonredeemable preferred stock (or preferred stock redeemable solely at the option of the issuer). This item includes treasury stock repurchased by the entity. Note: elements for number of nonredeemable preferred shares, par value and other disclosure concepts are in another section within stockholders' equity. Reference 1: http://www.xbrl.org/2003/role/exampleRef
-Topic 852
-SubTopic 10
-Name Accounting Standards Codification
-Section 55
-Paragraph 10
-Publisher FASB
-URI https://asc.fasb.org//1943274/2147481372/852-10-55-10
Reference 2: http://www.xbrl.org/2003/role/disclosureRef
-Topic 944
-SubTopic 210
-Name Accounting Standards Codification
-Section S99
-Paragraph 1
-Subparagraph (SX 210.7-03(a)(21))
-Publisher FASB
-URI https://asc.fasb.org//1943274/2147479440/944-210-S99-1
Reference 3: http://fasb.org/us-gaap/role/ref/legacyRef
-Topic 210
-SubTopic 10
-Name Accounting Standards Codification
-Section S99
-Paragraph 1
-Subparagraph (SX 210.5-02(28))
-Publisher FASB
-URI https://asc.fasb.org//1943274/2147480566/210-10-S99-1
| Name: |
us-gaap_PreferredStockValue |
| Namespace Prefix: |
us-gaap_ |
| Data Type: |
xbrli:monetaryItemType |
| Balance Type: |
credit |
| Period Type: |
instant |
|
| X |
- DefinitionAmount of asset related to consideration paid in advance for costs that provide economic benefits within a future period of one year or the normal operating cycle, if longer. Reference 1: http://www.xbrl.org/2003/role/exampleRef
-Topic 210
-SubTopic 10
-Name Accounting Standards Codification
-Section 45
-Paragraph 1
-Subparagraph (g)
-Publisher FASB
-URI https://asc.fasb.org//1943274/2147483467/210-10-45-1
Reference 2: http://www.xbrl.org/2003/role/disclosureRef
-Topic 210
-SubTopic 10
-Name Accounting Standards Codification
-Section S99
-Paragraph 1
-Subparagraph (SX 210.5-02(7))
-Publisher FASB
-URI https://asc.fasb.org//1943274/2147480566/210-10-S99-1
Reference 3: http://www.xbrl.org/2003/role/disclosureRef
-Topic 340
-SubTopic 10
-Name Accounting Standards Codification
-Section 05
-Paragraph 5
-Publisher FASB
-URI https://asc.fasb.org//1943274/2147482955/340-10-05-5
Reference 4: http://www.xbrl.org/2003/role/disclosureRef
-Topic 340
-SubTopic 10
-Name Accounting Standards Codification
-Section 45
-Paragraph 1
-Publisher FASB
-URI https://asc.fasb.org//1943274/2147483032/340-10-45-1
| Name: |
us-gaap_PrepaidExpenseCurrent |
| Namespace Prefix: |
us-gaap_ |
| Data Type: |
xbrli:monetaryItemType |
| Balance Type: |
debit |
| Period Type: |
instant |
|
| X |
- DefinitionAmount after accumulated depreciation, depletion and amortization of physical assets used in the normal conduct of business to produce goods and services and not intended for resale. Examples include, but are not limited to, land, buildings, machinery and equipment, office equipment, and furniture and fixtures. Reference 1: http://fasb.org/us-gaap/role/ref/legacyRef
-Name Accounting Standards Codification
-Section 50
-Paragraph 1
-SubTopic 10
-Topic 360
-Publisher FASB
-URI https://asc.fasb.org//1943274/2147482099/360-10-50-1
Reference 2: http://www.xbrl.org/2003/role/exampleRef
-Topic 852
-SubTopic 10
-Name Accounting Standards Codification
-Section 55
-Paragraph 10
-Publisher FASB
-URI https://asc.fasb.org//1943274/2147481372/852-10-55-10
Reference 3: http://www.xbrl.org/2003/role/disclosureRef
-Topic 944
-SubTopic 210
-Name Accounting Standards Codification
-Section S99
-Paragraph 1
-Subparagraph (SX 210.7-03(a)(8))
-Publisher FASB
-URI https://asc.fasb.org//1943274/2147479440/944-210-S99-1
Reference 4: http://www.xbrl.org/2003/role/disclosureRef
-Topic 942
-SubTopic 360
-Name Accounting Standards Codification
-Section 50
-Paragraph 1
-Publisher FASB
-URI https://asc.fasb.org//1943274/2147480842/942-360-50-1
| Name: |
us-gaap_PropertyPlantAndEquipmentNet |
| Namespace Prefix: |
us-gaap_ |
| Data Type: |
xbrli:monetaryItemType |
| Balance Type: |
debit |
| Period Type: |
instant |
|
| X |
- DefinitionAmount of accumulated undistributed earnings (deficit). Reference 1: http://www.xbrl.org/2003/role/exampleRef
-Topic 852
-SubTopic 10
-Name Accounting Standards Codification
-Section 55
-Paragraph 10
-Publisher FASB
-URI https://asc.fasb.org//1943274/2147481372/852-10-55-10
Reference 2: http://www.xbrl.org/2003/role/disclosureRef
-Topic 944
-SubTopic 40
-Name Accounting Standards Codification
-Section 65
-Paragraph 2
-Subparagraph (g)(2)(i)
-Publisher FASB
-URI https://asc.fasb.org//1943274/2147480016/944-40-65-2
Reference 3: http://www.xbrl.org/2003/role/disclosureRef
-Topic 944
-SubTopic 40
-Name Accounting Standards Codification
-Section 65
-Paragraph 2
-Subparagraph (h)(2)
-Publisher FASB
-URI https://asc.fasb.org//1943274/2147480016/944-40-65-2
Reference 4: http://www.xbrl.org/2003/role/disclosureRef
-Topic 946
-SubTopic 20
-Name Accounting Standards Codification
-Section 50
-Paragraph 11
-Publisher FASB
-URI https://asc.fasb.org//1943274/2147480990/946-20-50-11
Reference 5: http://www.xbrl.org/2003/role/disclosureRef
-Topic 944
-SubTopic 210
-Name Accounting Standards Codification
-Section S99
-Paragraph 1
-Subparagraph (SX 210.7-03(a)(23)(a)(4))
-Publisher FASB
-URI https://asc.fasb.org//1943274/2147479440/944-210-S99-1
Reference 6: http://www.xbrl.org/2003/role/disclosureRef
-Topic 946
-SubTopic 210
-Name Accounting Standards Codification
-Section S99
-Paragraph 1
-Subparagraph (SX 210.6-04(17))
-Publisher FASB
-URI https://asc.fasb.org//1943274/2147479617/946-210-S99-1
Reference 7: http://fasb.org/us-gaap/role/ref/legacyRef
-Topic 505
-SubTopic 10
-Name Accounting Standards Codification
-Section S99
-Paragraph 1
-Subparagraph (SX 210.3-04)
-Publisher FASB
-URI https://asc.fasb.org//1943274/2147480008/505-10-S99-1
Reference 8: http://fasb.org/us-gaap/role/ref/legacyRef
-Topic 210
-SubTopic 10
-Name Accounting Standards Codification
-Section S99
-Paragraph 1
-Subparagraph (SX 210.5-02(30)(a)(3))
-Publisher FASB
-URI https://asc.fasb.org//1943274/2147480566/210-10-S99-1
| Name: |
us-gaap_RetainedEarningsAccumulatedDeficit |
| Namespace Prefix: |
us-gaap_ |
| Data Type: |
xbrli:monetaryItemType |
| Balance Type: |
credit |
| Period Type: |
instant |
|
| X |
- References
+ Details
| Name: |
us-gaap_StockholdersEquityAbstract |
| Namespace Prefix: |
us-gaap_ |
| Data Type: |
xbrli:stringItemType |
| Balance Type: |
na |
| Period Type: |
duration |
|
| X |
- DefinitionAmount of equity (deficit) attributable to parent and noncontrolling interest. Excludes temporary equity. Reference 1: http://www.xbrl.org/2003/role/disclosureRef
-Topic 250
-SubTopic 10
-Name Accounting Standards Codification
-Section 45
-Paragraph 24
-Publisher FASB
-URI https://asc.fasb.org//1943274/2147483421/250-10-45-24
Reference 2: http://www.xbrl.org/2003/role/disclosureRef
-Topic 250
-SubTopic 10
-Name Accounting Standards Codification
-Section 45
-Paragraph 23
-Subparagraph (b)
-Publisher FASB
-URI https://asc.fasb.org//1943274/2147483421/250-10-45-23
Reference 3: http://www.xbrl.org/2003/role/disclosureRef
-Topic 250
-SubTopic 10
-Name Accounting Standards Codification
-Section 45
-Paragraph 5
-Subparagraph (b)
-Publisher FASB
-URI https://asc.fasb.org//1943274/2147483421/250-10-45-5
Reference 4: http://www.xbrl.org/2003/role/disclosureRef
-Topic 326
-SubTopic 10
-Name Accounting Standards Codification
-Section 65
-Paragraph 5
-Subparagraph (c)(2)
-Publisher FASB
-URI https://asc.fasb.org//1943274/2147479654/326-10-65-5
Reference 5: http://www.xbrl.org/2003/role/disclosureRef
-Topic 815
-SubTopic 20
-Name Accounting Standards Codification
-Section 65
-Paragraph 6
-Subparagraph (e)
-Publisher FASB
-URI https://asc.fasb.org//1943274/2147480528/815-20-65-6
Reference 6: http://www.xbrl.org/2003/role/disclosureRef
-Topic 815
-SubTopic 20
-Name Accounting Standards Codification
-Section 65
-Paragraph 6
-Subparagraph (h)(1)
-Publisher FASB
-URI https://asc.fasb.org//1943274/2147480528/815-20-65-6
Reference 7: http://www.xbrl.org/2003/role/disclosureRef
-Topic 815
-SubTopic 20
-Name Accounting Standards Codification
-Section 65
-Paragraph 6
-Subparagraph (h)(1)(i)
-Publisher FASB
-URI https://asc.fasb.org//1943274/2147480528/815-20-65-6
Reference 8: http://www.xbrl.org/2003/role/disclosureRef
-Topic 815
-SubTopic 20
-Name Accounting Standards Codification
-Section 65
-Paragraph 6
-Subparagraph (h)(1)(iii)
-Publisher FASB
-URI https://asc.fasb.org//1943274/2147480528/815-20-65-6
Reference 9: http://www.xbrl.org/2003/role/disclosureRef
-Topic 815
-SubTopic 20
-Name Accounting Standards Codification
-Section 65
-Paragraph 6
-Subparagraph (h)(1)(iv)
-Publisher FASB
-URI https://asc.fasb.org//1943274/2147480528/815-20-65-6
Reference 10: http://www.xbrl.org/2003/role/disclosureRef
-Topic 815
-SubTopic 20
-Name Accounting Standards Codification
-Section 65
-Paragraph 6
-Subparagraph (i)(3)
-Publisher FASB
-URI https://asc.fasb.org//1943274/2147480528/815-20-65-6
Reference 11: http://www.xbrl.org/2003/role/disclosureRef
-Topic 848
-SubTopic 10
-Name Accounting Standards Codification
-Section 65
-Paragraph 2
-Subparagraph (a)(3)(iii)(03)
-Publisher FASB
-URI https://asc.fasb.org//1943274/2147483550/848-10-65-2
Reference 12: http://www.xbrl.org/2003/role/disclosureRef
-Topic 105
-SubTopic 10
-Name Accounting Standards Codification
-Section 65
-Paragraph 6
-Subparagraph (c)
-Publisher FASB
-URI https://asc.fasb.org//1943274/2147479343/105-10-65-6
Reference 13: http://www.xbrl.org/2003/role/disclosureRef
-Topic 105
-SubTopic 10
-Name Accounting Standards Codification
-Section 65
-Paragraph 6
-Subparagraph (d)
-Publisher FASB
-URI https://asc.fasb.org//1943274/2147479343/105-10-65-6
Reference 14: http://www.xbrl.org/2003/role/disclosureRef
-Topic 944
-SubTopic 40
-Name Accounting Standards Codification
-Section 65
-Paragraph 2
-Subparagraph (f)(1)
-Publisher FASB
-URI https://asc.fasb.org//1943274/2147480016/944-40-65-2
Reference 15: http://www.xbrl.org/2003/role/disclosureRef
-Topic 944
-SubTopic 40
-Name Accounting Standards Codification
-Section 65
-Paragraph 2
-Subparagraph (f)(2)
-Publisher FASB
-URI https://asc.fasb.org//1943274/2147480016/944-40-65-2
Reference 16: http://www.xbrl.org/2003/role/disclosureRef
-Topic 740
-SubTopic 10
-Name Accounting Standards Codification
-Section 65
-Paragraph 8
-Subparagraph (d)(2)
-Publisher FASB
-URI https://asc.fasb.org//1943274/2147482615/740-10-65-8
Reference 17: http://www.xbrl.org/2003/role/disclosureRef
-Topic 740
-SubTopic 10
-Name Accounting Standards Codification
-Section 65
-Paragraph 8
-Subparagraph (d)(3)
-Publisher FASB
-URI https://asc.fasb.org//1943274/2147482615/740-10-65-8
Reference 18: http://www.xbrl.org/2003/role/disclosureRef
-Topic 326
-SubTopic 10
-Name Accounting Standards Codification
-Section 65
-Paragraph 4
-Subparagraph (d)
-Publisher FASB
-URI https://asc.fasb.org//1943274/2147479654/326-10-65-4
Reference 19: http://www.xbrl.org/2003/role/disclosureRef
-Topic 718
-SubTopic 10
-Name Accounting Standards Codification
-Section 65
-Paragraph 15
-Subparagraph (e)
-Publisher FASB
-URI https://asc.fasb.org//1943274/2147480336/718-10-65-15
Reference 20: http://www.xbrl.org/2003/role/disclosureRef
-Topic 718
-SubTopic 10
-Name Accounting Standards Codification
-Section 65
-Paragraph 15
-Subparagraph (f)(1)
-Publisher FASB
-URI https://asc.fasb.org//1943274/2147480336/718-10-65-15
Reference 21: http://www.xbrl.org/2003/role/disclosureRef
-Topic 718
-SubTopic 10
-Name Accounting Standards Codification
-Section 65
-Paragraph 15
-Subparagraph (f)(2)
-Publisher FASB
-URI https://asc.fasb.org//1943274/2147480336/718-10-65-15
Reference 22: http://www.xbrl.org/2003/role/disclosureRef
-Topic 250
-SubTopic 10
-Name Accounting Standards Codification
-Section 50
-Paragraph 1
-Subparagraph (b)(3)
-Publisher FASB
-URI https://asc.fasb.org//1943274/2147483443/250-10-50-1
Reference 23: http://www.xbrl.org/2003/role/disclosureRef
-Topic 815
-SubTopic 40
-Name Accounting Standards Codification
-Section 65
-Paragraph 1
-Subparagraph (e)(3)
-Publisher FASB
-URI https://asc.fasb.org//1943274/2147480175/815-40-65-1
Reference 24: http://www.xbrl.org/2003/role/disclosureRef
-Topic 250
-SubTopic 10
-Name Accounting Standards Codification
-Section 50
-Paragraph 7
-Subparagraph (b)
-Publisher FASB
-URI https://asc.fasb.org//1943274/2147483443/250-10-50-7
Reference 25: http://www.xbrl.org/2003/role/disclosureRef
-Topic 220
-SubTopic 10
-Name Accounting Standards Codification
-Section 50
-Paragraph 5
-Publisher FASB
-URI https://asc.fasb.org//1943274/2147482765/220-10-50-5
Reference 26: http://www.xbrl.org/2003/role/disclosureRef
-Topic 830
-SubTopic 30
-Name Accounting Standards Codification
-Section 50
-Paragraph 1
-Publisher FASB
-URI https://asc.fasb.org//1943274/2147481674/830-30-50-1
Reference 27: http://www.xbrl.org/2003/role/disclosureRef
-Topic 830
-SubTopic 30
-Name Accounting Standards Codification
-Section 45
-Paragraph 17
-Publisher FASB
-URI https://asc.fasb.org//1943274/2147481694/830-30-45-17
Reference 28: http://www.xbrl.org/2003/role/disclosureRef
-Topic 830
-SubTopic 30
-Name Accounting Standards Codification
-Section 45
-Paragraph 20
-Subparagraph (a)
-Publisher FASB
-URI https://asc.fasb.org//1943274/2147481694/830-30-45-20
Reference 29: http://www.xbrl.org/2003/role/exampleRef
-Topic 946
-SubTopic 830
-Name Accounting Standards Codification
-Section 55
-Paragraph 11
-Publisher FASB
-URI https://asc.fasb.org//1943274/2147480167/946-830-55-11
Reference 30: http://www.xbrl.org/2003/role/disclosureRef
-Topic 946
-SubTopic 205
-Name Accounting Standards Codification
-Section 45
-Paragraph 3
-Publisher FASB
-URI https://asc.fasb.org//1943274/2147480767/946-205-45-3
Reference 31: http://www.xbrl.org/2003/role/disclosureRef
-Topic 946
-SubTopic 505
-Name Accounting Standards Codification
-Section 50
-Paragraph 3
-Publisher FASB
-URI https://asc.fasb.org//1943274/2147481004/946-505-50-3
Reference 32: http://www.xbrl.org/2003/role/disclosureRef
-Topic 946
-SubTopic 210
-Name Accounting Standards Codification
-Section S99
-Paragraph 1
-Subparagraph (SX 210.6-04(19))
-Publisher FASB
-URI https://asc.fasb.org//1943274/2147479617/946-210-S99-1
Reference 33: http://www.xbrl.org/2003/role/disclosureRef
-Topic 946
-SubTopic 210
-Name Accounting Standards Codification
-Section S99
-Paragraph 2
-Subparagraph (SX 210.6-05(4))
-Publisher FASB
-URI https://asc.fasb.org//1943274/2147479617/946-210-S99-2
Reference 34: http://www.xbrl.org/2009/role/commonPracticeRef
-Topic 946
-SubTopic 220
-Name Accounting Standards Codification
-Section S99
-Paragraph 3
-Subparagraph (SX 210.6-09(4)(b))
-Publisher FASB
-URI https://asc.fasb.org//1943274/2147483575/946-220-S99-3
Reference 35: http://www.xbrl.org/2003/role/disclosureRef
-Topic 946
-SubTopic 220
-Name Accounting Standards Codification
-Section S99
-Paragraph 3
-Subparagraph (SX 210.6-09(6))
-Publisher FASB
-URI https://asc.fasb.org//1943274/2147483575/946-220-S99-3
Reference 36: http://www.xbrl.org/2003/role/disclosureRef
-Topic 946
-SubTopic 220
-Name Accounting Standards Codification
-Section S99
-Paragraph 3
-Subparagraph (SX 210.6-09(7))
-Publisher FASB
-URI https://asc.fasb.org//1943274/2147483575/946-220-S99-3
Reference 37: http://www.xbrl.org/2003/role/disclosureRef
-Topic 505
-SubTopic 10
-Name Accounting Standards Codification
-Section S99
-Paragraph 1
-Subparagraph (SX 210.3-04)
-Publisher FASB
-URI https://asc.fasb.org//1943274/2147480008/505-10-S99-1
Reference 38: http://www.xbrl.org/2009/role/commonPracticeRef
-Topic 235
-SubTopic 10
-Name Accounting Standards Codification
-Section S99
-Paragraph 1
-Subparagraph (SX 210.4-08(g)(1)(ii))
-Publisher FASB
-URI https://asc.fasb.org//1943274/2147480678/235-10-S99-1
Reference 39: http://www.xbrl.org/2009/role/commonPracticeRef
-Topic 323
-SubTopic 10
-Name Accounting Standards Codification
-Section 50
-Paragraph 3
-Subparagraph (c)
-Publisher FASB
-URI https://asc.fasb.org//1943274/2147481687/323-10-50-3
Reference 40: http://www.xbrl.org/2009/role/commonPracticeRef
-Topic 825
-SubTopic 10
-Name Accounting Standards Codification
-Section 50
-Paragraph 28
-Subparagraph (f)
-Publisher FASB
-URI https://asc.fasb.org//1943274/2147482907/825-10-50-28
Reference 41: http://fasb.org/us-gaap/role/ref/legacyRef
-Name Accounting Standards Codification
-Topic 810
-SubTopic 10
-Section 45
-Paragraph 15
-Publisher FASB
-URI https://asc.fasb.org//1943274/2147481231/810-10-45-15
Reference 42: http://fasb.org/us-gaap/role/ref/legacyRef
-Name Accounting Standards Codification
-Topic 810
-SubTopic 10
-Section 45
-Paragraph 16
-Publisher FASB
-URI https://asc.fasb.org//1943274/2147481231/810-10-45-16
Reference 43: http://fasb.org/us-gaap/role/ref/legacyRef
-Name Accounting Standards Codification
-Topic 810
-SubTopic 10
-Section 55
-Paragraph 4I
-Publisher FASB
-URI https://asc.fasb.org//1943274/2147481175/810-10-55-4I
| Name: |
us-gaap_StockholdersEquityIncludingPortionAttributableToNoncontrollingInterest |
| Namespace Prefix: |
us-gaap_ |
| Data Type: |
xbrli:monetaryItemType |
| Balance Type: |
credit |
| Period Type: |
instant |
|
| X |
- DefinitionCarrying value as of the balance sheet date of obligations incurred and payable for statutory income, sales, use, payroll, excise, real, property and other taxes. Used to reflect the current portion of the liabilities (due within one year or within the normal operating cycle if longer). Reference 1: http://fasb.org/us-gaap/role/ref/legacyRef
-Name Accounting Standards Codification
-Topic 210
-SubTopic 10
-Section S99
-Paragraph 1
-Subparagraph (SX 210.5-02.19,20)
-Publisher FASB
-URI https://asc.fasb.org//1943274/2147480566/210-10-S99-1
| Name: |
us-gaap_TaxesPayableCurrent |
| Namespace Prefix: |
us-gaap_ |
| Data Type: |
xbrli:monetaryItemType |
| Balance Type: |
credit |
| Period Type: |
instant |
|
v3.23.3
Condensed Consolidated Balance Sheets (Parenthetical) - $ / shares
|
Sep. 30, 2023 |
Dec. 31, 2022 |
| Statement of Financial Position [Abstract] |
|
|
| Preferred stock, par value |
$ 0.0001
|
$ 0.0001
|
| Preferred stock, shares authorized |
200,000,000
|
200,000,000
|
| Preferred stock, shares issued |
0
|
0
|
| Preferred stock, shares outstanding |
0
|
0
|
| Common stock, par value |
$ 0.0001
|
$ 0.0001
|
| Common stock, shares authorized |
600,000,000
|
600,000,000
|
| Common stock, shares issued |
81,551,838
|
73,319,800
|
| Common stock, shares outstanding |
81,551,838
|
73,319,800
|
| X |
- DefinitionFace amount or stated value per share of common stock. Reference 1: http://fasb.org/us-gaap/role/ref/legacyRef
-Topic 210
-SubTopic 10
-Name Accounting Standards Codification
-Section S99
-Paragraph 1
-Subparagraph (SX 210.5-02(29))
-Publisher FASB
-URI https://asc.fasb.org//1943274/2147480566/210-10-S99-1
| Name: |
us-gaap_CommonStockParOrStatedValuePerShare |
| Namespace Prefix: |
us-gaap_ |
| Data Type: |
dtr-types:perShareItemType |
| Balance Type: |
na |
| Period Type: |
instant |
|
| X |
- DefinitionThe maximum number of common shares permitted to be issued by an entity's charter and bylaws. Reference 1: http://www.xbrl.org/2003/role/disclosureRef
-Topic 946
-SubTopic 210
-Name Accounting Standards Codification
-Section S99
-Paragraph 1
-Subparagraph (SX 210.6-04(16)(a))
-Publisher FASB
-URI https://asc.fasb.org//1943274/2147479617/946-210-S99-1
Reference 2: http://fasb.org/us-gaap/role/ref/legacyRef
-Topic 210
-SubTopic 10
-Name Accounting Standards Codification
-Section S99
-Paragraph 1
-Subparagraph (SX 210.5-02(29))
-Publisher FASB
-URI https://asc.fasb.org//1943274/2147480566/210-10-S99-1
| Name: |
us-gaap_CommonStockSharesAuthorized |
| Namespace Prefix: |
us-gaap_ |
| Data Type: |
xbrli:sharesItemType |
| Balance Type: |
na |
| Period Type: |
instant |
|
| X |
- DefinitionTotal number of common shares of an entity that have been sold or granted to shareholders (includes common shares that were issued, repurchased and remain in the treasury). These shares represent capital invested by the firm's shareholders and owners, and may be all or only a portion of the number of shares authorized. Shares issued include shares outstanding and shares held in the treasury. Reference 1: http://fasb.org/us-gaap/role/ref/legacyRef
-Topic 210
-SubTopic 10
-Name Accounting Standards Codification
-Section S99
-Paragraph 1
-Subparagraph (SX 210.5-02(29))
-Publisher FASB
-URI https://asc.fasb.org//1943274/2147480566/210-10-S99-1
| Name: |
us-gaap_CommonStockSharesIssued |
| Namespace Prefix: |
us-gaap_ |
| Data Type: |
xbrli:sharesItemType |
| Balance Type: |
na |
| Period Type: |
instant |
|
| X |
- DefinitionNumber of shares of common stock outstanding. Common stock represent the ownership interest in a corporation. Reference 1: http://fasb.org/us-gaap/role/ref/legacyRef
-Name Accounting Standards Codification
-Section 50
-Paragraph 2
-SubTopic 10
-Topic 505
-Publisher FASB
-URI https://asc.fasb.org//1943274/2147481112/505-10-50-2
Reference 2: http://www.xbrl.org/2003/role/disclosureRef
-Topic 946
-SubTopic 210
-Name Accounting Standards Codification
-Section S99
-Paragraph 2
-Subparagraph (SX 210.6-05(4))
-Publisher FASB
-URI https://asc.fasb.org//1943274/2147479617/946-210-S99-2
Reference 3: http://www.xbrl.org/2009/role/commonPracticeRef
-Topic 946
-SubTopic 220
-Name Accounting Standards Codification
-Section S99
-Paragraph 3
-Subparagraph (SX 210.6-09(4)(b))
-Publisher FASB
-URI https://asc.fasb.org//1943274/2147483575/946-220-S99-3
Reference 4: http://www.xbrl.org/2003/role/disclosureRef
-Topic 946
-SubTopic 210
-Name Accounting Standards Codification
-Section S99
-Paragraph 1
-Subparagraph (SX 210.6-04(16)(a))
-Publisher FASB
-URI https://asc.fasb.org//1943274/2147479617/946-210-S99-1
Reference 5: http://www.xbrl.org/2009/role/commonPracticeRef
-Topic 946
-SubTopic 220
-Name Accounting Standards Codification
-Section S99
-Paragraph 3
-Subparagraph (SX 210.6-09(7))
-Publisher FASB
-URI https://asc.fasb.org//1943274/2147483575/946-220-S99-3
Reference 6: http://fasb.org/us-gaap/role/ref/legacyRef
-Topic 210
-SubTopic 10
-Name Accounting Standards Codification
-Section S99
-Paragraph 1
-Subparagraph (SX 210.5-02(29))
-Publisher FASB
-URI https://asc.fasb.org//1943274/2147480566/210-10-S99-1
| Name: |
us-gaap_CommonStockSharesOutstanding |
| Namespace Prefix: |
us-gaap_ |
| Data Type: |
xbrli:sharesItemType |
| Balance Type: |
na |
| Period Type: |
instant |
|
| X |
- DefinitionFace amount or stated value per share of preferred stock nonredeemable or redeemable solely at the option of the issuer. Reference 1: http://www.xbrl.org/2003/role/disclosureRef
-Topic 505
-SubTopic 10
-Name Accounting Standards Codification
-Section 50
-Paragraph 13
-Subparagraph (a)
-Publisher FASB
-URI https://asc.fasb.org//1943274/2147481112/505-10-50-13
Reference 2: http://fasb.org/us-gaap/role/ref/legacyRef
-Topic 210
-SubTopic 10
-Name Accounting Standards Codification
-Section S99
-Paragraph 1
-Subparagraph (SX 210.5-02(28))
-Publisher FASB
-URI https://asc.fasb.org//1943274/2147480566/210-10-S99-1
| Name: |
us-gaap_PreferredStockParOrStatedValuePerShare |
| Namespace Prefix: |
us-gaap_ |
| Data Type: |
dtr-types:perShareItemType |
| Balance Type: |
na |
| Period Type: |
instant |
|
| X |
- DefinitionThe maximum number of nonredeemable preferred shares (or preferred stock redeemable solely at the option of the issuer) permitted to be issued by an entity's charter and bylaws. Reference 1: http://www.xbrl.org/2003/role/disclosureRef
-Topic 946
-SubTopic 210
-Name Accounting Standards Codification
-Section S99
-Paragraph 1
-Subparagraph (SX 210.6-04(16)(a))
-Publisher FASB
-URI https://asc.fasb.org//1943274/2147479617/946-210-S99-1
Reference 2: http://fasb.org/us-gaap/role/ref/legacyRef
-Topic 210
-SubTopic 10
-Name Accounting Standards Codification
-Section S99
-Paragraph 1
-Subparagraph (SX 210.5-02(28))
-Publisher FASB
-URI https://asc.fasb.org//1943274/2147480566/210-10-S99-1
| Name: |
us-gaap_PreferredStockSharesAuthorized |
| Namespace Prefix: |
us-gaap_ |
| Data Type: |
xbrli:sharesItemType |
| Balance Type: |
na |
| Period Type: |
instant |
|
| X |
- DefinitionTotal number of nonredeemable preferred shares (or preferred stock redeemable solely at the option of the issuer) issued to shareholders (includes related preferred shares that were issued, repurchased, and remain in the treasury). May be all or portion of the number of preferred shares authorized. Excludes preferred shares that are classified as debt. Reference 1: http://www.xbrl.org/2003/role/disclosureRef
-Topic 505
-SubTopic 10
-Name Accounting Standards Codification
-Section 50
-Paragraph 13
-Subparagraph (a)
-Publisher FASB
-URI https://asc.fasb.org//1943274/2147481112/505-10-50-13
Reference 2: http://fasb.org/us-gaap/role/ref/legacyRef
-Topic 210
-SubTopic 10
-Name Accounting Standards Codification
-Section S99
-Paragraph 1
-Subparagraph (SX 210.5-02(28))
-Publisher FASB
-URI https://asc.fasb.org//1943274/2147480566/210-10-S99-1
| Name: |
us-gaap_PreferredStockSharesIssued |
| Namespace Prefix: |
us-gaap_ |
| Data Type: |
xbrli:sharesItemType |
| Balance Type: |
na |
| Period Type: |
instant |
|
| X |
- DefinitionAggregate share number for all nonredeemable preferred stock (or preferred stock redeemable solely at the option of the issuer) held by stockholders. Does not include preferred shares that have been repurchased. Reference 1: http://www.xbrl.org/2003/role/disclosureRef
-Topic 946
-SubTopic 210
-Name Accounting Standards Codification
-Section S99
-Paragraph 2
-Subparagraph (SX 210.6-05(4))
-Publisher FASB
-URI https://asc.fasb.org//1943274/2147479617/946-210-S99-2
Reference 2: http://www.xbrl.org/2009/role/commonPracticeRef
-Topic 946
-SubTopic 220
-Name Accounting Standards Codification
-Section S99
-Paragraph 3
-Subparagraph (SX 210.6-09(4)(b))
-Publisher FASB
-URI https://asc.fasb.org//1943274/2147483575/946-220-S99-3
Reference 3: http://www.xbrl.org/2003/role/disclosureRef
-Topic 946
-SubTopic 210
-Name Accounting Standards Codification
-Section S99
-Paragraph 1
-Subparagraph (SX 210.6-04(16)(a))
-Publisher FASB
-URI https://asc.fasb.org//1943274/2147479617/946-210-S99-1
Reference 4: http://www.xbrl.org/2009/role/commonPracticeRef
-Topic 946
-SubTopic 220
-Name Accounting Standards Codification
-Section S99
-Paragraph 3
-Subparagraph (SX 210.6-09(7))
-Publisher FASB
-URI https://asc.fasb.org//1943274/2147483575/946-220-S99-3
Reference 5: http://fasb.org/us-gaap/role/ref/legacyRef
-Topic 210
-SubTopic 10
-Name Accounting Standards Codification
-Section S99
-Paragraph 1
-Subparagraph (SX 210.5-02(28))
-Publisher FASB
-URI https://asc.fasb.org//1943274/2147480566/210-10-S99-1
| Name: |
us-gaap_PreferredStockSharesOutstanding |
| Namespace Prefix: |
us-gaap_ |
| Data Type: |
xbrli:sharesItemType |
| Balance Type: |
na |
| Period Type: |
instant |
|
| X |
- References
+ Details
| Name: |
us-gaap_StatementOfFinancialPositionAbstract |
| Namespace Prefix: |
us-gaap_ |
| Data Type: |
xbrli:stringItemType |
| Balance Type: |
na |
| Period Type: |
duration |
|
v3.23.3
Condensed Consolidated Statements of Operations and Comprehensive Loss (Unaudited) - USD ($)
|
3 Months Ended |
9 Months Ended |
Sep. 30, 2023 |
Sep. 30, 2022 |
Sep. 30, 2023 |
Sep. 30, 2022 |
| Income Statement [Abstract] |
|
|
|
|
| REVENUE |
$ 695,145
|
|
$ 1,813,426
|
|
| COST OF REVENUE |
(33,524)
|
|
(147,924)
|
|
| GROSS PROFIT |
661,621
|
|
1,665,502
|
|
| SELLING, GENERAL AND ADMINISTRATIVE EXPENSES |
(737,279)
|
(12,629)
|
(2,122,375)
|
(63,576)
|
| LOSS FROM OPERATIONS |
(75,658)
|
(12,629)
|
(456,873)
|
(63,576)
|
| OTHER INCOME |
1,377
|
2,646
|
8,963
|
9,161
|
| LOSS BEFORE INCOME TAX |
(74,281)
|
(9,983)
|
(447,910)
|
(54,415)
|
| INCOME TAX PROVISION |
(310)
|
(896)
|
29,409
|
(1,137)
|
| NET LOSS |
(74,591)
|
(10,879)
|
(418,501)
|
(55,552)
|
| Net income attributable to noncontrolling interest |
197
|
|
197
|
|
| NET LOSS ATTRIBUTED TO COMMON SHAREHOLDERS OF ASIAFIN HOLDINGS CORP. |
(74,394)
|
(10,879)
|
(418,304)
|
(55,552)
|
| Other comprehensive income: |
|
|
|
|
| - Foreign currency translation loss |
(8,636)
|
|
(84,294)
|
|
| TOTAL COMPREHENSIVE LOSS |
$ (83,030)
|
$ (10,879)
|
$ (502,598)
|
$ (55,552)
|
| NET LOSS PER SHARE, BASIC |
$ (0.00)
|
$ (0.00)
|
$ (0.01)
|
$ (0.00)
|
| NET LOSS PER SHARE, DILUTED |
$ (0.00)
|
$ (0.00)
|
$ (0.01)
|
$ (0.00)
|
| WEIGHTED AVERAGE NUMBER OF COMMON SHARES OUTSTANDING, BASIC |
81,551,838
|
73,319,800
|
|
73,319,800
|
| WEIGHTED AVERAGE NUMBER OF COMMON SHARES OUTSTANDING, DILUTED |
81,551,838
|
73,319,800
|
79,953,677
|
73,319,800
|
| X |
- DefinitionAmount after tax of increase (decrease) in equity from transactions and other events and circumstances from net income and other comprehensive income, attributable to parent entity. Excludes changes in equity resulting from investments by owners and distributions to owners. Reference 1: http://www.xbrl.org/2003/role/disclosureRef
-Topic 220
-SubTopic 10
-Name Accounting Standards Codification
-Section S99
-Paragraph 2
-Subparagraph (SX 210.5-03(24))
-Publisher FASB
-URI https://asc.fasb.org//1943274/2147483621/220-10-S99-2
Reference 2: http://www.xbrl.org/2003/role/disclosureRef
-Topic 942
-SubTopic 220
-Name Accounting Standards Codification
-Section S99
-Paragraph 1
-Subparagraph (SX 210.9-04(26))
-Publisher FASB
-URI https://asc.fasb.org//1943274/2147483589/942-220-S99-1
Reference 3: http://www.xbrl.org/2003/role/disclosureRef
-Topic 944
-SubTopic 220
-Name Accounting Standards Codification
-Section S99
-Paragraph 1
-Subparagraph (SX 210.7-04(22))
-Publisher FASB
-URI https://asc.fasb.org//1943274/2147483586/944-220-S99-1
Reference 4: http://www.xbrl.org/2003/role/disclosureRef
-Topic 220
-SubTopic 10
-Name Accounting Standards Codification
-Section 45
-Paragraph 1A
-Subparagraph (c)
-Publisher FASB
-URI https://asc.fasb.org//1943274/2147482790/220-10-45-1A
Reference 5: http://www.xbrl.org/2003/role/disclosureRef
-Topic 220
-SubTopic 10
-Name Accounting Standards Codification
-Section 45
-Paragraph 1B
-Subparagraph (b)
-Publisher FASB
-URI https://asc.fasb.org//1943274/2147482790/220-10-45-1B
Reference 6: http://fasb.org/us-gaap/role/ref/legacyRef
-Name Accounting Standards Codification
-Topic 220
-SubTopic 10
-Section 45
-Paragraph 5
-Publisher FASB
-URI https://asc.fasb.org//1943274/2147482790/220-10-45-5
| Name: |
us-gaap_ComprehensiveIncomeNetOfTax |
| Namespace Prefix: |
us-gaap_ |
| Data Type: |
xbrli:monetaryItemType |
| Balance Type: |
credit |
| Period Type: |
duration |
|
| X |
- DefinitionThe aggregate cost of goods produced and sold and services rendered during the reporting period. Reference 1: http://www.xbrl.org/2003/role/disclosureRef
-Topic 235
-SubTopic 10
-Name Accounting Standards Codification
-Section S99
-Paragraph 1
-Subparagraph (SX 210.4-08(g)(1)(ii))
-Publisher FASB
-URI https://asc.fasb.org//1943274/2147480678/235-10-S99-1
Reference 2: http://www.xbrl.org/2003/role/disclosureRef
-Topic 323
-SubTopic 10
-Name Accounting Standards Codification
-Section 50
-Paragraph 3
-Subparagraph (c)
-Publisher FASB
-URI https://asc.fasb.org//1943274/2147481687/323-10-50-3
Reference 3: http://www.xbrl.org/2003/role/disclosureRef
-Topic 825
-SubTopic 10
-Name Accounting Standards Codification
-Section 50
-Paragraph 28
-Subparagraph (f)
-Publisher FASB
-URI https://asc.fasb.org//1943274/2147482907/825-10-50-28
Reference 4: http://www.xbrl.org/2003/role/disclosureRef
-Topic 470
-SubTopic 10
-Name Accounting Standards Codification
-Section S99
-Paragraph 1A
-Subparagraph (SX 210.13-01(a)(4)(i))
-Publisher FASB
-URI https://asc.fasb.org//1943274/2147480097/470-10-S99-1A
Reference 5: http://www.xbrl.org/2009/role/commonPracticeRef
-Topic 470
-SubTopic 10
-Name Accounting Standards Codification
-Section S99
-Paragraph 1A
-Subparagraph (SX 210.13-01(a)(4)(ii))
-Publisher FASB
-URI https://asc.fasb.org//1943274/2147480097/470-10-S99-1A
Reference 6: http://www.xbrl.org/2003/role/disclosureRef
-Topic 470
-SubTopic 10
-Name Accounting Standards Codification
-Section S99
-Paragraph 1A
-Subparagraph (SX 210.13-01(a)(4)(iii)(A))
-Publisher FASB
-URI https://asc.fasb.org//1943274/2147480097/470-10-S99-1A
Reference 7: http://www.xbrl.org/2003/role/disclosureRef
-Topic 470
-SubTopic 10
-Name Accounting Standards Codification
-Section S99
-Paragraph 1A
-Subparagraph (SX 210.13-01(a)(4)(iv))
-Publisher FASB
-URI https://asc.fasb.org//1943274/2147480097/470-10-S99-1A
Reference 8: http://www.xbrl.org/2003/role/disclosureRef
-Topic 470
-SubTopic 10
-Name Accounting Standards Codification
-Section S99
-Paragraph 1A
-Subparagraph (SX 210.13-01(a)(5))
-Publisher FASB
-URI https://asc.fasb.org//1943274/2147480097/470-10-S99-1A
Reference 9: http://www.xbrl.org/2003/role/disclosureRef
-Topic 470
-SubTopic 10
-Name Accounting Standards Codification
-Section S99
-Paragraph 1B
-Subparagraph (SX 210.13-02(a)(4)(i))
-Publisher FASB
-URI https://asc.fasb.org//1943274/2147480097/470-10-S99-1B
Reference 10: http://www.xbrl.org/2003/role/disclosureRef
-Topic 470
-SubTopic 10
-Name Accounting Standards Codification
-Section S99
-Paragraph 1B
-Subparagraph (SX 210.13-02(a)(4)(iii)(A))
-Publisher FASB
-URI https://asc.fasb.org//1943274/2147480097/470-10-S99-1B
Reference 11: http://www.xbrl.org/2003/role/disclosureRef
-Topic 470
-SubTopic 10
-Name Accounting Standards Codification
-Section S99
-Paragraph 1B
-Subparagraph (SX 210.13-02(a)(4)(iii)(B))
-Publisher FASB
-URI https://asc.fasb.org//1943274/2147480097/470-10-S99-1B
Reference 12: http://www.xbrl.org/2003/role/disclosureRef
-Topic 470
-SubTopic 10
-Name Accounting Standards Codification
-Section S99
-Paragraph 1B
-Subparagraph (SX 210.13-02(a)(4)(iv))
-Publisher FASB
-URI https://asc.fasb.org//1943274/2147480097/470-10-S99-1B
Reference 13: http://www.xbrl.org/2003/role/disclosureRef
-Topic 470
-SubTopic 10
-Name Accounting Standards Codification
-Section S99
-Paragraph 1B
-Subparagraph (SX 210.13-02(a)(5))
-Publisher FASB
-URI https://asc.fasb.org//1943274/2147480097/470-10-S99-1B
Reference 14: http://fasb.org/us-gaap/role/ref/legacyRef
-Topic 220
-SubTopic 10
-Name Accounting Standards Codification
-Section S99
-Paragraph 2
-Subparagraph (SX 210.5-03.2)
-Publisher FASB
-URI https://asc.fasb.org//1943274/2147483621/220-10-S99-2
| Name: |
us-gaap_CostOfRevenue |
| Namespace Prefix: |
us-gaap_ |
| Data Type: |
xbrli:monetaryItemType |
| Balance Type: |
debit |
| Period Type: |
duration |
|
| X |
- DefinitionThe amount of net income (loss) for the period per each share of common stock or unit outstanding during the reporting period. Reference 1: http://www.xbrl.org/2003/role/disclosureRef
-Topic 250
-SubTopic 10
-Name Accounting Standards Codification
-Section 50
-Paragraph 3
-Publisher FASB
-URI https://asc.fasb.org//1943274/2147483443/250-10-50-3
Reference 2: http://www.xbrl.org/2003/role/disclosureRef
-Topic 260
-SubTopic 10
-Name Accounting Standards Codification
-Section 55
-Paragraph 15
-Publisher FASB
-URI https://asc.fasb.org//1943274/2147482635/260-10-55-15
Reference 3: http://www.xbrl.org/2003/role/disclosureRef
-Topic 815
-SubTopic 40
-Name Accounting Standards Codification
-Section 65
-Paragraph 1
-Subparagraph (e)(4)
-Publisher FASB
-URI https://asc.fasb.org//1943274/2147480175/815-40-65-1
Reference 4: http://www.xbrl.org/2003/role/disclosureRef
-Topic 815
-SubTopic 40
-Name Accounting Standards Codification
-Section 65
-Paragraph 1
-Subparagraph (f)
-Publisher FASB
-URI https://asc.fasb.org//1943274/2147480175/815-40-65-1
Reference 5: http://www.xbrl.org/2003/role/disclosureRef
-Topic 250
-SubTopic 10
-Name Accounting Standards Codification
-Section 50
-Paragraph 11
-Subparagraph (a)
-Publisher FASB
-URI https://asc.fasb.org//1943274/2147483443/250-10-50-11
Reference 6: http://www.xbrl.org/2003/role/disclosureRef
-Topic 250
-SubTopic 10
-Name Accounting Standards Codification
-Section 50
-Paragraph 11
-Subparagraph (b)
-Publisher FASB
-URI https://asc.fasb.org//1943274/2147483443/250-10-50-11
Reference 7: http://www.xbrl.org/2003/role/disclosureRef
-Topic 250
-SubTopic 10
-Name Accounting Standards Codification
-Section 50
-Paragraph 7
-Subparagraph (a)
-Publisher FASB
-URI https://asc.fasb.org//1943274/2147483443/250-10-50-7
Reference 8: http://www.xbrl.org/2003/role/disclosureRef
-Topic 260
-SubTopic 10
-Name Accounting Standards Codification
-Section 45
-Paragraph 2
-Publisher FASB
-URI https://asc.fasb.org//1943274/2147482689/260-10-45-2
Reference 9: http://www.xbrl.org/2003/role/disclosureRef
-Topic 260
-SubTopic 10
-Name Accounting Standards Codification
-Section 45
-Paragraph 60B
-Subparagraph (d)
-Publisher FASB
-URI https://asc.fasb.org//1943274/2147482689/260-10-45-60B
Reference 10: http://www.xbrl.org/2003/role/disclosureRef
-Topic 250
-SubTopic 10
-Name Accounting Standards Codification
-Section 50
-Paragraph 4
-Publisher FASB
-URI https://asc.fasb.org//1943274/2147483443/250-10-50-4
Reference 11: http://www.xbrl.org/2003/role/disclosureRef
-Topic 260
-SubTopic 10
-Name Accounting Standards Codification
-Section 50
-Paragraph 1
-Subparagraph (a)
-Publisher FASB
-URI https://asc.fasb.org//1943274/2147482662/260-10-50-1
Reference 12: http://www.xbrl.org/2003/role/disclosureRef
-Topic 260
-SubTopic 10
-Name Accounting Standards Codification
-Section 45
-Paragraph 10
-Publisher FASB
-URI https://asc.fasb.org//1943274/2147482689/260-10-45-10
Reference 13: http://www.xbrl.org/2003/role/disclosureRef
-Topic 220
-SubTopic 10
-Name Accounting Standards Codification
-Section S99
-Paragraph 2
-Subparagraph (SX 210.5-03(25))
-Publisher FASB
-URI https://asc.fasb.org//1943274/2147483621/220-10-S99-2
Reference 14: http://www.xbrl.org/2003/role/disclosureRef
-Topic 942
-SubTopic 220
-Name Accounting Standards Codification
-Section S99
-Paragraph 1
-Subparagraph (SX 210.9-04(27))
-Publisher FASB
-URI https://asc.fasb.org//1943274/2147483589/942-220-S99-1
Reference 15: http://www.xbrl.org/2003/role/disclosureRef
-Topic 944
-SubTopic 220
-Name Accounting Standards Codification
-Section S99
-Paragraph 1
-Subparagraph (SX 210.7-04(23))
-Publisher FASB
-URI https://asc.fasb.org//1943274/2147483586/944-220-S99-1
Reference 16: http://www.xbrl.org/2003/role/exampleRef
-Topic 260
-SubTopic 10
-Name Accounting Standards Codification
-Section 55
-Paragraph 52
-Publisher FASB
-URI https://asc.fasb.org//1943274/2147482635/260-10-55-52
Reference 17: http://www.xbrl.org/2003/role/disclosureRef
-Topic 260
-SubTopic 10
-Name Accounting Standards Codification
-Section 45
-Paragraph 7
-Publisher FASB
-URI https://asc.fasb.org//1943274/2147482689/260-10-45-7
| Name: |
us-gaap_EarningsPerShareBasic |
| Namespace Prefix: |
us-gaap_ |
| Data Type: |
dtr-types:perShareItemType |
| Balance Type: |
na |
| Period Type: |
duration |
|
| X |
- DefinitionThe amount of net income (loss) for the period available to each share of common stock or common unit outstanding during the reporting period and to each share or unit that would have been outstanding assuming the issuance of common shares or units for all dilutive potential common shares or units outstanding during the reporting period. Reference 1: http://www.xbrl.org/2003/role/disclosureRef
-Topic 250
-SubTopic 10
-Name Accounting Standards Codification
-Section 50
-Paragraph 3
-Publisher FASB
-URI https://asc.fasb.org//1943274/2147483443/250-10-50-3
Reference 2: http://www.xbrl.org/2003/role/disclosureRef
-Topic 260
-SubTopic 10
-Name Accounting Standards Codification
-Section 55
-Paragraph 15
-Publisher FASB
-URI https://asc.fasb.org//1943274/2147482635/260-10-55-15
Reference 3: http://www.xbrl.org/2003/role/disclosureRef
-Topic 815
-SubTopic 40
-Name Accounting Standards Codification
-Section 65
-Paragraph 1
-Subparagraph (e)(4)
-Publisher FASB
-URI https://asc.fasb.org//1943274/2147480175/815-40-65-1
Reference 4: http://www.xbrl.org/2003/role/disclosureRef
-Topic 815
-SubTopic 40
-Name Accounting Standards Codification
-Section 65
-Paragraph 1
-Subparagraph (f)
-Publisher FASB
-URI https://asc.fasb.org//1943274/2147480175/815-40-65-1
Reference 5: http://www.xbrl.org/2003/role/disclosureRef
-Topic 250
-SubTopic 10
-Name Accounting Standards Codification
-Section 50
-Paragraph 11
-Subparagraph (a)
-Publisher FASB
-URI https://asc.fasb.org//1943274/2147483443/250-10-50-11
Reference 6: http://www.xbrl.org/2003/role/disclosureRef
-Topic 250
-SubTopic 10
-Name Accounting Standards Codification
-Section 50
-Paragraph 11
-Subparagraph (b)
-Publisher FASB
-URI https://asc.fasb.org//1943274/2147483443/250-10-50-11
Reference 7: http://www.xbrl.org/2003/role/disclosureRef
-Topic 250
-SubTopic 10
-Name Accounting Standards Codification
-Section 50
-Paragraph 7
-Subparagraph (a)
-Publisher FASB
-URI https://asc.fasb.org//1943274/2147483443/250-10-50-7
Reference 8: http://www.xbrl.org/2003/role/disclosureRef
-Topic 260
-SubTopic 10
-Name Accounting Standards Codification
-Section 45
-Paragraph 2
-Publisher FASB
-URI https://asc.fasb.org//1943274/2147482689/260-10-45-2
Reference 9: http://www.xbrl.org/2003/role/disclosureRef
-Topic 260
-SubTopic 10
-Name Accounting Standards Codification
-Section 45
-Paragraph 60B
-Subparagraph (d)
-Publisher FASB
-URI https://asc.fasb.org//1943274/2147482689/260-10-45-60B
Reference 10: http://www.xbrl.org/2003/role/disclosureRef
-Topic 250
-SubTopic 10
-Name Accounting Standards Codification
-Section 50
-Paragraph 4
-Publisher FASB
-URI https://asc.fasb.org//1943274/2147483443/250-10-50-4
Reference 11: http://www.xbrl.org/2003/role/disclosureRef
-Topic 260
-SubTopic 10
-Name Accounting Standards Codification
-Section 50
-Paragraph 1
-Subparagraph (a)
-Publisher FASB
-URI https://asc.fasb.org//1943274/2147482662/260-10-50-1
Reference 12: http://www.xbrl.org/2003/role/disclosureRef
-Topic 220
-SubTopic 10
-Name Accounting Standards Codification
-Section S99
-Paragraph 2
-Subparagraph (SX 210.5-03(25))
-Publisher FASB
-URI https://asc.fasb.org//1943274/2147483621/220-10-S99-2
Reference 13: http://www.xbrl.org/2003/role/disclosureRef
-Topic 942
-SubTopic 220
-Name Accounting Standards Codification
-Section S99
-Paragraph 1
-Subparagraph (SX 210.9-04(27))
-Publisher FASB
-URI https://asc.fasb.org//1943274/2147483589/942-220-S99-1
Reference 14: http://www.xbrl.org/2003/role/disclosureRef
-Topic 944
-SubTopic 220
-Name Accounting Standards Codification
-Section S99
-Paragraph 1
-Subparagraph (SX 210.7-04(23))
-Publisher FASB
-URI https://asc.fasb.org//1943274/2147483586/944-220-S99-1
Reference 15: http://www.xbrl.org/2003/role/exampleRef
-Topic 260
-SubTopic 10
-Name Accounting Standards Codification
-Section 55
-Paragraph 52
-Publisher FASB
-URI https://asc.fasb.org//1943274/2147482635/260-10-55-52
Reference 16: http://www.xbrl.org/2003/role/disclosureRef
-Topic 260
-SubTopic 10
-Name Accounting Standards Codification
-Section 45
-Paragraph 7
-Publisher FASB
-URI https://asc.fasb.org//1943274/2147482689/260-10-45-7
| Name: |
us-gaap_EarningsPerShareDiluted |
| Namespace Prefix: |
us-gaap_ |
| Data Type: |
dtr-types:perShareItemType |
| Balance Type: |
na |
| Period Type: |
duration |
|
| X |
- DefinitionAggregate revenue less cost of goods and services sold or operating expenses directly attributable to the revenue generation activity. Reference 1: http://www.xbrl.org/2003/role/disclosureRef
-Topic 235
-SubTopic 10
-Name Accounting Standards Codification
-Section S99
-Paragraph 1
-Subparagraph (SX 210.4-08(g)(1)(ii))
-Publisher FASB
-URI https://asc.fasb.org//1943274/2147480678/235-10-S99-1
Reference 2: http://www.xbrl.org/2003/role/disclosureRef
-Topic 323
-SubTopic 10
-Name Accounting Standards Codification
-Section 50
-Paragraph 3
-Subparagraph (c)
-Publisher FASB
-URI https://asc.fasb.org//1943274/2147481687/323-10-50-3
Reference 3: http://www.xbrl.org/2003/role/disclosureRef
-Topic 825
-SubTopic 10
-Name Accounting Standards Codification
-Section 50
-Paragraph 28
-Subparagraph (f)
-Publisher FASB
-URI https://asc.fasb.org//1943274/2147482907/825-10-50-28
Reference 4: http://www.xbrl.org/2003/role/disclosureRef
-Topic 280
-SubTopic 10
-Name Accounting Standards Codification
-Section 50
-Paragraph 22
-Publisher FASB
-URI https://asc.fasb.org//1943274/2147482810/280-10-50-22
Reference 5: http://www.xbrl.org/2003/role/disclosureRef
-Topic 470
-SubTopic 10
-Name Accounting Standards Codification
-Section S99
-Paragraph 1A
-Subparagraph (SX 210.13-01(a)(4)(i))
-Publisher FASB
-URI https://asc.fasb.org//1943274/2147480097/470-10-S99-1A
Reference 6: http://www.xbrl.org/2009/role/commonPracticeRef
-Topic 470
-SubTopic 10
-Name Accounting Standards Codification
-Section S99
-Paragraph 1A
-Subparagraph (SX 210.13-01(a)(4)(ii))
-Publisher FASB
-URI https://asc.fasb.org//1943274/2147480097/470-10-S99-1A
Reference 7: http://www.xbrl.org/2003/role/disclosureRef
-Topic 470
-SubTopic 10
-Name Accounting Standards Codification
-Section S99
-Paragraph 1A
-Subparagraph (SX 210.13-01(a)(4)(iii)(A))
-Publisher FASB
-URI https://asc.fasb.org//1943274/2147480097/470-10-S99-1A
Reference 8: http://www.xbrl.org/2003/role/disclosureRef
-Topic 470
-SubTopic 10
-Name Accounting Standards Codification
-Section S99
-Paragraph 1A
-Subparagraph (SX 210.13-01(a)(4)(iv))
-Publisher FASB
-URI https://asc.fasb.org//1943274/2147480097/470-10-S99-1A
Reference 9: http://www.xbrl.org/2003/role/disclosureRef
-Topic 470
-SubTopic 10
-Name Accounting Standards Codification
-Section S99
-Paragraph 1A
-Subparagraph (SX 210.13-01(a)(5))
-Publisher FASB
-URI https://asc.fasb.org//1943274/2147480097/470-10-S99-1A
Reference 10: http://www.xbrl.org/2003/role/disclosureRef
-Topic 470
-SubTopic 10
-Name Accounting Standards Codification
-Section S99
-Paragraph 1B
-Subparagraph (SX 210.13-02(a)(4)(i))
-Publisher FASB
-URI https://asc.fasb.org//1943274/2147480097/470-10-S99-1B
Reference 11: http://www.xbrl.org/2003/role/disclosureRef
-Topic 470
-SubTopic 10
-Name Accounting Standards Codification
-Section S99
-Paragraph 1B
-Subparagraph (SX 210.13-02(a)(4)(iii)(A))
-Publisher FASB
-URI https://asc.fasb.org//1943274/2147480097/470-10-S99-1B
Reference 12: http://www.xbrl.org/2003/role/disclosureRef
-Topic 470
-SubTopic 10
-Name Accounting Standards Codification
-Section S99
-Paragraph 1B
-Subparagraph (SX 210.13-02(a)(4)(iii)(B))
-Publisher FASB
-URI https://asc.fasb.org//1943274/2147480097/470-10-S99-1B
Reference 13: http://www.xbrl.org/2003/role/disclosureRef
-Topic 470
-SubTopic 10
-Name Accounting Standards Codification
-Section S99
-Paragraph 1B
-Subparagraph (SX 210.13-02(a)(4)(iv))
-Publisher FASB
-URI https://asc.fasb.org//1943274/2147480097/470-10-S99-1B
Reference 14: http://www.xbrl.org/2003/role/disclosureRef
-Topic 470
-SubTopic 10
-Name Accounting Standards Codification
-Section S99
-Paragraph 1B
-Subparagraph (SX 210.13-02(a)(5))
-Publisher FASB
-URI https://asc.fasb.org//1943274/2147480097/470-10-S99-1B
Reference 15: http://www.xbrl.org/2003/role/disclosureRef
-Topic 280
-SubTopic 10
-Name Accounting Standards Codification
-Section 50
-Paragraph 30
-Subparagraph (b)
-Publisher FASB
-URI https://asc.fasb.org//1943274/2147482810/280-10-50-30
Reference 16: http://www.xbrl.org/2003/role/disclosureRef
-Topic 280
-SubTopic 10
-Name Accounting Standards Codification
-Section 50
-Paragraph 32
-Subparagraph (f)
-Publisher FASB
-URI https://asc.fasb.org//1943274/2147482810/280-10-50-32
Reference 17: http://www.xbrl.org/2003/role/exampleRef
-Topic 280
-SubTopic 10
-Name Accounting Standards Codification
-Section 50
-Paragraph 31
-Publisher FASB
-URI https://asc.fasb.org//1943274/2147482810/280-10-50-31
Reference 18: http://www.xbrl.org/2003/role/disclosureRef
-Topic 280
-SubTopic 10
-Name Accounting Standards Codification
-Section 50
-Paragraph 32
-Subparagraph (c)
-Publisher FASB
-URI https://asc.fasb.org//1943274/2147482810/280-10-50-32
Reference 19: http://fasb.org/us-gaap/role/ref/legacyRef
-Topic 220
-SubTopic 10
-Name Accounting Standards Codification
-Section S99
-Paragraph 2
-Subparagraph (SX 210.5-03.1,2)
-Publisher FASB
-URI https://asc.fasb.org//1943274/2147483621/220-10-S99-2
| Name: |
us-gaap_GrossProfit |
| Namespace Prefix: |
us-gaap_ |
| Data Type: |
xbrli:monetaryItemType |
| Balance Type: |
credit |
| Period Type: |
duration |
|
| X |
- References
+ Details
| Name: |
us-gaap_IncomeStatementAbstract |
| Namespace Prefix: |
us-gaap_ |
| Data Type: |
xbrli:stringItemType |
| Balance Type: |
na |
| Period Type: |
duration |
|
| X |
- DefinitionThe portion of profit or loss for the period, net of income taxes, which is attributable to the parent. Reference 1: http://www.xbrl.org/2003/role/disclosureRef
-Topic 235
-SubTopic 10
-Name Accounting Standards Codification
-Section S99
-Paragraph 1
-Subparagraph (SX 210.4-08(g)(1)(ii))
-Publisher FASB
-URI https://asc.fasb.org//1943274/2147480678/235-10-S99-1
Reference 2: http://www.xbrl.org/2003/role/disclosureRef
-Topic 323
-SubTopic 10
-Name Accounting Standards Codification
-Section 50
-Paragraph 3
-Subparagraph (c)
-Publisher FASB
-URI https://asc.fasb.org//1943274/2147481687/323-10-50-3
Reference 3: http://www.xbrl.org/2003/role/disclosureRef
-Topic 825
-SubTopic 10
-Name Accounting Standards Codification
-Section 50
-Paragraph 28
-Subparagraph (f)
-Publisher FASB
-URI https://asc.fasb.org//1943274/2147482907/825-10-50-28
Reference 4: http://www.xbrl.org/2003/role/disclosureRef
-Topic 220
-SubTopic 10
-Name Accounting Standards Codification
-Section 50
-Paragraph 6
-Publisher FASB
-URI https://asc.fasb.org//1943274/2147482765/220-10-50-6
Reference 5: http://www.xbrl.org/2003/role/disclosureRef
-Topic 250
-SubTopic 10
-Name Accounting Standards Codification
-Section 50
-Paragraph 3
-Publisher FASB
-URI https://asc.fasb.org//1943274/2147483443/250-10-50-3
Reference 6: http://www.xbrl.org/2003/role/disclosureRef
-Topic 250
-SubTopic 10
-Name Accounting Standards Codification
-Section 50
-Paragraph 1
-Subparagraph (b)(2)
-Publisher FASB
-URI https://asc.fasb.org//1943274/2147483443/250-10-50-1
Reference 7: http://www.xbrl.org/2003/role/disclosureRef
-Topic 815
-SubTopic 40
-Name Accounting Standards Codification
-Section 65
-Paragraph 1
-Subparagraph (f)
-Publisher FASB
-URI https://asc.fasb.org//1943274/2147480175/815-40-65-1
Reference 8: http://www.xbrl.org/2003/role/disclosureRef
-Topic 250
-SubTopic 10
-Name Accounting Standards Codification
-Section 50
-Paragraph 8
-Publisher FASB
-URI https://asc.fasb.org//1943274/2147483443/250-10-50-8
Reference 9: http://www.xbrl.org/2003/role/disclosureRef
-Topic 250
-SubTopic 10
-Name Accounting Standards Codification
-Section 50
-Paragraph 9
-Publisher FASB
-URI https://asc.fasb.org//1943274/2147483443/250-10-50-9
Reference 10: http://www.xbrl.org/2003/role/disclosureRef
-Topic 250
-SubTopic 10
-Name Accounting Standards Codification
-Section 50
-Paragraph 11
-Subparagraph (a)
-Publisher FASB
-URI https://asc.fasb.org//1943274/2147483443/250-10-50-11
Reference 11: http://www.xbrl.org/2003/role/disclosureRef
-Topic 250
-SubTopic 10
-Name Accounting Standards Codification
-Section 50
-Paragraph 11
-Subparagraph (b)
-Publisher FASB
-URI https://asc.fasb.org//1943274/2147483443/250-10-50-11
Reference 12: http://www.xbrl.org/2003/role/disclosureRef
-Topic 250
-SubTopic 10
-Name Accounting Standards Codification
-Section 50
-Paragraph 4
-Publisher FASB
-URI https://asc.fasb.org//1943274/2147483443/250-10-50-4
Reference 13: http://www.xbrl.org/2003/role/exampleRef
-Topic 946
-SubTopic 830
-Name Accounting Standards Codification
-Section 55
-Paragraph 10
-Publisher FASB
-URI https://asc.fasb.org//1943274/2147480167/946-830-55-10
Reference 14: http://www.xbrl.org/2003/role/disclosureRef
-Topic 946
-SubTopic 220
-Name Accounting Standards Codification
-Section 45
-Paragraph 7
-Publisher FASB
-URI https://asc.fasb.org//1943274/2147483581/946-220-45-7
Reference 15: http://www.xbrl.org/2003/role/disclosureRef
-Topic 944
-SubTopic 220
-Name Accounting Standards Codification
-Section S99
-Paragraph 1
-Subparagraph (SX 210.7-04(18))
-Publisher FASB
-URI https://asc.fasb.org//1943274/2147483586/944-220-S99-1
Reference 16: http://www.xbrl.org/2003/role/disclosureRef
-Topic 280
-SubTopic 10
-Name Accounting Standards Codification
-Section 50
-Paragraph 22
-Publisher FASB
-URI https://asc.fasb.org//1943274/2147482810/280-10-50-22
Reference 17: http://www.xbrl.org/2003/role/disclosureRef
-Topic 946
-SubTopic 220
-Name Accounting Standards Codification
-Section S99
-Paragraph 1
-Subparagraph (SX 210.6-07(9))
-Publisher FASB
-URI https://asc.fasb.org//1943274/2147483575/946-220-S99-1
Reference 18: http://www.xbrl.org/2003/role/disclosureRef
-Topic 946
-SubTopic 220
-Name Accounting Standards Codification
-Section S99
-Paragraph 3
-Subparagraph (SX 210.6-09(1)(d))
-Publisher FASB
-URI https://asc.fasb.org//1943274/2147483575/946-220-S99-3
Reference 19: http://www.xbrl.org/2003/role/disclosureRef
-Topic 470
-SubTopic 10
-Name Accounting Standards Codification
-Section S99
-Paragraph 1A
-Subparagraph (SX 210.13-01(a)(4)(i))
-Publisher FASB
-URI https://asc.fasb.org//1943274/2147480097/470-10-S99-1A
Reference 20: http://www.xbrl.org/2009/role/commonPracticeRef
-Topic 470
-SubTopic 10
-Name Accounting Standards Codification
-Section S99
-Paragraph 1A
-Subparagraph (SX 210.13-01(a)(4)(ii))
-Publisher FASB
-URI https://asc.fasb.org//1943274/2147480097/470-10-S99-1A
Reference 21: http://www.xbrl.org/2003/role/disclosureRef
-Topic 470
-SubTopic 10
-Name Accounting Standards Codification
-Section S99
-Paragraph 1A
-Subparagraph (SX 210.13-01(a)(4)(iii)(A))
-Publisher FASB
-URI https://asc.fasb.org//1943274/2147480097/470-10-S99-1A
Reference 22: http://www.xbrl.org/2003/role/disclosureRef
-Topic 470
-SubTopic 10
-Name Accounting Standards Codification
-Section S99
-Paragraph 1A
-Subparagraph (SX 210.13-01(a)(4)(iv))
-Publisher FASB
-URI https://asc.fasb.org//1943274/2147480097/470-10-S99-1A
Reference 23: http://www.xbrl.org/2003/role/disclosureRef
-Topic 470
-SubTopic 10
-Name Accounting Standards Codification
-Section S99
-Paragraph 1A
-Subparagraph (SX 210.13-01(a)(5))
-Publisher FASB
-URI https://asc.fasb.org//1943274/2147480097/470-10-S99-1A
Reference 24: http://www.xbrl.org/2003/role/disclosureRef
-Topic 470
-SubTopic 10
-Name Accounting Standards Codification
-Section S99
-Paragraph 1B
-Subparagraph (SX 210.13-02(a)(4)(i))
-Publisher FASB
-URI https://asc.fasb.org//1943274/2147480097/470-10-S99-1B
Reference 25: http://www.xbrl.org/2003/role/disclosureRef
-Topic 470
-SubTopic 10
-Name Accounting Standards Codification
-Section S99
-Paragraph 1B
-Subparagraph (SX 210.13-02(a)(4)(iii)(A))
-Publisher FASB
-URI https://asc.fasb.org//1943274/2147480097/470-10-S99-1B
Reference 26: http://www.xbrl.org/2003/role/disclosureRef
-Topic 470
-SubTopic 10
-Name Accounting Standards Codification
-Section S99
-Paragraph 1B
-Subparagraph (SX 210.13-02(a)(4)(iii)(B))
-Publisher FASB
-URI https://asc.fasb.org//1943274/2147480097/470-10-S99-1B
Reference 27: http://www.xbrl.org/2003/role/disclosureRef
-Topic 470
-SubTopic 10
-Name Accounting Standards Codification
-Section S99
-Paragraph 1B
-Subparagraph (SX 210.13-02(a)(4)(iv))
-Publisher FASB
-URI https://asc.fasb.org//1943274/2147480097/470-10-S99-1B
Reference 28: http://www.xbrl.org/2003/role/disclosureRef
-Topic 470
-SubTopic 10
-Name Accounting Standards Codification
-Section S99
-Paragraph 1B
-Subparagraph (SX 210.13-02(a)(5))
-Publisher FASB
-URI https://asc.fasb.org//1943274/2147480097/470-10-S99-1B
Reference 29: http://www.xbrl.org/2003/role/disclosureRef
-Topic 280
-SubTopic 10
-Name Accounting Standards Codification
-Section 50
-Paragraph 30
-Subparagraph (b)
-Publisher FASB
-URI https://asc.fasb.org//1943274/2147482810/280-10-50-30
Reference 30: http://www.xbrl.org/2003/role/disclosureRef
-Topic 280
-SubTopic 10
-Name Accounting Standards Codification
-Section 50
-Paragraph 32
-Subparagraph (f)
-Publisher FASB
-URI https://asc.fasb.org//1943274/2147482810/280-10-50-32
Reference 31: http://www.xbrl.org/2003/role/disclosureRef
-Topic 260
-SubTopic 10
-Name Accounting Standards Codification
-Section 45
-Paragraph 60B
-Subparagraph (a)
-Publisher FASB
-URI https://asc.fasb.org//1943274/2147482689/260-10-45-60B
Reference 32: http://www.xbrl.org/2003/role/exampleRef
-Topic 280
-SubTopic 10
-Name Accounting Standards Codification
-Section 50
-Paragraph 31
-Publisher FASB
-URI https://asc.fasb.org//1943274/2147482810/280-10-50-31
Reference 33: http://www.xbrl.org/2003/role/disclosureRef
-Topic 280
-SubTopic 10
-Name Accounting Standards Codification
-Section 50
-Paragraph 32
-Subparagraph (c)
-Publisher FASB
-URI https://asc.fasb.org//1943274/2147482810/280-10-50-32
Reference 34: http://www.xbrl.org/2003/role/disclosureRef
-Topic 205
-SubTopic 20
-Name Accounting Standards Codification
-Section 50
-Paragraph 7
-Publisher FASB
-URI https://asc.fasb.org//1943274/2147483499/205-20-50-7
Reference 35: http://fasb.org/us-gaap/role/ref/legacyRef
-Topic 230
-SubTopic 10
-Name Accounting Standards Codification
-Section 45
-Paragraph 28
-Publisher FASB
-URI https://asc.fasb.org//1943274/2147482740/230-10-45-28
Reference 36: http://www.xbrl.org/2003/role/disclosureRef
-Topic 220
-SubTopic 10
-Name Accounting Standards Codification
-Section 45
-Paragraph 1A
-Subparagraph (a)
-Publisher FASB
-URI https://asc.fasb.org//1943274/2147482790/220-10-45-1A
Reference 37: http://www.xbrl.org/2003/role/disclosureRef
-Topic 220
-SubTopic 10
-Name Accounting Standards Codification
-Section 45
-Paragraph 1B
-Subparagraph (a)
-Publisher FASB
-URI https://asc.fasb.org//1943274/2147482790/220-10-45-1B
Reference 38: http://fasb.org/us-gaap/role/ref/legacyRef
-Topic 220
-SubTopic 10
-Name Accounting Standards Codification
-Section S99
-Paragraph 2
-Subparagraph (SX 210.5-03(20))
-Publisher FASB
-URI https://asc.fasb.org//1943274/2147483621/220-10-S99-2
Reference 39: http://fasb.org/us-gaap/role/ref/legacyRef
-Topic 942
-SubTopic 220
-Name Accounting Standards Codification
-Section S99
-Paragraph 1
-Subparagraph (SX 210.9-04(22))
-Publisher FASB
-URI https://asc.fasb.org//1943274/2147483589/942-220-S99-1
| Name: |
us-gaap_NetIncomeLoss |
| Namespace Prefix: |
us-gaap_ |
| Data Type: |
xbrli:monetaryItemType |
| Balance Type: |
credit |
| Period Type: |
duration |
|
| X |
- DefinitionAmount of Net Income (Loss) attributable to noncontrolling interest. Reference 1: http://www.xbrl.org/2003/role/disclosureRef
-Topic 250
-SubTopic 10
-Name Accounting Standards Codification
-Section 50
-Paragraph 8
-Publisher FASB
-URI https://asc.fasb.org//1943274/2147483443/250-10-50-8
Reference 2: http://www.xbrl.org/2003/role/disclosureRef
-Topic 250
-SubTopic 10
-Name Accounting Standards Codification
-Section 50
-Paragraph 9
-Publisher FASB
-URI https://asc.fasb.org//1943274/2147483443/250-10-50-9
Reference 3: http://www.xbrl.org/2003/role/disclosureRef
-Topic 944
-SubTopic 220
-Name Accounting Standards Codification
-Section S99
-Paragraph 1
-Subparagraph (SX 210.7-04(17))
-Publisher FASB
-URI https://asc.fasb.org//1943274/2147483586/944-220-S99-1
Reference 4: http://www.xbrl.org/2009/role/commonPracticeRef
-Topic 220
-SubTopic 10
-Name Accounting Standards Codification
-Section 50
-Paragraph 6
-Publisher FASB
-URI https://asc.fasb.org//1943274/2147482765/220-10-50-6
Reference 5: http://fasb.org/us-gaap/role/ref/legacyRef
-Topic 810
-SubTopic 10
-Name Accounting Standards Codification
-Section 50
-Paragraph 1A
-Subparagraph (a)(2)
-Publisher FASB
-URI https://asc.fasb.org//1943274/2147481203/810-10-50-1A
Reference 6: http://fasb.org/us-gaap/role/ref/legacyRef
-Name Accounting Standards Codification
-Topic 810
-SubTopic 10
-Section 55
-Paragraph 4J
-Publisher FASB
-URI https://asc.fasb.org//1943274/2147481175/810-10-55-4J
Reference 7: http://www.xbrl.org/2003/role/disclosureRef
-Topic 220
-SubTopic 10
-Name Accounting Standards Codification
-Section 45
-Paragraph 1A
-Subparagraph (a)
-Publisher FASB
-URI https://asc.fasb.org//1943274/2147482790/220-10-45-1A
Reference 8: http://www.xbrl.org/2003/role/disclosureRef
-Topic 220
-SubTopic 10
-Name Accounting Standards Codification
-Section 45
-Paragraph 1B
-Subparagraph (a)
-Publisher FASB
-URI https://asc.fasb.org//1943274/2147482790/220-10-45-1B
| Name: |
us-gaap_NetIncomeLossAttributableToNoncontrollingInterest |
| Namespace Prefix: |
us-gaap_ |
| Data Type: |
xbrli:monetaryItemType |
| Balance Type: |
debit |
| Period Type: |
duration |
|
| X |
- DefinitionThe net result for the period of deducting operating expenses from operating revenues. Reference 1: http://www.xbrl.org/2003/role/disclosureRef
-Topic 280
-SubTopic 10
-Name Accounting Standards Codification
-Section 50
-Paragraph 22
-Publisher FASB
-URI https://asc.fasb.org//1943274/2147482810/280-10-50-22
Reference 2: http://www.xbrl.org/2003/role/disclosureRef
-Topic 280
-SubTopic 10
-Name Accounting Standards Codification
-Section 50
-Paragraph 30
-Subparagraph (b)
-Publisher FASB
-URI https://asc.fasb.org//1943274/2147482810/280-10-50-30
Reference 3: http://www.xbrl.org/2003/role/disclosureRef
-Topic 280
-SubTopic 10
-Name Accounting Standards Codification
-Section 50
-Paragraph 32
-Subparagraph (f)
-Publisher FASB
-URI https://asc.fasb.org//1943274/2147482810/280-10-50-32
Reference 4: http://www.xbrl.org/2003/role/exampleRef
-Topic 280
-SubTopic 10
-Name Accounting Standards Codification
-Section 50
-Paragraph 31
-Publisher FASB
-URI https://asc.fasb.org//1943274/2147482810/280-10-50-31
Reference 5: http://www.xbrl.org/2003/role/disclosureRef
-Topic 280
-SubTopic 10
-Name Accounting Standards Codification
-Section 50
-Paragraph 32
-Subparagraph (c)
-Publisher FASB
-URI https://asc.fasb.org//1943274/2147482810/280-10-50-32
| Name: |
us-gaap_OperatingIncomeLoss |
| Namespace Prefix: |
us-gaap_ |
| Data Type: |
xbrli:monetaryItemType |
| Balance Type: |
credit |
| Period Type: |
duration |
|
| X |
- DefinitionAmount after tax and reclassification adjustments of gain (loss) on foreign currency translation adjustments, foreign currency transactions designated and effective as economic hedges of a net investment in a foreign entity and intra-entity foreign currency transactions that are of a long-term-investment nature, attributable to parent entity. Reference 1: http://fasb.org/us-gaap/role/ref/legacyRef
-Topic 810
-SubTopic 10
-Name Accounting Standards Codification
-Section 45
-Paragraph 19
-Publisher FASB
-URI https://asc.fasb.org//1943274/2147481231/810-10-45-19
Reference 2: http://fasb.org/us-gaap/role/ref/legacyRef
-Name Accounting Standards Codification
-Section 45
-Paragraph 20
-SubTopic 10
-Topic 810
-Publisher FASB
-URI https://asc.fasb.org//1943274/2147481231/810-10-45-20
Reference 3: http://fasb.org/us-gaap/role/ref/legacyRef
-Name Accounting Standards Codification
-Section 50
-Paragraph 1A
-Subparagraph (c)(3)
-SubTopic 10
-Topic 810
-Publisher FASB
-URI https://asc.fasb.org//1943274/2147481203/810-10-50-1A
| Name: |
us-gaap_OtherComprehensiveIncomeForeignCurrencyTransactionAndTranslationAdjustmentNetOfTaxPortionAttributableToParent |
| Namespace Prefix: |
us-gaap_ |
| Data Type: |
xbrli:monetaryItemType |
| Balance Type: |
credit |
| Period Type: |
duration |
|
| X |
- References
+ Details
| Name: |
us-gaap_OtherComprehensiveIncomeLossNetOfTaxPortionAttributableToParentAbstract |
| Namespace Prefix: |
us-gaap_ |
| Data Type: |
xbrli:stringItemType |
| Balance Type: |
na |
| Period Type: |
duration |
|
| X |
- DefinitionAmount of revenue and income classified as other. Reference 1: http://www.xbrl.org/2003/role/disclosureRef
-Topic 946
-SubTopic 320
-Name Accounting Standards Codification
-Section S99
-Paragraph 6
-Subparagraph (SX 210.12-14(Column E)(2))
-Publisher FASB
-URI https://asc.fasb.org//1943274/2147480032/946-320-S99-6
Reference 2: http://www.xbrl.org/2003/role/disclosureRef
-Topic 946
-SubTopic 320
-Name Accounting Standards Codification
-Section S99
-Paragraph 6
-Subparagraph (SX 210.12-14(Column E)(Footnote 4))
-Publisher FASB
-URI https://asc.fasb.org//1943274/2147480032/946-320-S99-6
Reference 3: http://www.xbrl.org/2003/role/disclosureRef
-Topic 946
-SubTopic 320
-Name Accounting Standards Codification
-Section S99
-Paragraph 6
-Subparagraph (SX 210.12-14(Column E)(Footnote 6)(b))
-Publisher FASB
-URI https://asc.fasb.org//1943274/2147480032/946-320-S99-6
Reference 4: http://www.xbrl.org/2003/role/disclosureRef
-Topic 944
-SubTopic 220
-Name Accounting Standards Codification
-Section S99
-Paragraph 1
-Subparagraph (SX 210.7-04(4))
-Publisher FASB
-URI https://asc.fasb.org//1943274/2147483586/944-220-S99-1
Reference 5: http://www.xbrl.org/2003/role/disclosureRef
-Topic 946
-SubTopic 220
-Name Accounting Standards Codification
-Section S99
-Paragraph 1
-Subparagraph (SX 210.6-07(1)(c))
-Publisher FASB
-URI https://asc.fasb.org//1943274/2147483575/946-220-S99-1
| Name: |
us-gaap_OtherIncome |
| Namespace Prefix: |
us-gaap_ |
| Data Type: |
xbrli:monetaryItemType |
| Balance Type: |
credit |
| Period Type: |
duration |
|
| X |
- DefinitionThe consolidated profit or loss for the period, net of income taxes, including the portion attributable to the noncontrolling interest. Reference 1: http://www.xbrl.org/2003/role/disclosureRef
-Topic 235
-SubTopic 10
-Name Accounting Standards Codification
-Section S99
-Paragraph 1
-Subparagraph (SX 210.4-08(g)(1)(ii))
-Publisher FASB
-URI https://asc.fasb.org//1943274/2147480678/235-10-S99-1
Reference 2: http://www.xbrl.org/2003/role/disclosureRef
-Topic 323
-SubTopic 10
-Name Accounting Standards Codification
-Section 50
-Paragraph 3
-Subparagraph (c)
-Publisher FASB
-URI https://asc.fasb.org//1943274/2147481687/323-10-50-3
Reference 3: http://www.xbrl.org/2003/role/disclosureRef
-Topic 825
-SubTopic 10
-Name Accounting Standards Codification
-Section 50
-Paragraph 28
-Subparagraph (f)
-Publisher FASB
-URI https://asc.fasb.org//1943274/2147482907/825-10-50-28
Reference 4: http://www.xbrl.org/2003/role/disclosureRef
-Topic 250
-SubTopic 10
-Name Accounting Standards Codification
-Section 50
-Paragraph 1
-Subparagraph (b)(2)
-Publisher FASB
-URI https://asc.fasb.org//1943274/2147483443/250-10-50-1
Reference 5: http://www.xbrl.org/2003/role/disclosureRef
-Topic 815
-SubTopic 40
-Name Accounting Standards Codification
-Section 65
-Paragraph 1
-Subparagraph (f)
-Publisher FASB
-URI https://asc.fasb.org//1943274/2147480175/815-40-65-1
Reference 6: http://www.xbrl.org/2003/role/disclosureRef
-Topic 250
-SubTopic 10
-Name Accounting Standards Codification
-Section 50
-Paragraph 8
-Publisher FASB
-URI https://asc.fasb.org//1943274/2147483443/250-10-50-8
Reference 7: http://www.xbrl.org/2003/role/disclosureRef
-Topic 250
-SubTopic 10
-Name Accounting Standards Codification
-Section 50
-Paragraph 9
-Publisher FASB
-URI https://asc.fasb.org//1943274/2147483443/250-10-50-9
Reference 8: http://www.xbrl.org/2003/role/exampleRef
-Topic 946
-SubTopic 830
-Name Accounting Standards Codification
-Section 55
-Paragraph 11
-Publisher FASB
-URI https://asc.fasb.org//1943274/2147480167/946-830-55-11
Reference 9: http://www.xbrl.org/2003/role/disclosureRef
-Topic 946
-SubTopic 205
-Name Accounting Standards Codification
-Section 45
-Paragraph 3
-Subparagraph (a)
-Publisher FASB
-URI https://asc.fasb.org//1943274/2147480767/946-205-45-3
Reference 10: http://www.xbrl.org/2003/role/disclosureRef
-Topic 946
-SubTopic 220
-Name Accounting Standards Codification
-Section 45
-Paragraph 7
-Publisher FASB
-URI https://asc.fasb.org//1943274/2147483581/946-220-45-7
Reference 11: http://www.xbrl.org/2003/role/disclosureRef
-Topic 944
-SubTopic 220
-Name Accounting Standards Codification
-Section S99
-Paragraph 1
-Subparagraph (SX 210.7-04(16))
-Publisher FASB
-URI https://asc.fasb.org//1943274/2147483586/944-220-S99-1
Reference 12: http://www.xbrl.org/2003/role/disclosureRef
-Topic 280
-SubTopic 10
-Name Accounting Standards Codification
-Section 50
-Paragraph 22
-Publisher FASB
-URI https://asc.fasb.org//1943274/2147482810/280-10-50-22
Reference 13: http://www.xbrl.org/2003/role/disclosureRef
-Topic 946
-SubTopic 220
-Name Accounting Standards Codification
-Section S99
-Paragraph 1
-Subparagraph (SX 210.6-07(9))
-Publisher FASB
-URI https://asc.fasb.org//1943274/2147483575/946-220-S99-1
Reference 14: http://www.xbrl.org/2003/role/disclosureRef
-Topic 946
-SubTopic 220
-Name Accounting Standards Codification
-Section S99
-Paragraph 3
-Subparagraph (SX 210.6-09(1)(d))
-Publisher FASB
-URI https://asc.fasb.org//1943274/2147483575/946-220-S99-3
Reference 15: http://www.xbrl.org/2003/role/disclosureRef
-Topic 810
-SubTopic 10
-Name Accounting Standards Codification
-Section 45
-Paragraph 19
-Publisher FASB
-URI https://asc.fasb.org//1943274/2147481231/810-10-45-19
Reference 16: http://www.xbrl.org/2009/role/commonPracticeRef
-Topic 220
-SubTopic 10
-Name Accounting Standards Codification
-Section 50
-Paragraph 6
-Publisher FASB
-URI https://asc.fasb.org//1943274/2147482765/220-10-50-6
Reference 17: http://www.xbrl.org/2003/role/disclosureRef
-Topic 470
-SubTopic 10
-Name Accounting Standards Codification
-Section S99
-Paragraph 1A
-Subparagraph (SX 210.13-01(a)(4)(i))
-Publisher FASB
-URI https://asc.fasb.org//1943274/2147480097/470-10-S99-1A
Reference 18: http://www.xbrl.org/2009/role/commonPracticeRef
-Topic 470
-SubTopic 10
-Name Accounting Standards Codification
-Section S99
-Paragraph 1A
-Subparagraph (SX 210.13-01(a)(4)(ii))
-Publisher FASB
-URI https://asc.fasb.org//1943274/2147480097/470-10-S99-1A
Reference 19: http://www.xbrl.org/2003/role/disclosureRef
-Topic 470
-SubTopic 10
-Name Accounting Standards Codification
-Section S99
-Paragraph 1A
-Subparagraph (SX 210.13-01(a)(4)(iii)(A))
-Publisher FASB
-URI https://asc.fasb.org//1943274/2147480097/470-10-S99-1A
Reference 20: http://www.xbrl.org/2003/role/disclosureRef
-Topic 470
-SubTopic 10
-Name Accounting Standards Codification
-Section S99
-Paragraph 1A
-Subparagraph (SX 210.13-01(a)(4)(iv))
-Publisher FASB
-URI https://asc.fasb.org//1943274/2147480097/470-10-S99-1A
Reference 21: http://www.xbrl.org/2003/role/disclosureRef
-Topic 470
-SubTopic 10
-Name Accounting Standards Codification
-Section S99
-Paragraph 1A
-Subparagraph (SX 210.13-01(a)(5))
-Publisher FASB
-URI https://asc.fasb.org//1943274/2147480097/470-10-S99-1A
Reference 22: http://www.xbrl.org/2003/role/disclosureRef
-Topic 470
-SubTopic 10
-Name Accounting Standards Codification
-Section S99
-Paragraph 1B
-Subparagraph (SX 210.13-02(a)(4)(i))
-Publisher FASB
-URI https://asc.fasb.org//1943274/2147480097/470-10-S99-1B
Reference 23: http://www.xbrl.org/2003/role/disclosureRef
-Topic 470
-SubTopic 10
-Name Accounting Standards Codification
-Section S99
-Paragraph 1B
-Subparagraph (SX 210.13-02(a)(4)(iii)(A))
-Publisher FASB
-URI https://asc.fasb.org//1943274/2147480097/470-10-S99-1B
Reference 24: http://www.xbrl.org/2003/role/disclosureRef
-Topic 470
-SubTopic 10
-Name Accounting Standards Codification
-Section S99
-Paragraph 1B
-Subparagraph (SX 210.13-02(a)(4)(iii)(B))
-Publisher FASB
-URI https://asc.fasb.org//1943274/2147480097/470-10-S99-1B
Reference 25: http://www.xbrl.org/2003/role/disclosureRef
-Topic 470
-SubTopic 10
-Name Accounting Standards Codification
-Section S99
-Paragraph 1B
-Subparagraph (SX 210.13-02(a)(4)(iv))
-Publisher FASB
-URI https://asc.fasb.org//1943274/2147480097/470-10-S99-1B
Reference 26: http://www.xbrl.org/2003/role/disclosureRef
-Topic 470
-SubTopic 10
-Name Accounting Standards Codification
-Section S99
-Paragraph 1B
-Subparagraph (SX 210.13-02(a)(5))
-Publisher FASB
-URI https://asc.fasb.org//1943274/2147480097/470-10-S99-1B
Reference 27: http://www.xbrl.org/2003/role/disclosureRef
-Topic 280
-SubTopic 10
-Name Accounting Standards Codification
-Section 50
-Paragraph 30
-Subparagraph (b)
-Publisher FASB
-URI https://asc.fasb.org//1943274/2147482810/280-10-50-30
Reference 28: http://www.xbrl.org/2003/role/disclosureRef
-Topic 280
-SubTopic 10
-Name Accounting Standards Codification
-Section 50
-Paragraph 32
-Subparagraph (f)
-Publisher FASB
-URI https://asc.fasb.org//1943274/2147482810/280-10-50-32
Reference 29: http://www.xbrl.org/2003/role/exampleRef
-Topic 280
-SubTopic 10
-Name Accounting Standards Codification
-Section 50
-Paragraph 31
-Publisher FASB
-URI https://asc.fasb.org//1943274/2147482810/280-10-50-31
Reference 30: http://www.xbrl.org/2003/role/disclosureRef
-Topic 280
-SubTopic 10
-Name Accounting Standards Codification
-Section 50
-Paragraph 32
-Subparagraph (c)
-Publisher FASB
-URI https://asc.fasb.org//1943274/2147482810/280-10-50-32
Reference 31: http://www.xbrl.org/2003/role/disclosureRef
-Topic 942
-SubTopic 235
-Name Accounting Standards Codification
-Section S99
-Paragraph 1
-Subparagraph (SX 210.9-05(b)(2))
-Publisher FASB
-URI https://asc.fasb.org//1943274/2147479557/942-235-S99-1
Reference 32: http://www.xbrl.org/2003/role/disclosureRef
-Topic 205
-SubTopic 20
-Name Accounting Standards Codification
-Section 50
-Paragraph 7
-Publisher FASB
-URI https://asc.fasb.org//1943274/2147483499/205-20-50-7
Reference 33: http://www.xbrl.org/2003/role/exampleRef
-Topic 810
-SubTopic 10
-Name Accounting Standards Codification
-Section 55
-Paragraph 4J
-Publisher FASB
-URI https://asc.fasb.org//1943274/2147481175/810-10-55-4J
Reference 34: http://www.xbrl.org/2003/role/exampleRef
-Topic 810
-SubTopic 10
-Name Accounting Standards Codification
-Section 55
-Paragraph 4K
-Publisher FASB
-URI https://asc.fasb.org//1943274/2147481175/810-10-55-4K
Reference 35: http://www.xbrl.org/2003/role/disclosureRef
-Topic 220
-SubTopic 10
-Name Accounting Standards Codification
-Section 45
-Paragraph 1A
-Subparagraph (a)
-Publisher FASB
-URI https://asc.fasb.org//1943274/2147482790/220-10-45-1A
Reference 36: http://www.xbrl.org/2003/role/disclosureRef
-Topic 220
-SubTopic 10
-Name Accounting Standards Codification
-Section 45
-Paragraph 1B
-Subparagraph (a)
-Publisher FASB
-URI https://asc.fasb.org//1943274/2147482790/220-10-45-1B
Reference 37: http://www.xbrl.org/2003/role/disclosureRef
-Topic 230
-SubTopic 10
-Name Accounting Standards Codification
-Section 45
-Paragraph 2
-Publisher FASB
-URI https://asc.fasb.org//1943274/2147482740/230-10-45-2
Reference 38: http://www.xbrl.org/2003/role/disclosureRef
-Topic 810
-SubTopic 10
-Name Accounting Standards Codification
-Section 50
-Paragraph 1A
-Subparagraph (a)(1)
-Publisher FASB
-URI https://asc.fasb.org//1943274/2147481203/810-10-50-1A
Reference 39: http://www.xbrl.org/2003/role/disclosureRef
-Topic 810
-SubTopic 10
-Name Accounting Standards Codification
-Section 50
-Paragraph 1A
-Subparagraph (c)(1)
-Publisher FASB
-URI https://asc.fasb.org//1943274/2147481203/810-10-50-1A
| Name: |
us-gaap_ProfitLoss |
| Namespace Prefix: |
us-gaap_ |
| Data Type: |
xbrli:monetaryItemType |
| Balance Type: |
credit |
| Period Type: |
duration |
|
| X |
- DefinitionAmount, excluding tax collected from customer, of revenue from satisfaction of performance obligation by transferring promised good or service to customer. Tax collected from customer is tax assessed by governmental authority that is both imposed on and concurrent with specific revenue-producing transaction, including, but not limited to, sales, use, value added and excise. Reference 1: http://www.xbrl.org/2003/role/disclosureRef
-Topic 924
-SubTopic 10
-Name Accounting Standards Codification
-Section S99
-Paragraph 1
-Subparagraph (SAB Topic 11.L)
-Publisher FASB
-URI https://asc.fasb.org//1943274/2147479941/924-10-S99-1
Reference 2: http://www.xbrl.org/2003/role/disclosureRef
-Topic 606
-SubTopic 10
-Name Accounting Standards Codification
-Section 50
-Paragraph 5
-Publisher FASB
-URI https://asc.fasb.org//1943274/2147479806/606-10-50-5
Reference 3: http://www.xbrl.org/2003/role/disclosureRef
-Topic 280
-SubTopic 10
-Name Accounting Standards Codification
-Section 50
-Paragraph 30
-Subparagraph (a)
-Publisher FASB
-URI https://asc.fasb.org//1943274/2147482810/280-10-50-30
Reference 4: http://www.xbrl.org/2003/role/disclosureRef
-Topic 280
-SubTopic 10
-Name Accounting Standards Codification
-Section 50
-Paragraph 42
-Publisher FASB
-URI https://asc.fasb.org//1943274/2147482810/280-10-50-42
Reference 5: http://www.xbrl.org/2003/role/disclosureRef
-Topic 280
-SubTopic 10
-Name Accounting Standards Codification
-Section 50
-Paragraph 22
-Subparagraph (b)
-Publisher FASB
-URI https://asc.fasb.org//1943274/2147482810/280-10-50-22
Reference 6: http://www.xbrl.org/2003/role/disclosureRef
-Topic 280
-SubTopic 10
-Name Accounting Standards Codification
-Section 50
-Paragraph 32
-Subparagraph (b)
-Publisher FASB
-URI https://asc.fasb.org//1943274/2147482810/280-10-50-32
Reference 7: http://www.xbrl.org/2003/role/disclosureRef
-Topic 280
-SubTopic 10
-Name Accounting Standards Codification
-Section 50
-Paragraph 40
-Publisher FASB
-URI https://asc.fasb.org//1943274/2147482810/280-10-50-40
Reference 8: http://www.xbrl.org/2003/role/disclosureRef
-Topic 280
-SubTopic 10
-Name Accounting Standards Codification
-Section 50
-Paragraph 22
-Subparagraph (a)
-Publisher FASB
-URI https://asc.fasb.org//1943274/2147482810/280-10-50-22
Reference 9: http://www.xbrl.org/2003/role/disclosureRef
-Topic 280
-SubTopic 10
-Name Accounting Standards Codification
-Section 50
-Paragraph 32
-Subparagraph (a)
-Publisher FASB
-URI https://asc.fasb.org//1943274/2147482810/280-10-50-32
Reference 10: http://www.xbrl.org/2003/role/disclosureRef
-Topic 280
-SubTopic 10
-Name Accounting Standards Codification
-Section 50
-Paragraph 41
-Subparagraph (a)
-Publisher FASB
-URI https://asc.fasb.org//1943274/2147482810/280-10-50-41
Reference 11: http://www.xbrl.org/2003/role/disclosureRef
-Topic 606
-SubTopic 10
-Name Accounting Standards Codification
-Section 50
-Paragraph 4
-Subparagraph (a)
-Publisher FASB
-URI https://asc.fasb.org//1943274/2147479806/606-10-50-4
| Name: |
us-gaap_RevenueFromContractWithCustomerExcludingAssessedTax |
| Namespace Prefix: |
us-gaap_ |
| Data Type: |
xbrli:monetaryItemType |
| Balance Type: |
credit |
| Period Type: |
duration |
|
| X |
- DefinitionThe aggregate total costs related to selling a firm's product and services, as well as all other general and administrative expenses. Direct selling expenses (for example, credit, warranty, and advertising) are expenses that can be directly linked to the sale of specific products. Indirect selling expenses are expenses that cannot be directly linked to the sale of specific products, for example telephone expenses, Internet, and postal charges. General and administrative expenses include salaries of non-sales personnel, rent, utilities, communication, etc. Reference 1: http://fasb.org/us-gaap/role/ref/legacyRef
-Topic 220
-SubTopic 10
-Name Accounting Standards Codification
-Section S99
-Paragraph 2
-Subparagraph (SX 210.5-03.4)
-Publisher FASB
-URI https://asc.fasb.org//1943274/2147483621/220-10-S99-2
| Name: |
us-gaap_SellingGeneralAndAdministrativeExpense |
| Namespace Prefix: |
us-gaap_ |
| Data Type: |
xbrli:monetaryItemType |
| Balance Type: |
debit |
| Period Type: |
duration |
|
| X |
- DefinitionThe average number of shares or units issued and outstanding that are used in calculating diluted EPS or earnings per unit (EPU), determined based on the timing of issuance of shares or units in the period. Reference 1: http://www.xbrl.org/2003/role/disclosureRef
-Topic 260
-SubTopic 10
-Name Accounting Standards Codification
-Section 50
-Paragraph 1
-Subparagraph (a)
-Publisher FASB
-URI https://asc.fasb.org//1943274/2147482662/260-10-50-1
Reference 2: http://www.xbrl.org/2003/role/disclosureRef
-Topic 260
-SubTopic 10
-Name Accounting Standards Codification
-Section 45
-Paragraph 16
-Publisher FASB
-URI https://asc.fasb.org//1943274/2147482689/260-10-45-16
| Name: |
us-gaap_WeightedAverageNumberOfDilutedSharesOutstanding |
| Namespace Prefix: |
us-gaap_ |
| Data Type: |
xbrli:sharesItemType |
| Balance Type: |
na |
| Period Type: |
duration |
|
| X |
- DefinitionNumber of [basic] shares or units, after adjustment for contingently issuable shares or units and other shares or units not deemed outstanding, determined by relating the portion of time within a reporting period that common shares or units have been outstanding to the total time in that period. Reference 1: http://www.xbrl.org/2003/role/disclosureRef
-Topic 260
-SubTopic 10
-Name Accounting Standards Codification
-Section 50
-Paragraph 1
-Subparagraph (a)
-Publisher FASB
-URI https://asc.fasb.org//1943274/2147482662/260-10-50-1
Reference 2: http://www.xbrl.org/2003/role/disclosureRef
-Topic 260
-SubTopic 10
-Name Accounting Standards Codification
-Section 45
-Paragraph 10
-Publisher FASB
-URI https://asc.fasb.org//1943274/2147482689/260-10-45-10
| Name: |
us-gaap_WeightedAverageNumberOfSharesOutstandingBasic |
| Namespace Prefix: |
us-gaap_ |
| Data Type: |
xbrli:sharesItemType |
| Balance Type: |
na |
| Period Type: |
duration |
|
v3.23.3
Condensed Consolidated Statement of Shareholders' Equity (Unaudited) - USD ($)
|
Common Stock [Member] |
Additional Paid-in Capital [Member] |
Retained Earnings [Member] |
AOCI Attributable to Parent [Member] |
Noncontrolling Interest [Member] |
Total |
| Balance at Dec. 31, 2021 |
$ 7,332
|
$ 1,413,268
|
$ (451,870)
|
|
|
$ 968,730
|
| Balance, shares at Dec. 31, 2021 |
73,319,800
|
|
|
|
|
|
| Net loss for the period |
|
|
(6,365)
|
|
|
(6,365)
|
| Balance at Mar. 31, 2022 |
$ 7,332
|
1,413,268
|
(458,235)
|
|
|
962,365
|
| Balance, shares at Mar. 31, 2022 |
73,319,800
|
|
|
|
|
|
| Balance at Dec. 31, 2021 |
$ 7,332
|
1,413,268
|
(451,870)
|
|
|
968,730
|
| Balance, shares at Dec. 31, 2021 |
73,319,800
|
|
|
|
|
|
| Net loss for the period |
|
|
|
|
|
(55,552)
|
| Balance at Sep. 30, 2022 |
$ 7,332
|
1,413,268
|
(507,422)
|
|
|
913,178
|
| Balance, shares at Sep. 30, 2022 |
73,319,800
|
|
|
|
|
|
| Balance at Mar. 31, 2022 |
$ 7,332
|
1,413,268
|
(458,235)
|
|
|
962,365
|
| Balance, shares at Mar. 31, 2022 |
73,319,800
|
|
|
|
|
|
| Net loss for the period |
|
|
(38,308)
|
|
|
(38,308)
|
| Balance at Jun. 30, 2022 |
$ 7,332
|
1,413,268
|
(496,543)
|
|
|
924,057
|
| Balance, shares at Jun. 30, 2022 |
73,319,800
|
|
|
|
|
|
| Net loss for the period |
|
|
(10,879)
|
|
|
(10,879)
|
| Balance at Sep. 30, 2022 |
$ 7,332
|
1,413,268
|
(507,422)
|
|
|
913,178
|
| Balance, shares at Sep. 30, 2022 |
73,319,800
|
|
|
|
|
|
| Balance at Dec. 31, 2022 |
$ 7,332
|
1,413,268
|
(564,072)
|
|
|
856,528
|
| Balance, shares at Dec. 31, 2022 |
73,319,800
|
|
|
|
|
|
| Issuance of share for acquisition of StarFIN Holdings Limited |
$ 823
|
9,054,419
|
(7,351,165)
|
(260,052)
|
|
1,444,025
|
| Issuance of share for acquisition of StarFIN Holdings Limited, shares |
8,232,038
|
|
|
|
|
|
| Foreign currency translation |
|
|
|
(4,653)
|
|
(4,653)
|
| Net loss for the period |
|
|
(334,636)
|
|
|
(334,636)
|
| Balance at Mar. 31, 2023 |
$ 8,155
|
10,467,687
|
(8,249,873)
|
(264,705)
|
|
1,961,264
|
| Balance, shares at Mar. 31, 2023 |
81,551,838
|
|
|
|
|
|
| Balance at Dec. 31, 2022 |
$ 7,332
|
1,413,268
|
(564,072)
|
|
|
856,528
|
| Balance, shares at Dec. 31, 2022 |
73,319,800
|
|
|
|
|
|
| Net loss for the period |
|
|
|
|
|
(418,501)
|
| Balance at Sep. 30, 2023 |
$ 8,155
|
10,467,687
|
(8,333,541)
|
(344,346)
|
(197)
|
1,797,758
|
| Balance, shares at Sep. 30, 2023 |
81,551,838
|
|
|
|
|
|
| Balance at Mar. 31, 2023 |
$ 8,155
|
10,467,687
|
(8,249,873)
|
(264,705)
|
|
1,961,264
|
| Balance, shares at Mar. 31, 2023 |
81,551,838
|
|
|
|
|
|
| Foreign currency translation |
|
|
|
(71,005)
|
|
(71,005)
|
| Net loss for the period |
|
|
(9,274)
|
|
|
(9,274)
|
| Balance at Jun. 30, 2023 |
$ 8,155
|
10,467,687
|
(8,259,147)
|
(335,710)
|
|
1,880,985
|
| Balance, shares at Jun. 30, 2023 |
81,551,838
|
|
|
|
|
|
| Foreign currency translation |
|
|
|
(8,636)
|
|
(8,636)
|
| Net loss for the period |
|
|
(74,394)
|
|
(197)
|
(74,591)
|
| Balance at Sep. 30, 2023 |
$ 8,155
|
$ 10,467,687
|
$ (8,333,541)
|
$ (344,346)
|
$ (197)
|
$ 1,797,758
|
| Balance, shares at Sep. 30, 2023 |
81,551,838
|
|
|
|
|
|
| X |
- DefinitionAmount before tax, after reclassification adjustments of gain (loss) on foreign currency translation adjustments, foreign currency transactions designated and effective as economic hedges of a net investment in a foreign entity and intra-entity foreign currency transactions that are of a long-term-investment nature. Reference 1: http://fasb.org/us-gaap/role/ref/legacyRef
-Name Accounting Standards Codification
-Section 45
-Paragraph 10A
-Subparagraph (a)
-SubTopic 10
-Topic 220
-Publisher FASB
-URI https://asc.fasb.org//1943274/2147482790/220-10-45-10A
Reference 2: http://fasb.org/us-gaap/role/ref/legacyRef
-Topic 220
-SubTopic 10
-Name Accounting Standards Codification
-Section 45
-Paragraph 11
-Publisher FASB
-URI https://asc.fasb.org//1943274/2147482790/220-10-45-11
| Name: |
us-gaap_OtherComprehensiveIncomeLossForeignCurrencyTransactionAndTranslationAdjustmentBeforeTax |
| Namespace Prefix: |
us-gaap_ |
| Data Type: |
xbrli:monetaryItemType |
| Balance Type: |
credit |
| Period Type: |
duration |
|
| X |
- DefinitionThe consolidated profit or loss for the period, net of income taxes, including the portion attributable to the noncontrolling interest. Reference 1: http://www.xbrl.org/2003/role/disclosureRef
-Topic 235
-SubTopic 10
-Name Accounting Standards Codification
-Section S99
-Paragraph 1
-Subparagraph (SX 210.4-08(g)(1)(ii))
-Publisher FASB
-URI https://asc.fasb.org//1943274/2147480678/235-10-S99-1
Reference 2: http://www.xbrl.org/2003/role/disclosureRef
-Topic 323
-SubTopic 10
-Name Accounting Standards Codification
-Section 50
-Paragraph 3
-Subparagraph (c)
-Publisher FASB
-URI https://asc.fasb.org//1943274/2147481687/323-10-50-3
Reference 3: http://www.xbrl.org/2003/role/disclosureRef
-Topic 825
-SubTopic 10
-Name Accounting Standards Codification
-Section 50
-Paragraph 28
-Subparagraph (f)
-Publisher FASB
-URI https://asc.fasb.org//1943274/2147482907/825-10-50-28
Reference 4: http://www.xbrl.org/2003/role/disclosureRef
-Topic 250
-SubTopic 10
-Name Accounting Standards Codification
-Section 50
-Paragraph 1
-Subparagraph (b)(2)
-Publisher FASB
-URI https://asc.fasb.org//1943274/2147483443/250-10-50-1
Reference 5: http://www.xbrl.org/2003/role/disclosureRef
-Topic 815
-SubTopic 40
-Name Accounting Standards Codification
-Section 65
-Paragraph 1
-Subparagraph (f)
-Publisher FASB
-URI https://asc.fasb.org//1943274/2147480175/815-40-65-1
Reference 6: http://www.xbrl.org/2003/role/disclosureRef
-Topic 250
-SubTopic 10
-Name Accounting Standards Codification
-Section 50
-Paragraph 8
-Publisher FASB
-URI https://asc.fasb.org//1943274/2147483443/250-10-50-8
Reference 7: http://www.xbrl.org/2003/role/disclosureRef
-Topic 250
-SubTopic 10
-Name Accounting Standards Codification
-Section 50
-Paragraph 9
-Publisher FASB
-URI https://asc.fasb.org//1943274/2147483443/250-10-50-9
Reference 8: http://www.xbrl.org/2003/role/exampleRef
-Topic 946
-SubTopic 830
-Name Accounting Standards Codification
-Section 55
-Paragraph 11
-Publisher FASB
-URI https://asc.fasb.org//1943274/2147480167/946-830-55-11
Reference 9: http://www.xbrl.org/2003/role/disclosureRef
-Topic 946
-SubTopic 205
-Name Accounting Standards Codification
-Section 45
-Paragraph 3
-Subparagraph (a)
-Publisher FASB
-URI https://asc.fasb.org//1943274/2147480767/946-205-45-3
Reference 10: http://www.xbrl.org/2003/role/disclosureRef
-Topic 946
-SubTopic 220
-Name Accounting Standards Codification
-Section 45
-Paragraph 7
-Publisher FASB
-URI https://asc.fasb.org//1943274/2147483581/946-220-45-7
Reference 11: http://www.xbrl.org/2003/role/disclosureRef
-Topic 944
-SubTopic 220
-Name Accounting Standards Codification
-Section S99
-Paragraph 1
-Subparagraph (SX 210.7-04(16))
-Publisher FASB
-URI https://asc.fasb.org//1943274/2147483586/944-220-S99-1
Reference 12: http://www.xbrl.org/2003/role/disclosureRef
-Topic 280
-SubTopic 10
-Name Accounting Standards Codification
-Section 50
-Paragraph 22
-Publisher FASB
-URI https://asc.fasb.org//1943274/2147482810/280-10-50-22
Reference 13: http://www.xbrl.org/2003/role/disclosureRef
-Topic 946
-SubTopic 220
-Name Accounting Standards Codification
-Section S99
-Paragraph 1
-Subparagraph (SX 210.6-07(9))
-Publisher FASB
-URI https://asc.fasb.org//1943274/2147483575/946-220-S99-1
Reference 14: http://www.xbrl.org/2003/role/disclosureRef
-Topic 946
-SubTopic 220
-Name Accounting Standards Codification
-Section S99
-Paragraph 3
-Subparagraph (SX 210.6-09(1)(d))
-Publisher FASB
-URI https://asc.fasb.org//1943274/2147483575/946-220-S99-3
Reference 15: http://www.xbrl.org/2003/role/disclosureRef
-Topic 810
-SubTopic 10
-Name Accounting Standards Codification
-Section 45
-Paragraph 19
-Publisher FASB
-URI https://asc.fasb.org//1943274/2147481231/810-10-45-19
Reference 16: http://www.xbrl.org/2009/role/commonPracticeRef
-Topic 220
-SubTopic 10
-Name Accounting Standards Codification
-Section 50
-Paragraph 6
-Publisher FASB
-URI https://asc.fasb.org//1943274/2147482765/220-10-50-6
Reference 17: http://www.xbrl.org/2003/role/disclosureRef
-Topic 470
-SubTopic 10
-Name Accounting Standards Codification
-Section S99
-Paragraph 1A
-Subparagraph (SX 210.13-01(a)(4)(i))
-Publisher FASB
-URI https://asc.fasb.org//1943274/2147480097/470-10-S99-1A
Reference 18: http://www.xbrl.org/2009/role/commonPracticeRef
-Topic 470
-SubTopic 10
-Name Accounting Standards Codification
-Section S99
-Paragraph 1A
-Subparagraph (SX 210.13-01(a)(4)(ii))
-Publisher FASB
-URI https://asc.fasb.org//1943274/2147480097/470-10-S99-1A
Reference 19: http://www.xbrl.org/2003/role/disclosureRef
-Topic 470
-SubTopic 10
-Name Accounting Standards Codification
-Section S99
-Paragraph 1A
-Subparagraph (SX 210.13-01(a)(4)(iii)(A))
-Publisher FASB
-URI https://asc.fasb.org//1943274/2147480097/470-10-S99-1A
Reference 20: http://www.xbrl.org/2003/role/disclosureRef
-Topic 470
-SubTopic 10
-Name Accounting Standards Codification
-Section S99
-Paragraph 1A
-Subparagraph (SX 210.13-01(a)(4)(iv))
-Publisher FASB
-URI https://asc.fasb.org//1943274/2147480097/470-10-S99-1A
Reference 21: http://www.xbrl.org/2003/role/disclosureRef
-Topic 470
-SubTopic 10
-Name Accounting Standards Codification
-Section S99
-Paragraph 1A
-Subparagraph (SX 210.13-01(a)(5))
-Publisher FASB
-URI https://asc.fasb.org//1943274/2147480097/470-10-S99-1A
Reference 22: http://www.xbrl.org/2003/role/disclosureRef
-Topic 470
-SubTopic 10
-Name Accounting Standards Codification
-Section S99
-Paragraph 1B
-Subparagraph (SX 210.13-02(a)(4)(i))
-Publisher FASB
-URI https://asc.fasb.org//1943274/2147480097/470-10-S99-1B
Reference 23: http://www.xbrl.org/2003/role/disclosureRef
-Topic 470
-SubTopic 10
-Name Accounting Standards Codification
-Section S99
-Paragraph 1B
-Subparagraph (SX 210.13-02(a)(4)(iii)(A))
-Publisher FASB
-URI https://asc.fasb.org//1943274/2147480097/470-10-S99-1B
Reference 24: http://www.xbrl.org/2003/role/disclosureRef
-Topic 470
-SubTopic 10
-Name Accounting Standards Codification
-Section S99
-Paragraph 1B
-Subparagraph (SX 210.13-02(a)(4)(iii)(B))
-Publisher FASB
-URI https://asc.fasb.org//1943274/2147480097/470-10-S99-1B
Reference 25: http://www.xbrl.org/2003/role/disclosureRef
-Topic 470
-SubTopic 10
-Name Accounting Standards Codification
-Section S99
-Paragraph 1B
-Subparagraph (SX 210.13-02(a)(4)(iv))
-Publisher FASB
-URI https://asc.fasb.org//1943274/2147480097/470-10-S99-1B
Reference 26: http://www.xbrl.org/2003/role/disclosureRef
-Topic 470
-SubTopic 10
-Name Accounting Standards Codification
-Section S99
-Paragraph 1B
-Subparagraph (SX 210.13-02(a)(5))
-Publisher FASB
-URI https://asc.fasb.org//1943274/2147480097/470-10-S99-1B
Reference 27: http://www.xbrl.org/2003/role/disclosureRef
-Topic 280
-SubTopic 10
-Name Accounting Standards Codification
-Section 50
-Paragraph 30
-Subparagraph (b)
-Publisher FASB
-URI https://asc.fasb.org//1943274/2147482810/280-10-50-30
Reference 28: http://www.xbrl.org/2003/role/disclosureRef
-Topic 280
-SubTopic 10
-Name Accounting Standards Codification
-Section 50
-Paragraph 32
-Subparagraph (f)
-Publisher FASB
-URI https://asc.fasb.org//1943274/2147482810/280-10-50-32
Reference 29: http://www.xbrl.org/2003/role/exampleRef
-Topic 280
-SubTopic 10
-Name Accounting Standards Codification
-Section 50
-Paragraph 31
-Publisher FASB
-URI https://asc.fasb.org//1943274/2147482810/280-10-50-31
Reference 30: http://www.xbrl.org/2003/role/disclosureRef
-Topic 280
-SubTopic 10
-Name Accounting Standards Codification
-Section 50
-Paragraph 32
-Subparagraph (c)
-Publisher FASB
-URI https://asc.fasb.org//1943274/2147482810/280-10-50-32
Reference 31: http://www.xbrl.org/2003/role/disclosureRef
-Topic 942
-SubTopic 235
-Name Accounting Standards Codification
-Section S99
-Paragraph 1
-Subparagraph (SX 210.9-05(b)(2))
-Publisher FASB
-URI https://asc.fasb.org//1943274/2147479557/942-235-S99-1
Reference 32: http://www.xbrl.org/2003/role/disclosureRef
-Topic 205
-SubTopic 20
-Name Accounting Standards Codification
-Section 50
-Paragraph 7
-Publisher FASB
-URI https://asc.fasb.org//1943274/2147483499/205-20-50-7
Reference 33: http://www.xbrl.org/2003/role/exampleRef
-Topic 810
-SubTopic 10
-Name Accounting Standards Codification
-Section 55
-Paragraph 4J
-Publisher FASB
-URI https://asc.fasb.org//1943274/2147481175/810-10-55-4J
Reference 34: http://www.xbrl.org/2003/role/exampleRef
-Topic 810
-SubTopic 10
-Name Accounting Standards Codification
-Section 55
-Paragraph 4K
-Publisher FASB
-URI https://asc.fasb.org//1943274/2147481175/810-10-55-4K
Reference 35: http://www.xbrl.org/2003/role/disclosureRef
-Topic 220
-SubTopic 10
-Name Accounting Standards Codification
-Section 45
-Paragraph 1A
-Subparagraph (a)
-Publisher FASB
-URI https://asc.fasb.org//1943274/2147482790/220-10-45-1A
Reference 36: http://www.xbrl.org/2003/role/disclosureRef
-Topic 220
-SubTopic 10
-Name Accounting Standards Codification
-Section 45
-Paragraph 1B
-Subparagraph (a)
-Publisher FASB
-URI https://asc.fasb.org//1943274/2147482790/220-10-45-1B
Reference 37: http://www.xbrl.org/2003/role/disclosureRef
-Topic 230
-SubTopic 10
-Name Accounting Standards Codification
-Section 45
-Paragraph 2
-Publisher FASB
-URI https://asc.fasb.org//1943274/2147482740/230-10-45-2
Reference 38: http://www.xbrl.org/2003/role/disclosureRef
-Topic 810
-SubTopic 10
-Name Accounting Standards Codification
-Section 50
-Paragraph 1A
-Subparagraph (a)(1)
-Publisher FASB
-URI https://asc.fasb.org//1943274/2147481203/810-10-50-1A
Reference 39: http://www.xbrl.org/2003/role/disclosureRef
-Topic 810
-SubTopic 10
-Name Accounting Standards Codification
-Section 50
-Paragraph 1A
-Subparagraph (c)(1)
-Publisher FASB
-URI https://asc.fasb.org//1943274/2147481203/810-10-50-1A
| Name: |
us-gaap_ProfitLoss |
| Namespace Prefix: |
us-gaap_ |
| Data Type: |
xbrli:monetaryItemType |
| Balance Type: |
credit |
| Period Type: |
duration |
|
| X |
- DefinitionNumber of shares issued which are neither cancelled nor held in the treasury.
| Name: |
us-gaap_SharesOutstanding |
| Namespace Prefix: |
us-gaap_ |
| Data Type: |
xbrli:sharesItemType |
| Balance Type: |
na |
| Period Type: |
instant |
|
| X |
- DefinitionNumber of shares of stock issued during the period pursuant to acquisitions. Reference 1: http://fasb.org/us-gaap/role/ref/legacyRef
-Topic 210
-SubTopic 10
-Name Accounting Standards Codification
-Section S99
-Paragraph 1
-Subparagraph (SX 210.5-02(28))
-Publisher FASB
-URI https://asc.fasb.org//1943274/2147480566/210-10-S99-1
Reference 2: http://fasb.org/us-gaap/role/ref/legacyRef
-Topic 505
-SubTopic 10
-Name Accounting Standards Codification
-Section S99
-Paragraph 1
-Subparagraph (SX 210.3-04)
-Publisher FASB
-URI https://asc.fasb.org//1943274/2147480008/505-10-S99-1
Reference 3: http://fasb.org/us-gaap/role/ref/legacyRef
-Topic 210
-SubTopic 10
-Name Accounting Standards Codification
-Section S99
-Paragraph 1
-Subparagraph (SX 210.5-02(29))
-Publisher FASB
-URI https://asc.fasb.org//1943274/2147480566/210-10-S99-1
| Name: |
us-gaap_StockIssuedDuringPeriodSharesAcquisitions |
| Namespace Prefix: |
us-gaap_ |
| Data Type: |
xbrli:sharesItemType |
| Balance Type: |
na |
| Period Type: |
duration |
|
| X |
- DefinitionValue of stock issued pursuant to acquisitions during the period. Reference 1: http://fasb.org/us-gaap/role/ref/legacyRef
-Name Accounting Standards Codification
-Section 50
-Paragraph 2
-SubTopic 10
-Topic 505
-Publisher FASB
-URI https://asc.fasb.org//1943274/2147481112/505-10-50-2
Reference 2: http://fasb.org/us-gaap/role/ref/legacyRef
-Topic 505
-SubTopic 10
-Name Accounting Standards Codification
-Section S99
-Paragraph 1
-Subparagraph (SX 210.3-04)
-Publisher FASB
-URI https://asc.fasb.org//1943274/2147480008/505-10-S99-1
Reference 3: http://fasb.org/us-gaap/role/ref/legacyRef
-Name Accounting Standards Codification
-Topic 210
-SubTopic 10
-Section S99
-Paragraph 1
-Subparagraph (SX 210.5-02.29-31)
-Publisher FASB
-URI https://asc.fasb.org//1943274/2147480566/210-10-S99-1
| Name: |
us-gaap_StockIssuedDuringPeriodValueAcquisitions |
| Namespace Prefix: |
us-gaap_ |
| Data Type: |
xbrli:monetaryItemType |
| Balance Type: |
credit |
| Period Type: |
duration |
|
| X |
- DefinitionAmount of equity (deficit) attributable to parent and noncontrolling interest. Excludes temporary equity. Reference 1: http://www.xbrl.org/2003/role/disclosureRef
-Topic 250
-SubTopic 10
-Name Accounting Standards Codification
-Section 45
-Paragraph 24
-Publisher FASB
-URI https://asc.fasb.org//1943274/2147483421/250-10-45-24
Reference 2: http://www.xbrl.org/2003/role/disclosureRef
-Topic 250
-SubTopic 10
-Name Accounting Standards Codification
-Section 45
-Paragraph 23
-Subparagraph (b)
-Publisher FASB
-URI https://asc.fasb.org//1943274/2147483421/250-10-45-23
Reference 3: http://www.xbrl.org/2003/role/disclosureRef
-Topic 250
-SubTopic 10
-Name Accounting Standards Codification
-Section 45
-Paragraph 5
-Subparagraph (b)
-Publisher FASB
-URI https://asc.fasb.org//1943274/2147483421/250-10-45-5
Reference 4: http://www.xbrl.org/2003/role/disclosureRef
-Topic 326
-SubTopic 10
-Name Accounting Standards Codification
-Section 65
-Paragraph 5
-Subparagraph (c)(2)
-Publisher FASB
-URI https://asc.fasb.org//1943274/2147479654/326-10-65-5
Reference 5: http://www.xbrl.org/2003/role/disclosureRef
-Topic 815
-SubTopic 20
-Name Accounting Standards Codification
-Section 65
-Paragraph 6
-Subparagraph (e)
-Publisher FASB
-URI https://asc.fasb.org//1943274/2147480528/815-20-65-6
Reference 6: http://www.xbrl.org/2003/role/disclosureRef
-Topic 815
-SubTopic 20
-Name Accounting Standards Codification
-Section 65
-Paragraph 6
-Subparagraph (h)(1)
-Publisher FASB
-URI https://asc.fasb.org//1943274/2147480528/815-20-65-6
Reference 7: http://www.xbrl.org/2003/role/disclosureRef
-Topic 815
-SubTopic 20
-Name Accounting Standards Codification
-Section 65
-Paragraph 6
-Subparagraph (h)(1)(i)
-Publisher FASB
-URI https://asc.fasb.org//1943274/2147480528/815-20-65-6
Reference 8: http://www.xbrl.org/2003/role/disclosureRef
-Topic 815
-SubTopic 20
-Name Accounting Standards Codification
-Section 65
-Paragraph 6
-Subparagraph (h)(1)(iii)
-Publisher FASB
-URI https://asc.fasb.org//1943274/2147480528/815-20-65-6
Reference 9: http://www.xbrl.org/2003/role/disclosureRef
-Topic 815
-SubTopic 20
-Name Accounting Standards Codification
-Section 65
-Paragraph 6
-Subparagraph (h)(1)(iv)
-Publisher FASB
-URI https://asc.fasb.org//1943274/2147480528/815-20-65-6
Reference 10: http://www.xbrl.org/2003/role/disclosureRef
-Topic 815
-SubTopic 20
-Name Accounting Standards Codification
-Section 65
-Paragraph 6
-Subparagraph (i)(3)
-Publisher FASB
-URI https://asc.fasb.org//1943274/2147480528/815-20-65-6
Reference 11: http://www.xbrl.org/2003/role/disclosureRef
-Topic 848
-SubTopic 10
-Name Accounting Standards Codification
-Section 65
-Paragraph 2
-Subparagraph (a)(3)(iii)(03)
-Publisher FASB
-URI https://asc.fasb.org//1943274/2147483550/848-10-65-2
Reference 12: http://www.xbrl.org/2003/role/disclosureRef
-Topic 105
-SubTopic 10
-Name Accounting Standards Codification
-Section 65
-Paragraph 6
-Subparagraph (c)
-Publisher FASB
-URI https://asc.fasb.org//1943274/2147479343/105-10-65-6
Reference 13: http://www.xbrl.org/2003/role/disclosureRef
-Topic 105
-SubTopic 10
-Name Accounting Standards Codification
-Section 65
-Paragraph 6
-Subparagraph (d)
-Publisher FASB
-URI https://asc.fasb.org//1943274/2147479343/105-10-65-6
Reference 14: http://www.xbrl.org/2003/role/disclosureRef
-Topic 944
-SubTopic 40
-Name Accounting Standards Codification
-Section 65
-Paragraph 2
-Subparagraph (f)(1)
-Publisher FASB
-URI https://asc.fasb.org//1943274/2147480016/944-40-65-2
Reference 15: http://www.xbrl.org/2003/role/disclosureRef
-Topic 944
-SubTopic 40
-Name Accounting Standards Codification
-Section 65
-Paragraph 2
-Subparagraph (f)(2)
-Publisher FASB
-URI https://asc.fasb.org//1943274/2147480016/944-40-65-2
Reference 16: http://www.xbrl.org/2003/role/disclosureRef
-Topic 740
-SubTopic 10
-Name Accounting Standards Codification
-Section 65
-Paragraph 8
-Subparagraph (d)(2)
-Publisher FASB
-URI https://asc.fasb.org//1943274/2147482615/740-10-65-8
Reference 17: http://www.xbrl.org/2003/role/disclosureRef
-Topic 740
-SubTopic 10
-Name Accounting Standards Codification
-Section 65
-Paragraph 8
-Subparagraph (d)(3)
-Publisher FASB
-URI https://asc.fasb.org//1943274/2147482615/740-10-65-8
Reference 18: http://www.xbrl.org/2003/role/disclosureRef
-Topic 326
-SubTopic 10
-Name Accounting Standards Codification
-Section 65
-Paragraph 4
-Subparagraph (d)
-Publisher FASB
-URI https://asc.fasb.org//1943274/2147479654/326-10-65-4
Reference 19: http://www.xbrl.org/2003/role/disclosureRef
-Topic 718
-SubTopic 10
-Name Accounting Standards Codification
-Section 65
-Paragraph 15
-Subparagraph (e)
-Publisher FASB
-URI https://asc.fasb.org//1943274/2147480336/718-10-65-15
Reference 20: http://www.xbrl.org/2003/role/disclosureRef
-Topic 718
-SubTopic 10
-Name Accounting Standards Codification
-Section 65
-Paragraph 15
-Subparagraph (f)(1)
-Publisher FASB
-URI https://asc.fasb.org//1943274/2147480336/718-10-65-15
Reference 21: http://www.xbrl.org/2003/role/disclosureRef
-Topic 718
-SubTopic 10
-Name Accounting Standards Codification
-Section 65
-Paragraph 15
-Subparagraph (f)(2)
-Publisher FASB
-URI https://asc.fasb.org//1943274/2147480336/718-10-65-15
Reference 22: http://www.xbrl.org/2003/role/disclosureRef
-Topic 250
-SubTopic 10
-Name Accounting Standards Codification
-Section 50
-Paragraph 1
-Subparagraph (b)(3)
-Publisher FASB
-URI https://asc.fasb.org//1943274/2147483443/250-10-50-1
Reference 23: http://www.xbrl.org/2003/role/disclosureRef
-Topic 815
-SubTopic 40
-Name Accounting Standards Codification
-Section 65
-Paragraph 1
-Subparagraph (e)(3)
-Publisher FASB
-URI https://asc.fasb.org//1943274/2147480175/815-40-65-1
Reference 24: http://www.xbrl.org/2003/role/disclosureRef
-Topic 250
-SubTopic 10
-Name Accounting Standards Codification
-Section 50
-Paragraph 7
-Subparagraph (b)
-Publisher FASB
-URI https://asc.fasb.org//1943274/2147483443/250-10-50-7
Reference 25: http://www.xbrl.org/2003/role/disclosureRef
-Topic 220
-SubTopic 10
-Name Accounting Standards Codification
-Section 50
-Paragraph 5
-Publisher FASB
-URI https://asc.fasb.org//1943274/2147482765/220-10-50-5
Reference 26: http://www.xbrl.org/2003/role/disclosureRef
-Topic 830
-SubTopic 30
-Name Accounting Standards Codification
-Section 50
-Paragraph 1
-Publisher FASB
-URI https://asc.fasb.org//1943274/2147481674/830-30-50-1
Reference 27: http://www.xbrl.org/2003/role/disclosureRef
-Topic 830
-SubTopic 30
-Name Accounting Standards Codification
-Section 45
-Paragraph 17
-Publisher FASB
-URI https://asc.fasb.org//1943274/2147481694/830-30-45-17
Reference 28: http://www.xbrl.org/2003/role/disclosureRef
-Topic 830
-SubTopic 30
-Name Accounting Standards Codification
-Section 45
-Paragraph 20
-Subparagraph (a)
-Publisher FASB
-URI https://asc.fasb.org//1943274/2147481694/830-30-45-20
Reference 29: http://www.xbrl.org/2003/role/exampleRef
-Topic 946
-SubTopic 830
-Name Accounting Standards Codification
-Section 55
-Paragraph 11
-Publisher FASB
-URI https://asc.fasb.org//1943274/2147480167/946-830-55-11
Reference 30: http://www.xbrl.org/2003/role/disclosureRef
-Topic 946
-SubTopic 205
-Name Accounting Standards Codification
-Section 45
-Paragraph 3
-Publisher FASB
-URI https://asc.fasb.org//1943274/2147480767/946-205-45-3
Reference 31: http://www.xbrl.org/2003/role/disclosureRef
-Topic 946
-SubTopic 505
-Name Accounting Standards Codification
-Section 50
-Paragraph 3
-Publisher FASB
-URI https://asc.fasb.org//1943274/2147481004/946-505-50-3
Reference 32: http://www.xbrl.org/2003/role/disclosureRef
-Topic 946
-SubTopic 210
-Name Accounting Standards Codification
-Section S99
-Paragraph 1
-Subparagraph (SX 210.6-04(19))
-Publisher FASB
-URI https://asc.fasb.org//1943274/2147479617/946-210-S99-1
Reference 33: http://www.xbrl.org/2003/role/disclosureRef
-Topic 946
-SubTopic 210
-Name Accounting Standards Codification
-Section S99
-Paragraph 2
-Subparagraph (SX 210.6-05(4))
-Publisher FASB
-URI https://asc.fasb.org//1943274/2147479617/946-210-S99-2
Reference 34: http://www.xbrl.org/2009/role/commonPracticeRef
-Topic 946
-SubTopic 220
-Name Accounting Standards Codification
-Section S99
-Paragraph 3
-Subparagraph (SX 210.6-09(4)(b))
-Publisher FASB
-URI https://asc.fasb.org//1943274/2147483575/946-220-S99-3
Reference 35: http://www.xbrl.org/2003/role/disclosureRef
-Topic 946
-SubTopic 220
-Name Accounting Standards Codification
-Section S99
-Paragraph 3
-Subparagraph (SX 210.6-09(6))
-Publisher FASB
-URI https://asc.fasb.org//1943274/2147483575/946-220-S99-3
Reference 36: http://www.xbrl.org/2003/role/disclosureRef
-Topic 946
-SubTopic 220
-Name Accounting Standards Codification
-Section S99
-Paragraph 3
-Subparagraph (SX 210.6-09(7))
-Publisher FASB
-URI https://asc.fasb.org//1943274/2147483575/946-220-S99-3
Reference 37: http://www.xbrl.org/2003/role/disclosureRef
-Topic 505
-SubTopic 10
-Name Accounting Standards Codification
-Section S99
-Paragraph 1
-Subparagraph (SX 210.3-04)
-Publisher FASB
-URI https://asc.fasb.org//1943274/2147480008/505-10-S99-1
Reference 38: http://www.xbrl.org/2009/role/commonPracticeRef
-Topic 235
-SubTopic 10
-Name Accounting Standards Codification
-Section S99
-Paragraph 1
-Subparagraph (SX 210.4-08(g)(1)(ii))
-Publisher FASB
-URI https://asc.fasb.org//1943274/2147480678/235-10-S99-1
Reference 39: http://www.xbrl.org/2009/role/commonPracticeRef
-Topic 323
-SubTopic 10
-Name Accounting Standards Codification
-Section 50
-Paragraph 3
-Subparagraph (c)
-Publisher FASB
-URI https://asc.fasb.org//1943274/2147481687/323-10-50-3
Reference 40: http://www.xbrl.org/2009/role/commonPracticeRef
-Topic 825
-SubTopic 10
-Name Accounting Standards Codification
-Section 50
-Paragraph 28
-Subparagraph (f)
-Publisher FASB
-URI https://asc.fasb.org//1943274/2147482907/825-10-50-28
Reference 41: http://fasb.org/us-gaap/role/ref/legacyRef
-Name Accounting Standards Codification
-Topic 810
-SubTopic 10
-Section 45
-Paragraph 15
-Publisher FASB
-URI https://asc.fasb.org//1943274/2147481231/810-10-45-15
Reference 42: http://fasb.org/us-gaap/role/ref/legacyRef
-Name Accounting Standards Codification
-Topic 810
-SubTopic 10
-Section 45
-Paragraph 16
-Publisher FASB
-URI https://asc.fasb.org//1943274/2147481231/810-10-45-16
Reference 43: http://fasb.org/us-gaap/role/ref/legacyRef
-Name Accounting Standards Codification
-Topic 810
-SubTopic 10
-Section 55
-Paragraph 4I
-Publisher FASB
-URI https://asc.fasb.org//1943274/2147481175/810-10-55-4I
| Name: |
us-gaap_StockholdersEquityIncludingPortionAttributableToNoncontrollingInterest |
| Namespace Prefix: |
us-gaap_ |
| Data Type: |
xbrli:monetaryItemType |
| Balance Type: |
credit |
| Period Type: |
instant |
|
v3.23.3
Condensed Consolidated Statement of Cash Flows (Unaudited) - USD ($)
|
3 Months Ended |
9 Months Ended |
12 Months Ended |
Sep. 30, 2023 |
Sep. 30, 2022 |
Sep. 30, 2023 |
Sep. 30, 2022 |
Dec. 31, 2022 |
| CASH FLOWS FROM OPERATING ACTIVITIES: |
|
|
|
|
|
| Net loss |
$ (74,394)
|
$ (10,879)
|
$ (418,304)
|
$ (55,552)
|
|
| Minority interest |
(197)
|
|
(197)
|
|
|
| Share of loss from operation of associate |
|
|
154
|
|
|
| Adjustments to reconcile net profit to net cash used in operating activities: |
|
|
|
|
|
| Depreciation and amortization |
|
|
125,937
|
|
|
| Changes in operating assets and liabilities: |
|
|
|
|
|
| Account payable |
|
|
(660)
|
(4,200)
|
|
| Account receivable |
|
|
104,750
|
|
|
| Prepayment, deposits and other receivables |
|
|
54,214
|
(1,751)
|
|
| Other payables and accrued liabilities |
|
|
(223,644)
|
(3,200)
|
|
| Deferred revenue |
|
|
63,123
|
|
|
| Tax assets |
|
|
73,277
|
|
|
| Deferred income tax assets |
|
|
4,257
|
|
|
| Income tax payable |
|
|
|
896
|
|
| Change in lease liability |
|
|
(65,252)
|
|
|
| Net cash used in operating activities |
|
|
(282,345)
|
(63,807)
|
|
| CASH FLOWS FROM INVESTING ACTIVITIES: |
|
|
|
|
|
| Purchase of property, plant and equipment |
|
|
(30,320)
|
|
|
| Net cash used in financing activities |
|
|
(30,320)
|
|
|
| CASH FLOWS FROM FINANCING ACTIVITIES: |
|
|
|
|
|
| Repayment to director |
|
|
(46,724)
|
|
|
| Repayment of hire purchase |
|
|
(8,405)
|
|
|
| Advances to related companies |
|
|
(617)
|
|
|
| Net cash used in financing activities |
|
|
(55,746)
|
|
|
| Effect of exchange rate changes on cash and cash equivalents |
|
|
(37,969)
|
|
|
| Net changes in cash and cash equivalents |
|
|
(406,380)
|
(63,807)
|
|
| Cash and cash equivalents, beginning of year |
|
|
1,580,170
|
980,681
|
980,681
|
| CASH AND CASH EQUIVALENTS, END OF YEAR |
$ 1,173,790
|
$ 916,874
|
1,173,790
|
916,874
|
$ 1,580,170
|
| SUPPLEMENTAL CASH FLOWS INFORMATION |
|
|
|
|
|
| Cash paid for income taxes |
|
|
56,576
|
241
|
|
| Cash paid for interest paid |
|
|
$ 334
|
|
|
| X |
- DefinitionIncrease decrease in tax assets.
| Name: |
ASFH_IncreaseDecreaseInTaxAssets |
| Namespace Prefix: |
ASFH_ |
| Data Type: |
xbrli:monetaryItemType |
| Balance Type: |
debit |
| Period Type: |
duration |
|
| X |
- References
+ Details
| Name: |
ASFH_ShareOfLossFromOperationOfAssociate |
| Namespace Prefix: |
ASFH_ |
| Data Type: |
xbrli:monetaryItemType |
| Balance Type: |
debit |
| Period Type: |
duration |
|
| X |
- References
+ Details
| Name: |
us-gaap_AdjustmentsToReconcileNetIncomeLossToCashProvidedByUsedInOperatingActivitiesAbstract |
| Namespace Prefix: |
us-gaap_ |
| Data Type: |
xbrli:stringItemType |
| Balance Type: |
na |
| Period Type: |
duration |
|
| X |
- DefinitionAmount of cash and cash equivalents, and cash and cash equivalents restricted to withdrawal or usage; including, but not limited to, disposal group and discontinued operations. Cash includes, but is not limited to, currency on hand, demand deposits with banks or financial institutions, and other accounts with general characteristics of demand deposits. Cash equivalents include, but are not limited to, short-term, highly liquid investments that are both readily convertible to known amounts of cash and so near their maturity that they present insignificant risk of changes in value because of changes in interest rates. Reference 1: http://www.xbrl.org/2003/role/disclosureRef
-Topic 230
-SubTopic 10
-Name Accounting Standards Codification
-Section 50
-Paragraph 8
-Publisher FASB
-URI https://asc.fasb.org//1943274/2147482913/230-10-50-8
Reference 2: http://fasb.org/us-gaap/role/ref/legacyRef
-Topic 230
-SubTopic 10
-Name Accounting Standards Codification
-Section 45
-Paragraph 24
-Publisher FASB
-URI https://asc.fasb.org//1943274/2147482740/230-10-45-24
Reference 3: http://fasb.org/us-gaap/role/ref/legacyRef
-Name Accounting Standards Codification
-Topic 230
-SubTopic 10
-Section 45
-Paragraph 4
-Publisher FASB
-URI https://asc.fasb.org//1943274/2147482740/230-10-45-4
| Name: |
us-gaap_CashCashEquivalentsRestrictedCashAndRestrictedCashEquivalentsIncludingDisposalGroupAndDiscontinuedOperations |
| Namespace Prefix: |
us-gaap_ |
| Data Type: |
xbrli:monetaryItemType |
| Balance Type: |
debit |
| Period Type: |
instant |
|
| X |
- DefinitionAmount of increase (decrease) in cash, cash equivalents, and cash and cash equivalents restricted to withdrawal or usage; including effect from exchange rate change. Cash includes, but is not limited to, currency on hand, demand deposits with banks or financial institutions, and other accounts with general characteristics of demand deposits. Cash equivalents include, but are not limited to, short-term, highly liquid investments that are both readily convertible to known amounts of cash and so near their maturity that they present insignificant risk of changes in value because of changes in interest rates. Reference 1: http://fasb.org/us-gaap/role/ref/legacyRef
-Topic 230
-SubTopic 10
-Name Accounting Standards Codification
-Section 45
-Paragraph 24
-Publisher FASB
-URI https://asc.fasb.org//1943274/2147482740/230-10-45-24
Reference 2: http://fasb.org/us-gaap/role/ref/legacyRef
-Name Accounting Standards Codification
-Section 45
-Paragraph 1
-SubTopic 230
-Topic 830
-Publisher FASB
-URI https://asc.fasb.org//1943274/2147481877/830-230-45-1
| Name: |
us-gaap_CashCashEquivalentsRestrictedCashAndRestrictedCashEquivalentsPeriodIncreaseDecreaseIncludingExchangeRateEffect |
| Namespace Prefix: |
us-gaap_ |
| Data Type: |
xbrli:monetaryItemType |
| Balance Type: |
debit |
| Period Type: |
duration |
|
| X |
- DefinitionThe current period expense charged against earnings on long-lived, physical assets not used in production, and which are not intended for resale, to allocate or recognize the cost of such assets over their useful lives; or to record the reduction in book value of an intangible asset over the benefit period of such asset; or to reflect consumption during the period of an asset that is not used in production. Reference 1: http://fasb.org/us-gaap/role/ref/legacyRef
-Name Accounting Standards Codification
-Section 45
-Paragraph 28
-Subparagraph (b)
-SubTopic 10
-Topic 230
-Publisher FASB
-URI https://asc.fasb.org//1943274/2147482740/230-10-45-28
Reference 2: http://fasb.org/us-gaap/role/ref/legacyRef
-Name Accounting Standards Codification
-Topic 360
-SubTopic 10
-Section 50
-Paragraph 1
-Subparagraph (a)
-Publisher FASB
-URI https://asc.fasb.org//1943274/2147482099/360-10-50-1
| Name: |
us-gaap_DepreciationAndAmortization |
| Namespace Prefix: |
us-gaap_ |
| Data Type: |
xbrli:monetaryItemType |
| Balance Type: |
debit |
| Period Type: |
duration |
|
| X |
- DefinitionAmount of increase (decrease) from effect of exchange rate changes on cash and cash equivalents, and cash and cash equivalents restricted to withdrawal or usage; held in foreign currencies; including, but not limited to, disposal group and discontinued operations. Cash includes, but is not limited to, currency on hand, demand deposits with banks or financial institutions, and other accounts with general characteristics of demand deposits. Cash equivalents include, but are not limited to, short-term, highly liquid investments that are both readily convertible to known amounts of cash and so near their maturity that they present insignificant risk of changes in value because of changes in interest rates. Reference 1: http://www.xbrl.org/2009/role/commonPracticeRef
-Topic 830
-SubTopic 230
-Name Accounting Standards Codification
-Section 45
-Paragraph 1
-Publisher FASB
-URI https://asc.fasb.org//1943274/2147481877/830-230-45-1
| Name: |
us-gaap_EffectOfExchangeRateOnCashCashEquivalentsRestrictedCashAndRestrictedCashEquivalentsIncludingDisposalGroupAndDiscontinuedOperations |
| Namespace Prefix: |
us-gaap_ |
| Data Type: |
xbrli:monetaryItemType |
| Balance Type: |
debit |
| Period Type: |
duration |
|
| X |
- DefinitionThe increase (decrease) during the reporting period in the aggregate amount of liabilities incurred (and for which invoices have typically been received) and payable to vendors for goods and services received that are used in an entity's business. Reference 1: http://fasb.org/us-gaap/role/ref/legacyRef
-Name Accounting Standards Codification
-Section 45
-Paragraph 28
-Subparagraph (a)
-SubTopic 10
-Topic 230
-Publisher FASB
-URI https://asc.fasb.org//1943274/2147482740/230-10-45-28
| Name: |
us-gaap_IncreaseDecreaseInAccountsPayable |
| Namespace Prefix: |
us-gaap_ |
| Data Type: |
xbrli:monetaryItemType |
| Balance Type: |
debit |
| Period Type: |
duration |
|
| X |
- DefinitionThe increase (decrease) during the reporting period in amount due within one year (or one business cycle) from customers for the credit sale of goods and services. Reference 1: http://fasb.org/us-gaap/role/ref/legacyRef
-Name Accounting Standards Codification
-Section 45
-Paragraph 28
-Subparagraph (a)
-SubTopic 10
-Topic 230
-Publisher FASB
-URI https://asc.fasb.org//1943274/2147482740/230-10-45-28
| Name: |
us-gaap_IncreaseDecreaseInAccountsReceivable |
| Namespace Prefix: |
us-gaap_ |
| Data Type: |
xbrli:monetaryItemType |
| Balance Type: |
credit |
| Period Type: |
duration |
|
| X |
- DefinitionAmount of increase (decrease) in deferred income and obligation to transfer product and service to customer for which consideration has been received or is receivable. Reference 1: http://www.xbrl.org/2003/role/exampleRef
-Name Accounting Standards Codification
-Section 45
-Paragraph 28
-Subparagraph (a)
-SubTopic 10
-Topic 230
-Publisher FASB
-URI https://asc.fasb.org//1943274/2147482740/230-10-45-28
| Name: |
us-gaap_IncreaseDecreaseInDeferredRevenue |
| Namespace Prefix: |
us-gaap_ |
| Data Type: |
xbrli:monetaryItemType |
| Balance Type: |
debit |
| Period Type: |
duration |
|
| X |
- References
+ Details
| Name: |
us-gaap_IncreaseDecreaseInOperatingCapitalAbstract |
| Namespace Prefix: |
us-gaap_ |
| Data Type: |
xbrli:stringItemType |
| Balance Type: |
na |
| Period Type: |
duration |
|
| X |
- DefinitionAmount of increase (decrease) in obligation for operating lease. Reference 1: http://www.xbrl.org/2009/role/commonPracticeRef
-Topic 230
-SubTopic 10
-Name Accounting Standards Codification
-Section 45
-Paragraph 28
-Subparagraph (a)
-Publisher FASB
-URI https://asc.fasb.org//1943274/2147482740/230-10-45-28
Reference 2: http://www.xbrl.org/2009/role/commonPracticeRef
-Name Accounting Standards Codification
-Section 50
-Paragraph 4
-Subparagraph (g)(1)
-SubTopic 20
-Topic 842
-Publisher FASB
-URI https://asc.fasb.org//1943274/2147478964/842-20-50-4
| Name: |
us-gaap_IncreaseDecreaseInOperatingLeaseLiability |
| Namespace Prefix: |
us-gaap_ |
| Data Type: |
xbrli:monetaryItemType |
| Balance Type: |
debit |
| Period Type: |
duration |
|
| X |
- DefinitionThe increase (decrease) during the reporting period in other obligations or expenses incurred but not yet paid. Reference 1: http://fasb.org/us-gaap/role/ref/legacyRef
-Name Accounting Standards Codification
-Section 45
-Paragraph 28
-Subparagraph (a)
-SubTopic 10
-Topic 230
-Publisher FASB
-URI https://asc.fasb.org//1943274/2147482740/230-10-45-28
| Name: |
us-gaap_IncreaseDecreaseInOtherAccountsPayableAndAccruedLiabilities |
| Namespace Prefix: |
us-gaap_ |
| Data Type: |
xbrli:monetaryItemType |
| Balance Type: |
debit |
| Period Type: |
duration |
|
| X |
- DefinitionAmount of increase (decrease) in prepaid expenses, and assets classified as other. Reference 1: http://fasb.org/us-gaap/role/ref/legacyRef
-Name Accounting Standards Codification
-Section 45
-Paragraph 28
-Subparagraph (a)
-SubTopic 10
-Topic 230
-Publisher FASB
-URI https://asc.fasb.org//1943274/2147482740/230-10-45-28
| Name: |
us-gaap_IncreaseDecreaseInPrepaidDeferredExpenseAndOtherAssets |
| Namespace Prefix: |
us-gaap_ |
| Data Type: |
xbrli:monetaryItemType |
| Balance Type: |
credit |
| Period Type: |
duration |
|
| X |
- DefinitionAmount of cash paid for interest, excluding capitalized interest, classified as operating activity. Includes, but is not limited to, payment to settle zero-coupon bond for accreted interest of debt discount and debt instrument with insignificant coupon interest rate in relation to effective interest rate of borrowing attributable to accreted interest of debt discount. Reference 1: http://www.xbrl.org/2003/role/disclosureRef
-Topic 230
-SubTopic 10
-Name Accounting Standards Codification
-Section 45
-Paragraph 17
-Subparagraph (d)
-Publisher FASB
-URI https://asc.fasb.org//1943274/2147482740/230-10-45-17
Reference 2: http://www.xbrl.org/2003/role/disclosureRef
-Topic 230
-SubTopic 10
-Name Accounting Standards Codification
-Section 45
-Paragraph 25
-Subparagraph (e)
-Publisher FASB
-URI https://asc.fasb.org//1943274/2147482740/230-10-45-25
Reference 3: http://www.xbrl.org/2003/role/disclosureRef
-Topic 230
-SubTopic 10
-Name Accounting Standards Codification
-Section 50
-Paragraph 2
-Publisher FASB
-URI https://asc.fasb.org//1943274/2147482913/230-10-50-2
| Name: |
us-gaap_InterestPaidNet |
| Namespace Prefix: |
us-gaap_ |
| Data Type: |
xbrli:monetaryItemType |
| Balance Type: |
credit |
| Period Type: |
duration |
|
| X |
- DefinitionAmount of cash inflow (outflow) from financing activities, including discontinued operations. Financing activity cash flows include obtaining resources from owners and providing them with a return on, and a return of, their investment; borrowing money and repaying amounts borrowed, or settling the obligation; and obtaining and paying for other resources obtained from creditors on long-term credit. Reference 1: http://www.xbrl.org/2003/role/disclosureRef
-Topic 230
-SubTopic 10
-Name Accounting Standards Codification
-Section 45
-Paragraph 24
-Publisher FASB
-URI https://asc.fasb.org//1943274/2147482740/230-10-45-24
| Name: |
us-gaap_NetCashProvidedByUsedInFinancingActivities |
| Namespace Prefix: |
us-gaap_ |
| Data Type: |
xbrli:monetaryItemType |
| Balance Type: |
debit |
| Period Type: |
duration |
|
| X |
- References
+ Details
| Name: |
us-gaap_NetCashProvidedByUsedInFinancingActivitiesAbstract |
| Namespace Prefix: |
us-gaap_ |
| Data Type: |
xbrli:stringItemType |
| Balance Type: |
na |
| Period Type: |
duration |
|
| X |
- DefinitionAmount of cash inflow (outflow) from investing activities, including discontinued operations. Investing activity cash flows include making and collecting loans and acquiring and disposing of debt or equity instruments and property, plant, and equipment and other productive assets. Reference 1: http://www.xbrl.org/2003/role/disclosureRef
-Topic 230
-SubTopic 10
-Name Accounting Standards Codification
-Section 45
-Paragraph 24
-Publisher FASB
-URI https://asc.fasb.org//1943274/2147482740/230-10-45-24
| Name: |
us-gaap_NetCashProvidedByUsedInInvestingActivities |
| Namespace Prefix: |
us-gaap_ |
| Data Type: |
xbrli:monetaryItemType |
| Balance Type: |
debit |
| Period Type: |
duration |
|
| X |
- References
+ Details
| Name: |
us-gaap_NetCashProvidedByUsedInInvestingActivitiesAbstract |
| Namespace Prefix: |
us-gaap_ |
| Data Type: |
xbrli:stringItemType |
| Balance Type: |
na |
| Period Type: |
duration |
|
| X |
- DefinitionAmount of cash inflow (outflow) from operating activities, including discontinued operations. Operating activity cash flows include transactions, adjustments, and changes in value not defined as investing or financing activities. Reference 1: http://fasb.org/us-gaap/role/ref/legacyRef
-Topic 230
-SubTopic 10
-Name Accounting Standards Codification
-Section 45
-Paragraph 28
-Publisher FASB
-URI https://asc.fasb.org//1943274/2147482740/230-10-45-28
Reference 2: http://fasb.org/us-gaap/role/ref/legacyRef
-Topic 230
-SubTopic 10
-Name Accounting Standards Codification
-Section 45
-Paragraph 24
-Publisher FASB
-URI https://asc.fasb.org//1943274/2147482740/230-10-45-24
Reference 3: http://fasb.org/us-gaap/role/ref/legacyRef
-Topic 230
-SubTopic 10
-Name Accounting Standards Codification
-Section 45
-Paragraph 25
-Publisher FASB
-URI https://asc.fasb.org//1943274/2147482740/230-10-45-25
| Name: |
us-gaap_NetCashProvidedByUsedInOperatingActivities |
| Namespace Prefix: |
us-gaap_ |
| Data Type: |
xbrli:monetaryItemType |
| Balance Type: |
na |
| Period Type: |
duration |
|
| X |
- References
+ Details
| Name: |
us-gaap_NetCashProvidedByUsedInOperatingActivitiesAbstract |
| Namespace Prefix: |
us-gaap_ |
| Data Type: |
xbrli:stringItemType |
| Balance Type: |
na |
| Period Type: |
duration |
|
| X |
- DefinitionThe portion of profit or loss for the period, net of income taxes, which is attributable to the parent. Reference 1: http://www.xbrl.org/2003/role/disclosureRef
-Topic 235
-SubTopic 10
-Name Accounting Standards Codification
-Section S99
-Paragraph 1
-Subparagraph (SX 210.4-08(g)(1)(ii))
-Publisher FASB
-URI https://asc.fasb.org//1943274/2147480678/235-10-S99-1
Reference 2: http://www.xbrl.org/2003/role/disclosureRef
-Topic 323
-SubTopic 10
-Name Accounting Standards Codification
-Section 50
-Paragraph 3
-Subparagraph (c)
-Publisher FASB
-URI https://asc.fasb.org//1943274/2147481687/323-10-50-3
Reference 3: http://www.xbrl.org/2003/role/disclosureRef
-Topic 825
-SubTopic 10
-Name Accounting Standards Codification
-Section 50
-Paragraph 28
-Subparagraph (f)
-Publisher FASB
-URI https://asc.fasb.org//1943274/2147482907/825-10-50-28
Reference 4: http://www.xbrl.org/2003/role/disclosureRef
-Topic 220
-SubTopic 10
-Name Accounting Standards Codification
-Section 50
-Paragraph 6
-Publisher FASB
-URI https://asc.fasb.org//1943274/2147482765/220-10-50-6
Reference 5: http://www.xbrl.org/2003/role/disclosureRef
-Topic 250
-SubTopic 10
-Name Accounting Standards Codification
-Section 50
-Paragraph 3
-Publisher FASB
-URI https://asc.fasb.org//1943274/2147483443/250-10-50-3
Reference 6: http://www.xbrl.org/2003/role/disclosureRef
-Topic 250
-SubTopic 10
-Name Accounting Standards Codification
-Section 50
-Paragraph 1
-Subparagraph (b)(2)
-Publisher FASB
-URI https://asc.fasb.org//1943274/2147483443/250-10-50-1
Reference 7: http://www.xbrl.org/2003/role/disclosureRef
-Topic 815
-SubTopic 40
-Name Accounting Standards Codification
-Section 65
-Paragraph 1
-Subparagraph (f)
-Publisher FASB
-URI https://asc.fasb.org//1943274/2147480175/815-40-65-1
Reference 8: http://www.xbrl.org/2003/role/disclosureRef
-Topic 250
-SubTopic 10
-Name Accounting Standards Codification
-Section 50
-Paragraph 8
-Publisher FASB
-URI https://asc.fasb.org//1943274/2147483443/250-10-50-8
Reference 9: http://www.xbrl.org/2003/role/disclosureRef
-Topic 250
-SubTopic 10
-Name Accounting Standards Codification
-Section 50
-Paragraph 9
-Publisher FASB
-URI https://asc.fasb.org//1943274/2147483443/250-10-50-9
Reference 10: http://www.xbrl.org/2003/role/disclosureRef
-Topic 250
-SubTopic 10
-Name Accounting Standards Codification
-Section 50
-Paragraph 11
-Subparagraph (a)
-Publisher FASB
-URI https://asc.fasb.org//1943274/2147483443/250-10-50-11
Reference 11: http://www.xbrl.org/2003/role/disclosureRef
-Topic 250
-SubTopic 10
-Name Accounting Standards Codification
-Section 50
-Paragraph 11
-Subparagraph (b)
-Publisher FASB
-URI https://asc.fasb.org//1943274/2147483443/250-10-50-11
Reference 12: http://www.xbrl.org/2003/role/disclosureRef
-Topic 250
-SubTopic 10
-Name Accounting Standards Codification
-Section 50
-Paragraph 4
-Publisher FASB
-URI https://asc.fasb.org//1943274/2147483443/250-10-50-4
Reference 13: http://www.xbrl.org/2003/role/exampleRef
-Topic 946
-SubTopic 830
-Name Accounting Standards Codification
-Section 55
-Paragraph 10
-Publisher FASB
-URI https://asc.fasb.org//1943274/2147480167/946-830-55-10
Reference 14: http://www.xbrl.org/2003/role/disclosureRef
-Topic 946
-SubTopic 220
-Name Accounting Standards Codification
-Section 45
-Paragraph 7
-Publisher FASB
-URI https://asc.fasb.org//1943274/2147483581/946-220-45-7
Reference 15: http://www.xbrl.org/2003/role/disclosureRef
-Topic 944
-SubTopic 220
-Name Accounting Standards Codification
-Section S99
-Paragraph 1
-Subparagraph (SX 210.7-04(18))
-Publisher FASB
-URI https://asc.fasb.org//1943274/2147483586/944-220-S99-1
Reference 16: http://www.xbrl.org/2003/role/disclosureRef
-Topic 280
-SubTopic 10
-Name Accounting Standards Codification
-Section 50
-Paragraph 22
-Publisher FASB
-URI https://asc.fasb.org//1943274/2147482810/280-10-50-22
Reference 17: http://www.xbrl.org/2003/role/disclosureRef
-Topic 946
-SubTopic 220
-Name Accounting Standards Codification
-Section S99
-Paragraph 1
-Subparagraph (SX 210.6-07(9))
-Publisher FASB
-URI https://asc.fasb.org//1943274/2147483575/946-220-S99-1
Reference 18: http://www.xbrl.org/2003/role/disclosureRef
-Topic 946
-SubTopic 220
-Name Accounting Standards Codification
-Section S99
-Paragraph 3
-Subparagraph (SX 210.6-09(1)(d))
-Publisher FASB
-URI https://asc.fasb.org//1943274/2147483575/946-220-S99-3
Reference 19: http://www.xbrl.org/2003/role/disclosureRef
-Topic 470
-SubTopic 10
-Name Accounting Standards Codification
-Section S99
-Paragraph 1A
-Subparagraph (SX 210.13-01(a)(4)(i))
-Publisher FASB
-URI https://asc.fasb.org//1943274/2147480097/470-10-S99-1A
Reference 20: http://www.xbrl.org/2009/role/commonPracticeRef
-Topic 470
-SubTopic 10
-Name Accounting Standards Codification
-Section S99
-Paragraph 1A
-Subparagraph (SX 210.13-01(a)(4)(ii))
-Publisher FASB
-URI https://asc.fasb.org//1943274/2147480097/470-10-S99-1A
Reference 21: http://www.xbrl.org/2003/role/disclosureRef
-Topic 470
-SubTopic 10
-Name Accounting Standards Codification
-Section S99
-Paragraph 1A
-Subparagraph (SX 210.13-01(a)(4)(iii)(A))
-Publisher FASB
-URI https://asc.fasb.org//1943274/2147480097/470-10-S99-1A
Reference 22: http://www.xbrl.org/2003/role/disclosureRef
-Topic 470
-SubTopic 10
-Name Accounting Standards Codification
-Section S99
-Paragraph 1A
-Subparagraph (SX 210.13-01(a)(4)(iv))
-Publisher FASB
-URI https://asc.fasb.org//1943274/2147480097/470-10-S99-1A
Reference 23: http://www.xbrl.org/2003/role/disclosureRef
-Topic 470
-SubTopic 10
-Name Accounting Standards Codification
-Section S99
-Paragraph 1A
-Subparagraph (SX 210.13-01(a)(5))
-Publisher FASB
-URI https://asc.fasb.org//1943274/2147480097/470-10-S99-1A
Reference 24: http://www.xbrl.org/2003/role/disclosureRef
-Topic 470
-SubTopic 10
-Name Accounting Standards Codification
-Section S99
-Paragraph 1B
-Subparagraph (SX 210.13-02(a)(4)(i))
-Publisher FASB
-URI https://asc.fasb.org//1943274/2147480097/470-10-S99-1B
Reference 25: http://www.xbrl.org/2003/role/disclosureRef
-Topic 470
-SubTopic 10
-Name Accounting Standards Codification
-Section S99
-Paragraph 1B
-Subparagraph (SX 210.13-02(a)(4)(iii)(A))
-Publisher FASB
-URI https://asc.fasb.org//1943274/2147480097/470-10-S99-1B
Reference 26: http://www.xbrl.org/2003/role/disclosureRef
-Topic 470
-SubTopic 10
-Name Accounting Standards Codification
-Section S99
-Paragraph 1B
-Subparagraph (SX 210.13-02(a)(4)(iii)(B))
-Publisher FASB
-URI https://asc.fasb.org//1943274/2147480097/470-10-S99-1B
Reference 27: http://www.xbrl.org/2003/role/disclosureRef
-Topic 470
-SubTopic 10
-Name Accounting Standards Codification
-Section S99
-Paragraph 1B
-Subparagraph (SX 210.13-02(a)(4)(iv))
-Publisher FASB
-URI https://asc.fasb.org//1943274/2147480097/470-10-S99-1B
Reference 28: http://www.xbrl.org/2003/role/disclosureRef
-Topic 470
-SubTopic 10
-Name Accounting Standards Codification
-Section S99
-Paragraph 1B
-Subparagraph (SX 210.13-02(a)(5))
-Publisher FASB
-URI https://asc.fasb.org//1943274/2147480097/470-10-S99-1B
Reference 29: http://www.xbrl.org/2003/role/disclosureRef
-Topic 280
-SubTopic 10
-Name Accounting Standards Codification
-Section 50
-Paragraph 30
-Subparagraph (b)
-Publisher FASB
-URI https://asc.fasb.org//1943274/2147482810/280-10-50-30
Reference 30: http://www.xbrl.org/2003/role/disclosureRef
-Topic 280
-SubTopic 10
-Name Accounting Standards Codification
-Section 50
-Paragraph 32
-Subparagraph (f)
-Publisher FASB
-URI https://asc.fasb.org//1943274/2147482810/280-10-50-32
Reference 31: http://www.xbrl.org/2003/role/disclosureRef
-Topic 260
-SubTopic 10
-Name Accounting Standards Codification
-Section 45
-Paragraph 60B
-Subparagraph (a)
-Publisher FASB
-URI https://asc.fasb.org//1943274/2147482689/260-10-45-60B
Reference 32: http://www.xbrl.org/2003/role/exampleRef
-Topic 280
-SubTopic 10
-Name Accounting Standards Codification
-Section 50
-Paragraph 31
-Publisher FASB
-URI https://asc.fasb.org//1943274/2147482810/280-10-50-31
Reference 33: http://www.xbrl.org/2003/role/disclosureRef
-Topic 280
-SubTopic 10
-Name Accounting Standards Codification
-Section 50
-Paragraph 32
-Subparagraph (c)
-Publisher FASB
-URI https://asc.fasb.org//1943274/2147482810/280-10-50-32
Reference 34: http://www.xbrl.org/2003/role/disclosureRef
-Topic 205
-SubTopic 20
-Name Accounting Standards Codification
-Section 50
-Paragraph 7
-Publisher FASB
-URI https://asc.fasb.org//1943274/2147483499/205-20-50-7
Reference 35: http://fasb.org/us-gaap/role/ref/legacyRef
-Topic 230
-SubTopic 10
-Name Accounting Standards Codification
-Section 45
-Paragraph 28
-Publisher FASB
-URI https://asc.fasb.org//1943274/2147482740/230-10-45-28
Reference 36: http://www.xbrl.org/2003/role/disclosureRef
-Topic 220
-SubTopic 10
-Name Accounting Standards Codification
-Section 45
-Paragraph 1A
-Subparagraph (a)
-Publisher FASB
-URI https://asc.fasb.org//1943274/2147482790/220-10-45-1A
Reference 37: http://www.xbrl.org/2003/role/disclosureRef
-Topic 220
-SubTopic 10
-Name Accounting Standards Codification
-Section 45
-Paragraph 1B
-Subparagraph (a)
-Publisher FASB
-URI https://asc.fasb.org//1943274/2147482790/220-10-45-1B
Reference 38: http://fasb.org/us-gaap/role/ref/legacyRef
-Topic 220
-SubTopic 10
-Name Accounting Standards Codification
-Section S99
-Paragraph 2
-Subparagraph (SX 210.5-03(20))
-Publisher FASB
-URI https://asc.fasb.org//1943274/2147483621/220-10-S99-2
Reference 39: http://fasb.org/us-gaap/role/ref/legacyRef
-Topic 942
-SubTopic 220
-Name Accounting Standards Codification
-Section S99
-Paragraph 1
-Subparagraph (SX 210.9-04(22))
-Publisher FASB
-URI https://asc.fasb.org//1943274/2147483589/942-220-S99-1
| Name: |
us-gaap_NetIncomeLoss |
| Namespace Prefix: |
us-gaap_ |
| Data Type: |
xbrli:monetaryItemType |
| Balance Type: |
credit |
| Period Type: |
duration |
|
| X |
- DefinitionAmount of Net Income (Loss) attributable to noncontrolling interest. Reference 1: http://www.xbrl.org/2003/role/disclosureRef
-Topic 250
-SubTopic 10
-Name Accounting Standards Codification
-Section 50
-Paragraph 8
-Publisher FASB
-URI https://asc.fasb.org//1943274/2147483443/250-10-50-8
Reference 2: http://www.xbrl.org/2003/role/disclosureRef
-Topic 250
-SubTopic 10
-Name Accounting Standards Codification
-Section 50
-Paragraph 9
-Publisher FASB
-URI https://asc.fasb.org//1943274/2147483443/250-10-50-9
Reference 3: http://www.xbrl.org/2003/role/disclosureRef
-Topic 944
-SubTopic 220
-Name Accounting Standards Codification
-Section S99
-Paragraph 1
-Subparagraph (SX 210.7-04(17))
-Publisher FASB
-URI https://asc.fasb.org//1943274/2147483586/944-220-S99-1
Reference 4: http://www.xbrl.org/2009/role/commonPracticeRef
-Topic 220
-SubTopic 10
-Name Accounting Standards Codification
-Section 50
-Paragraph 6
-Publisher FASB
-URI https://asc.fasb.org//1943274/2147482765/220-10-50-6
Reference 5: http://fasb.org/us-gaap/role/ref/legacyRef
-Topic 810
-SubTopic 10
-Name Accounting Standards Codification
-Section 50
-Paragraph 1A
-Subparagraph (a)(2)
-Publisher FASB
-URI https://asc.fasb.org//1943274/2147481203/810-10-50-1A
Reference 6: http://fasb.org/us-gaap/role/ref/legacyRef
-Name Accounting Standards Codification
-Topic 810
-SubTopic 10
-Section 55
-Paragraph 4J
-Publisher FASB
-URI https://asc.fasb.org//1943274/2147481175/810-10-55-4J
Reference 7: http://www.xbrl.org/2003/role/disclosureRef
-Topic 220
-SubTopic 10
-Name Accounting Standards Codification
-Section 45
-Paragraph 1A
-Subparagraph (a)
-Publisher FASB
-URI https://asc.fasb.org//1943274/2147482790/220-10-45-1A
Reference 8: http://www.xbrl.org/2003/role/disclosureRef
-Topic 220
-SubTopic 10
-Name Accounting Standards Codification
-Section 45
-Paragraph 1B
-Subparagraph (a)
-Publisher FASB
-URI https://asc.fasb.org//1943274/2147482790/220-10-45-1B
| Name: |
us-gaap_NetIncomeLossAttributableToNoncontrollingInterest |
| Namespace Prefix: |
us-gaap_ |
| Data Type: |
xbrli:monetaryItemType |
| Balance Type: |
debit |
| Period Type: |
duration |
|
| X |
- DefinitionThe cash outflow associated with the acquisition of long-lived, physical assets that are used in the normal conduct of business to produce goods and services and not intended for resale; includes cash outflows to pay for construction of self-constructed assets. Reference 1: http://fasb.org/us-gaap/role/ref/legacyRef
-Topic 230
-SubTopic 10
-Name Accounting Standards Codification
-Section 45
-Paragraph 13
-Subparagraph (c)
-Publisher FASB
-URI https://asc.fasb.org//1943274/2147482740/230-10-45-13
| Name: |
us-gaap_PaymentsToAcquirePropertyPlantAndEquipment |
| Namespace Prefix: |
us-gaap_ |
| Data Type: |
xbrli:monetaryItemType |
| Balance Type: |
credit |
| Period Type: |
duration |
|
| X |
- DefinitionAmount of cash outflow for the payment of debt classified as other, maturing after one year or the operating cycle, if longer. Reference 1: http://fasb.org/us-gaap/role/ref/legacyRef
-Name Accounting Standards Codification
-Topic 230
-SubTopic 10
-Section 45
-Paragraph 15
-Subparagraph (b)
-Publisher FASB
-URI https://asc.fasb.org//1943274/2147482740/230-10-45-15
| Name: |
us-gaap_RepaymentsOfOtherLongTermDebt |
| Namespace Prefix: |
us-gaap_ |
| Data Type: |
xbrli:monetaryItemType |
| Balance Type: |
credit |
| Period Type: |
duration |
|
v3.23.3
ORGANIZATION AND BUSINESS BACKGROUND
|
9 Months Ended |
Sep. 30, 2023 |
|---|
| Organization, Consolidation and Presentation of Financial Statements [Abstract] |
|
| ORGANIZATION AND BUSINESS BACKGROUND |
1.
ORGANIZATION AND BUSINESS BACKGROUND
AsiaFIN
Holdings Corp. (“the Company”) was incorporated under the jurisdiction of Nevada on June 14, 2019. The Company, through its
wholly owned subsidiaries, provides information technology services. Details of the Company’s subsidiaries and associate:
SCHEDULE OF SUBSIDIARIES
| No. |
|
Subsidiary
Company
Name |
|
Domicile
and Date of Incorporation |
|
Particulars
of
Issued
Capital |
|
Principal
Activities |
| 1 |
|
AsiaFIN
Holdings Corp. |
|
Labuan
at July 15, 2019 |
|
1
shares of common stock |
|
Investment
holding company |
| |
|
|
|
|
|
|
|
|
| 2 |
|
AsiaFIN
Holdings Limited |
|
Hong
Kong at July 5, 2019 |
|
1
shares of common stock |
|
Investment
holding company |
| |
|
|
|
|
|
|
|
|
| 3 |
|
StarFIN
Holdings Limited |
|
British
Virgin Island at August 19, 2021 |
|
10,000
shares of common stock |
|
Investment
holding company |
| |
|
|
|
|
|
|
|
|
| 4 |
|
Insite
MY Holdings Sdn Bhd (FKA StarFIN Asia Sdn Bhd) |
|
Malaysia
at May 24, 2018 |
|
11,400,102
shares of common stock |
|
Investment
holding company |
| |
|
|
|
|
|
|
|
|
| 5 |
|
OrangeFIN
Academy Sdn Bhd (FKA Insite MY.Com Sdn Bhd) |
|
Malaysia
at February 2, 2000 |
|
100,000
shares of common stock |
|
Provision
of business system integration and management services |
| |
|
|
|
` |
|
|
|
|
| 6 |
|
Insite
MY Systems Sdn Bhd |
|
Malaysia
at January 18, 2000 |
|
500,000
shares of common stock |
|
Provision
of information technology services |
| |
|
|
|
|
|
|
|
|
| 7 |
|
Insite
MY Innovations Sdn Bhd |
|
Malaysia
at January 18, 2010 |
|
540,000
shares of common stock |
|
Provision
of information technology services |
| |
|
|
|
|
|
|
|
|
| 8 |
|
OrangeFIN
Asia Sdn Bhd |
|
Malaysia
at January 25, 2018 |
|
50,000
shares of common stock |
|
Provision
of computer programming activities and services |
| |
|
|
|
|
|
|
|
|
| 9 |
|
TellUS
Report Sdn Bhd |
|
Malaysia
at September 22, 2023 |
|
60
shares of common stock |
|
Provision
of information technology services |
| No. |
|
Associate
Company
Name |
|
Domicile
and Date of Incorporation |
|
Particulars
of
Issued
Capital |
|
Principal
Activities |
| 1 |
|
Murni
StarFIN Sdn Bhd |
|
Malaysia
at September 9, 2022 |
|
100,000
shares of common stock |
|
Provision
of information technology services |
Mr.
Wong Kai Cheong is the common director of all of aforementioned companies.
|
| X |
- References
+ Details
| Name: |
us-gaap_OrganizationConsolidationAndPresentationOfFinancialStatementsAbstract |
| Namespace Prefix: |
us-gaap_ |
| Data Type: |
xbrli:stringItemType |
| Balance Type: |
na |
| Period Type: |
duration |
|
| X |
- DefinitionThe entire disclosure for organization, consolidation and basis of presentation of financial statements disclosure. Reference 1: http://www.xbrl.org/2003/role/disclosureRef
-Topic 946
-SubTopic 10
-Name Accounting Standards Codification
-Section 50
-Paragraph 1
-Publisher FASB
-URI https://asc.fasb.org//1943274/2147480424/946-10-50-1
Reference 2: http://www.xbrl.org/2003/role/disclosureRef
-Topic 946
-SubTopic 10
-Name Accounting Standards Codification
-Section 50
-Paragraph 2
-Publisher FASB
-URI https://asc.fasb.org//1943274/2147480424/946-10-50-2
Reference 3: http://fasb.org/us-gaap/role/ref/legacyRef
-Topic 810
-Name Accounting Standards Codification
-Publisher FASB
-URI https://asc.fasb.org//810/tableOfContent
Reference 4: http://fasb.org/us-gaap/role/ref/legacyRef
-Topic 205
-Name Accounting Standards Codification
-Publisher FASB
-URI https://asc.fasb.org//205/tableOfContent
| Name: |
us-gaap_OrganizationConsolidationAndPresentationOfFinancialStatementsDisclosureTextBlock |
| Namespace Prefix: |
us-gaap_ |
| Data Type: |
dtr-types:textBlockItemType |
| Balance Type: |
na |
| Period Type: |
duration |
|
v3.23.3
SUMMARY OF SIGNIFICANT ACCOUNTING POLICIES
|
9 Months Ended |
Sep. 30, 2023 |
|---|
| Accounting Policies [Abstract] |
|
| SUMMARY OF SIGNIFICANT ACCOUNTING POLICIES |
2.
SUMMARY OF SIGNIFICANT ACCOUNTING POLICIES
Basis
of Presentation
These
accompanying financial statements have been prepared in accordance with generally accepted accounting principles in the United States
of America (“US GAAP”).
The
accompanying financial statements include the accounts of the Company and its subsidiaries and associates. Intercompany transactions
and balances were eliminated in consolidation. The Company has adopted December 31 as its fiscal year end. Below is the organization
chart of the Group.
The
accompanying unaudited condensed consolidated financial statements as of and for the nine months ended September 30, 2023 and 2022 have
been prepared pursuant to the rules and regulations of the Securities and Exchange Commission (the “SEC”) that permit reduced
disclosure for interim periods. Certain information and footnote disclosures normally included in financial statements prepared in accordance
with accounting principles generally accepted in the United States of America (“US GAAP”) have been condensed or omitted.
In the opinion of management, all adjustments (consisting of normal recurring accruals) considered necessary for a fair presentation
have been included. Operating results for the period ended September 30, 2023 are not necessarily indicative of the results that may
be expected for the year ending December 31, 2023. The Condensed Consolidated Balance Sheet information as of December 31, 2022 was derived
from the Company’s audited Consolidated Financial Statements as of and for the year ended December 31, 2022 included in the Company’s
Annual Report on Form 10-K filed with the SEC on February 16, 2023. These financial statements should be read in conjunction with that
report.
The
accompanying unaudited condensed consolidated financial statements include the accounts of the Company and its wholly owned subsidiaries
and majority-owned subsidiaries which the Company controls and entities for which the Company is the primary beneficiary. For those consolidated
subsidiaries where the Company’s ownership is less than 100%, the outside shareholders’ interests are shown as noncontrolling
interests in equity. Acquired businesses are included in the consolidated financial statements from the date on which control is transferred
to the Company. Subsidiaries are deconsolidated from the date that control ceases. All inter-company accounts and transactions have been
eliminated in consolidation.
Use
of Estimates
In
preparing these financial statements, management makes estimates and assumptions that affect the reported amounts of assets and liabilities
in the balance sheets and revenues and expenses during the years reported. Actual results may differ from these estimates.
Cash
and Cash Equivalents
The
Company considers short-term, highly liquid investments with an original maturity of 90 days or less to be cash equivalents.
Our
deposit in Malaysia banks are secured by Perbadanan Insurans Deposit Malaysia, compensating up to a limit of Malaysia Ringgit MYR250,000
per deposit per member bank, which is equivalent to $53,191, if any of our bank fail.
Property,
Plant and Equipment
Property,
plant and equipment are stated at cost, with depreciation and amortization provided using the straight-line method over the following
periods:
SCHEDULE
OF PLANT AND EQUIPMENT DEPRECIATION PERIODS
| Asset
Categories |
|
Depreciation
Periods |
| Renovation |
|
over
the remaining lease period |
| Computer
Systems |
|
4
to 5 years |
| Furniture
and Fittings |
|
10
years |
| Electrical
Fittings |
|
10
years |
| Handphone |
|
5
years |
| Office
Equipment |
|
10
years |
| Motor
Vehicle |
|
5
years |
| Property |
|
50
years |
Revenue
recognition
The
Company through subsidiaries generate multiple streams of revenues based on different business model adopted by each subsidiary through
provisions of services and recognized upon customer obtained control of promised services and recognized in an amount that reflects the
consideration that the Company expects to receive in exchange for those services. In addition, the standard requires disclosure of the
nature, amount, timing, and uncertainty of revenue and cash flows arising from contracts with customers. The Company applies the following
five-step model in order to determine this amount:
(i)
Identify contract with customer;
(ii)
Identify distinct performance obligations in contract, including promises if any;
(iii)
Measurement of the transaction price, including the constraint on variable consideration;
(iv)
Allocation of the transaction price to the performance obligations; and
(v)
Recognition of revenue when (or as) the Company satisfies each performance obligation.
Cost
of revenue
Cost
of revenue includes direct costs associated with provision of services such as development costs, purchases of third-party software,
maintenance fees and consultation fees.
Income
tax expense
Income
taxes are determined in accordance with the provisions of ASC Topic 740, “Income Taxes” (“ASC Topic 740”). Under
this method, deferred tax assets and liabilities are recognized for the future tax consequences attributable to differences between the
financial statement carrying amounts of existing assets and liabilities and their respective tax basis. Deferred tax assets and liabilities
are measured using enacted income tax rates expected to apply to taxable income in the years in which those temporary differences are
expected to be recovered or settled. Any effect on deferred tax assets and liabilities of a change in tax rates is recognized in income
in the period that includes the enactment date.
ASC
740 prescribes a comprehensive model for how companies should recognize, measure, present, and disclosed in their financial statements
uncertain tax positions taken or expected to be taken on a tax return. Under ASC 740, tax positions must initially be recognized in the
financial statements when it is more likely than not the position will be sustained upon examination by the tax authorities. Such tax
positions must initially and subsequently be measured as the largest amount of tax benefit that has a greater than 50% likelihood of
being realized upon ultimate settlement with the tax authority assuming full knowledge of the position and relevant facts.
The
Company conducts major businesses in Malaysia and is subject to tax in their own jurisdictions. As a result of its business activities,
the Company will file separate tax returns that are subject to examination by the foreign tax authorities.
Going concern
The accompanying financial statements have been prepared
on a going concern basis, which contemplates the realization of assets and the settlement of liabilities and commitments in the normal
course of business.
As reflected in the accompanying financial statements,
for the nine months ended September 30, 2023, the Company incurred a net loss of $418,304 and negative operating cash flow of $282,345.
These factors raise substantial doubt about the Company’s ability to continue as a going concern within one year of the date that
the financial statements are issued.
The Company does not have sufficient revenue to cover
its operating cost due to the research and development activities performed in the initial stage. The Company’s ability to continue
as a going concern is dependent upon improving its profitability and the continuing financial support from its major shareholders. Management
believes the existing shareholders or external financing will provide the additional cash to meet the Company’s obligations as they
become due.
No assurance can be given that any future financing,
if needed, will be available. These and other factors raise substantial doubt about the Company’s ability to continue as a going
concern. These financial statements do not include any adjustments to reflect the possible future effects on the recoverability in profitability
that may result in the Company not being able to continue as a going concern.
Foreign
currencies translation
Transactions
denominated in currencies other than the functional currency are translated into the functional currency at the exchange rates prevailing
at the dates of the transaction. Monetary assets and liabilities denominated in currencies other than the functional currency are translated
into the functional currency using the applicable exchange rates at the balance sheet dates. The resulting exchange differences are recorded
in the statement of operations and comprehensive income (loss).
The
functional currency of the Company is the United States Dollars (“US$”) and the accompanying financial statements have been
expressed in US$. In addition, the Company’s subsidiary maintains its books and record in Malaysia Ringgits (“MYR”),
United States Dollars (“US$”) and Hong Kong Dollars (“HK$”), which is the respective functional currency as being
the primary currency of the economic environment in which the entity operates.
In
general, for consolidation purposes, assets and liabilities of its subsidiaries whose functional currency is not US$ are translated into
US$, in accordance with ASC Topic 830-30, “Translation of Financial Statement”, using the exchange rate on the balance sheet
date. Revenues and expenses are translated at average rates prevailing during the period. The gains and losses resulting from translation
of financial statements of foreign subsidiary are recorded as a separate component of accumulated other comprehensive income.
Translation
of amounts from the local currency of the Company into US$1 has been made at the following exchange rates for the respective periods:
SCHEDULE OF FOREIGN EXCHANGE RATE
| | |
As of and for the period ended September 30 | |
| | |
2023 | | |
2022 | |
| Period-end MYR : US$1 exchange rate | |
| 4.70 | | |
| 4.53 | |
| Period-average MYR : US$1 exchange rate | |
| 4.53 | | |
| 4.35 | |
| Period-end HK$ : US$1 exchange rate | |
| 7.75 | | |
| 7.85 | |
| Period-average HK$ : US$1 exchange rate | |
| 7.75 | | |
| 7.84 | |
Related
parties
Parties,
which can be a corporation or individual, are considered to be related if the Company has the ability, directly or indirectly, to control
the other party or exercise significant influence over the other party in making financial and operating decisions. Companies are also
considered to be related if they are subject to common control or common significant influence.
Fair
value of financial instruments
The
carrying value of the Company’s financial instruments: cash and cash equivalents, trade receivable, deposits and other receivables,
amount due to related parties and other payables approximate at their fair values because of the short-term nature of these financial
instruments.
The
Company also follows the guidance of the ASC Topic 820-10, “Fair Value Measurements and Disclosures” (“ASC 820-10”),
with respect to financial assets and liabilities that are measured at fair value. ASC 820-10 establishes a three-tier fair value hierarchy
that prioritizes the inputs used in measuring fair value as follows:
Level
1 : Observable inputs such as quoted prices in active markets;
Level
2 : Inputs, other than the quoted prices in active markets, that are observable either directly or indirectly; and
Level
3 : Unobservable inputs in which there is little or no market data, which require the reporting entity to develop its own assumptions.
As
of September 30, 2023, the Company did not have any nonfinancial assets and liabilities that are recognized or disclosed at fair value
in the financial statements, at least annually, on a recurring basis, nor did the Company have any assets or liabilities measured at
fair value on a non-recurring basis.
Net
Income/(Loss) per Share
The
Company calculates net income/(loss) per share in accordance with ASC Topic 260, “Earnings per Share”. Basic income/(loss)
per share is computed by dividing the net income/(loss) by the weighted-average number of common shares outstanding during the period.
Diluted income per share is computed similar to basic income/(loss) per share except that the denominator is increased to include the
number of additional common shares that would have been outstanding if the potential common stock equivalents had been issued and if
the additional common shares were dilutive.
Lease
The
Company offices for fixed periods pre-emptive extension options. The Company recognizes lease payments for its short-term lease on a
straight-line basis over the lease term.
Lease
liability is initially and subsequently measured at the present value of the unpaid lease payments at the lease commencement date. The
right-of-use asset is initially measured at cost, which comprises the initial amount of the lease liability adjusted for lease payments
made at or before the lease commencement date, plus any initial direct costs incurred less any lease incentives received. Costs associated
with operating lease assets are recognized on a straight-line basis within operating expenses over the term of the lease.
In
determining the present value of the unpaid lease payments, ASC 842 requires a lessee to discount its unpaid lease payments using the
interest rate implicit in the lease or, if that rate cannot be readily determined, its incremental borrowing rate. As most of the Company
leases do not provide an implicit rate, the Company uses its incremental borrowing rate as the discount rate for the lease. The Company
incremental borrowing rate is estimated to approximate the interest rate on a collateralized basis with similar terms and payments.
Acquisition
Agreement
The
acquisition of StarFIN Holdings Limited. (“SFHL”) has been accounted for under the purchase method of accounting in accordance
with Statement of Financial Accounting Standards No. 141, “Business Combinations”. Under the purchase method of accounting,
the purchase price is allocated to the assets acquired and liabilities assumed based on their estimated fair values.
The
allocation of the purchase price has been prepared based on preliminary estimates of fair values. However, actual amounts recorded upon
the finalization of estimates of fair values may differ from the information presented in these unaudited pro forma condensed combined
consolidated financial statements. The Company estimates of the fair values of the assets and liabilities of SFHL have been combined
with the recorded values of the assets and liabilities of SFHL in the audited condensed combined financial information, goodwill was
immediately impaired upon recognition.
Recently
Adopted Accounting Standards
In
June 2016, the FASB issued Accounting Standards Update No. 2016-13, Financial Instruments—Credit Losses (Topic 326): Measurement
of Credit Losses on Financial Instruments, which introduced the expected credit losses methodology for the measurement of credit losses
on financial assets measured at amortized cost basis, replacing the previous incurred loss methodology. In November 2019, the FASB issued
ASU 2019-10 highlighted the adoption timeline. For smaller reporting entities, Topic 326 is effective for annual periods beginning after
December 15, 2022, including interim periods within those fiscal years, of which is effective for the Company on January 1, 2023.
Credit
loss rate is determined by historical collection based on aging schedule, adjusted for current conditions using reasonable and supportable
forecasts. Based on the aging categorization and the adjusted loss rate per category, an allowance for credit losses is calculated by
multiplying the adjusted loss rate with the amortized cost in the respective age category.
Recently
Issued Accounting Standards
The
Company reviews new accounting standards as issued. Management has not identified any other new standards that it believes will have
a significant impact on the Company’s financial statements.
|
| X |
- References
+ Details
| Name: |
us-gaap_AccountingPoliciesAbstract |
| Namespace Prefix: |
us-gaap_ |
| Data Type: |
xbrli:stringItemType |
| Balance Type: |
na |
| Period Type: |
duration |
|
| X |
- DefinitionThe entire disclosure for all significant accounting policies of the reporting entity. Reference 1: http://www.xbrl.org/2003/role/disclosureRef
-Topic 235
-SubTopic 10
-Name Accounting Standards Codification
-Section 50
-Paragraph 1
-Publisher FASB
-URI https://asc.fasb.org//1943274/2147483426/235-10-50-1
Reference 2: http://fasb.org/us-gaap/role/ref/legacyRef
-Topic 235
-Name Accounting Standards Codification
-Publisher FASB
-URI https://asc.fasb.org//235/tableOfContent
| Name: |
us-gaap_SignificantAccountingPoliciesTextBlock |
| Namespace Prefix: |
us-gaap_ |
| Data Type: |
dtr-types:textBlockItemType |
| Balance Type: |
na |
| Period Type: |
duration |
|
v3.23.3
BUSINESS COMBINATIONS
|
9 Months Ended |
Sep. 30, 2023 |
|---|
| Business Combination and Asset Acquisition [Abstract] |
|
| BUSINESS COMBINATIONS |
3.
BUSINESS COMBINATIONS
On
December 22, 2022, the Company acquired 100% equity interest in StarFIN Holdings Limited in exchange, the Company issue 8,232,038 restricted
shares of the Company’s common stock, valued at $9,055,242. The consideration was derived from an agreed valuation of SFHL at $9,055,242.
The acquisition was consummated on January 20, 2023.
The
acquisition of SFHL has been accounted for under the purchase method of accounting in accordance with Statement of Financial Accounting
Standards No. 141, “Business Combinations.” Under the purchase method of accounting, the purchase price is allocated to the
assets acquired and liabilities assumed based on their estimated fair values.
The
allocation of the purchase price has been prepared based on preliminary estimates of fair values. However, actual amounts recorded upon
the finalization of estimates of fair values may differ from the information presented in these unaudited pro forma condensed combined
consolidated financial statements. The Company estimates of the fair values of the assets and liabilities of SFHL have been combined
with the recorded values of the assets and liabilities of SFHL in the audited condensed combined financial information, goodwill was
immediately impaired upon recognition. Allocation of the purchase price is summarized below:
SCHEDULE
OF PURCHASE PRICE ALLOCATION
| | |
| | |
| Cash and cash equivalents | |
$ | 705,480 | |
| Trade receivables, net | |
| 676,396 | |
| Deposits paid, prepayments and other receivables | |
| 202,414 | |
| Tax assets | |
| 539,969 | |
| Investment in Associates – Murni StarFIN Sdn Bhd | |
| 8,657 | |
| Property, plant and equipment, net | |
| 585,816 | |
| Trade payable | |
| (24,736 | ) |
| Accrued expenses and other payables | |
| (734,476 | ) |
| Deferred tax liabilities | |
| (213,524 | ) |
| Hire purchase loan | |
| (16,554 | ) |
| Amount due to directors | |
| (283,703 | ) |
| Amount due to related parties | |
| (1,673 | ) |
| Adjustment for foreign exchange fluctuation | |
| 260,052 | |
| Fair value of StarFIN Holdings Limited | |
$ | 1,704,118 | |
| Fair value of consideration | |
| (9,055,242 | ) |
| Goodwill | |
$ | 7,351,124 | |
| Goodwill impairment | |
| (7,351,124 | ) |
|
| X |
- References
+ Details
| Name: |
us-gaap_BusinessCombinationAndAssetAcquisitionAbstract |
| Namespace Prefix: |
us-gaap_ |
| Data Type: |
xbrli:stringItemType |
| Balance Type: |
na |
| Period Type: |
duration |
|
| X |
- DefinitionThe entire disclosure for a business combination (or series of individually immaterial business combinations) completed during the period, including background, timing, and recognized assets and liabilities. The disclosure may include leverage buyout transactions (as applicable). Reference 1: http://www.xbrl.org/2003/role/disclosureRef
-Topic 805
-SubTopic 20
-Name Accounting Standards Codification
-Section 50
-Paragraph 5
-Subparagraph (b)
-Publisher FASB
-URI https://asc.fasb.org//1943274/2147479907/805-20-50-5
Reference 2: http://fasb.org/us-gaap/role/ref/legacyRef
-Topic 805
-Name Accounting Standards Codification
-Publisher FASB
-URI https://asc.fasb.org//805/tableOfContent
| Name: |
us-gaap_BusinessCombinationDisclosureTextBlock |
| Namespace Prefix: |
us-gaap_ |
| Data Type: |
dtr-types:textBlockItemType |
| Balance Type: |
na |
| Period Type: |
duration |
|
v3.23.3
TRADE RECEIVABLE
|
9 Months Ended |
Sep. 30, 2023 |
|---|
| Credit Loss [Abstract] |
|
| TRADE RECEIVABLE |
4.
TRADE RECEIVABLE
SCHEDULE OF TRADE RECEIVABLE
| | |
As of September 30, 2023 | | |
As of December 31, 2022 | |
| Trade receivable, gross | |
$ | 612,461 | | |
$ | - | |
| Allowance for expected credit loss | |
| (82,220 | ) | |
| - | |
| Trade receivable, net | |
$ | 530,241 | | |
$ | - | |
|
| X |
- DefinitionThe entire disclosure for accounts receivable, contract receivable, receivable held-for-sale, and nontrade receivable. Reference 1: http://www.xbrl.org/2003/role/disclosureRef
-Topic 310
-Name Accounting Standards Codification
-Publisher FASB
-URI https://asc.fasb.org//310/tableOfContent
Reference 2: http://www.xbrl.org/2003/role/disclosureRef
-Topic 326
-Name Accounting Standards Codification
-Publisher FASB
-URI https://asc.fasb.org//326/tableOfContent
| Name: |
us-gaap_AccountsAndNontradeReceivableTextBlock |
| Namespace Prefix: |
us-gaap_ |
| Data Type: |
dtr-types:textBlockItemType |
| Balance Type: |
na |
| Period Type: |
duration |
|
| X |
- References
+ Details
| Name: |
us-gaap_CreditLossAbstract |
| Namespace Prefix: |
us-gaap_ |
| Data Type: |
xbrli:stringItemType |
| Balance Type: |
na |
| Period Type: |
duration |
|
v3.23.3
PREPAYMENT, DEPOSITS AND OTHER RECEIVABLES
|
9 Months Ended |
Sep. 30, 2023 |
|---|
| Prepayment Deposits And Other Receivables |
|
| PREPAYMENT, DEPOSITS AND OTHER RECEIVABLES |
5.
PREPAYMENT, DEPOSITS AND OTHER RECEIVABLES
SCHEDULE OF PREPAID EXPENSES AND DEPOSITS AND OTHER RECEIVABLES
| | |
As of September 30, 2023 | | |
As of December 31, 2022 | |
| Prepaid expenses | |
| 109,044 | | |
| - | |
| Other receivables | |
| 353 | | |
| 3,000 | |
| Other deposits | |
| 30,419 | | |
| - | |
| Total | |
$ | 139,816 | | |
$ | 3,000 | |
The
rental deposits represent the deposit of the tenancy agreements.
Prepaid
expenses include website domain, third party software maintenance and subscription, rental, employee and motor vehicle insurance.
Other
receivables includes receivables from management of car park for director and employees.
Other
deposits primarily consist of deposit made for security deposit for renovation.
|
| X |
- References
+ Details
| Name: |
ASFH_DisclosurePrepaymentDepositsAndOtherReceivablesAbstract |
| Namespace Prefix: |
ASFH_ |
| Data Type: |
xbrli:stringItemType |
| Balance Type: |
na |
| Period Type: |
duration |
|
| X |
- DefinitionPrepaid expenses and deposits [text block]
| Name: |
ASFH_PrepaidExpensesAndDepositsTextBlock |
| Namespace Prefix: |
ASFH_ |
| Data Type: |
dtr-types:textBlockItemType |
| Balance Type: |
na |
| Period Type: |
duration |
|
v3.23.3
PROPERTY, PLANT AND EQUIPMENT, NET
|
9 Months Ended |
Sep. 30, 2023 |
|---|
| Property, Plant and Equipment [Abstract] |
|
| PROPERTY, PLANT AND EQUIPMENT, NET |
6.
PROPERTY, PLANT AND EQUIPMENT, NET
SCHEDULE OF PLANT AND EQUIPMENT
| | |
As of September 30, 2023 | | |
As of December 31, 2022 | |
| Computer systems | |
$ | 253,420 | | |
$ | - | |
| Furniture and fittings | |
| 78,128 | | |
| - | |
| Electrical fittings | |
| 9,587 | | |
| - | |
| Handphone | |
| 48,358 | | |
| - | |
| Office equipment | |
| 91,146 | | |
| - | |
| Renovation | |
| 81,221 | | |
| - | |
| Motor vehicle | |
| 356,492 | | |
| - | |
| Property | |
| 394,019 | | |
| - | |
| Total property, plant and equipment | |
$ | 1,312,371 | | |
$ | - | |
| Less: Accumulated depreciation | |
| (792,408 | ) | |
| - | |
| Total property, plant and equipment, net | |
$ | 519,963 | | |
$ | - | |
SCHEDULE OF INVESTMENT IN PROPERTY AND PLANT
| | |
For nine months
ended
September 30,
2023 | | |
For the year
ended
December 31,
2022 | |
| Investment in computer systems | |
$ | 17,479 | | |
$ | - | |
| Investment in furniture and fittings | |
| 374 | | |
| - | |
| Investment in electrical fittings | |
| 280 | | |
| - | |
| Investment in handphone | |
| 1,874 | | |
| - | |
| Investment in office equipment | |
| 6,216 | | |
| - | |
| Investment in renovation | |
| 4,097 | | |
| - | |
| Total investment in property and plant | |
$ | 30,320 | | |
$ | - | |
| | |
| | | |
| | |
| Depreciation for the period | |
| 34,234 | | |
$ | - | |
For
the year ended December 31, 2022, the Company acquired a property amounted $420,225 financed through loan from director which is unsecured,
non-interest bearing and payable on demand and cash in hand.
|
| X |
- References
+ Details
| Name: |
us-gaap_PropertyPlantAndEquipmentAbstract |
| Namespace Prefix: |
us-gaap_ |
| Data Type: |
xbrli:stringItemType |
| Balance Type: |
na |
| Period Type: |
duration |
|
| X |
- DefinitionThe entire disclosure for long-lived, physical asset used in normal conduct of business and not intended for resale. Includes, but is not limited to, work of art, historical treasure, and similar asset classified as collections. Reference 1: http://fasb.org/us-gaap/role/ref/legacyRef
-Topic 360
-Name Accounting Standards Codification
-Publisher FASB
-URI https://asc.fasb.org//360/tableOfContent
Reference 2: http://www.xbrl.org/2003/role/disclosureRef
-Name Accounting Standards Codification
-Section 50
-Paragraph 6
-SubTopic 360
-Topic 958
-Publisher FASB
-URI https://asc.fasb.org//1943274/2147480321/958-360-50-6
Reference 3: http://www.xbrl.org/2003/role/disclosureRef
-Name Accounting Standards Codification
-Section 50
-Paragraph 1
-Subparagraph (d)
-SubTopic 360
-Topic 958
-Publisher FASB
-URI https://asc.fasb.org//1943274/2147480321/958-360-50-1
Reference 4: http://www.xbrl.org/2003/role/disclosureRef
-Name Accounting Standards Codification
-Section 50
-Paragraph 7
-SubTopic 360
-Topic 958
-Publisher FASB
-URI https://asc.fasb.org//1943274/2147480321/958-360-50-7
| Name: |
us-gaap_PropertyPlantAndEquipmentDisclosureTextBlock |
| Namespace Prefix: |
us-gaap_ |
| Data Type: |
dtr-types:textBlockItemType |
| Balance Type: |
na |
| Period Type: |
duration |
|
v3.23.3
OTHER PAYABLES AND ACCRUED LIABILITIES
|
9 Months Ended |
Sep. 30, 2023 |
|---|
| Other Payables And Accrued Liabilities |
|
| OTHER PAYABLES AND ACCRUED LIABILITIES |
7.
OTHER PAYABLES AND ACCRUED LIABILITIES
SCHEDULE OF ACCRUED EXPENSES AND OTHER PAYABLES
| | |
As of September 30, 2023 | | |
As of December 31, 2022 | |
| Accrued expenses | |
$ | 205,112 | | |
$ | 17,805 | |
| Other payable | |
| 40,907 | | |
| - | |
| Receipt in advance | |
| 303,888 | | |
| - | |
| Total | |
$ | 549,907 | | |
$ | 17,805 | |
Accrued
expenses consist of outstanding audit fee, employee claims and salary, service tax and miscellaneous expenses.
Other
payable includes primarily service tax payable.
Receipt
in advance consist of monies received from customer but have yet to satisfied performance obligation.
|
| X |
- References
+ Details
| Name: |
ASFH_DisclosureOtherPayablesAndAccruedLiabilitiesAbstract |
| Namespace Prefix: |
ASFH_ |
| Data Type: |
xbrli:stringItemType |
| Balance Type: |
na |
| Period Type: |
duration |
|
| X |
- DefinitionOther payables and accrued expenses [Text block]
| Name: |
ASFH_OtherPayablesAndAccruedExpensesTextBlock |
| Namespace Prefix: |
ASFH_ |
| Data Type: |
dtr-types:textBlockItemType |
| Balance Type: |
na |
| Period Type: |
duration |
|
v3.23.3
AMOUNT DUE TO DIRECTOR
|
9 Months Ended |
Sep. 30, 2023 |
|---|
| Deferred Compensation Arrangement with Individual, Excluding Share-Based Payments and Postretirement Benefits [Line Items] |
|
| AMOUNT DUE TO DIRECTOR |
12.
RELATED PARTY TRANSACTIONS
For the nine months ended September 30, 2023 and 2022, the Company has following transactions with related parties:
SCHEDULE
OF RELATED PARTIES TRANSACTIONS
| | |
Nine months ended September 30, 2023 | | |
Nine months ended September 30, 2022 | |
| Purchases | |
| | | |
| | |
| - Insite MY International, Inc. | |
$ | 92,632 | | |
$ | - | |
| | |
| | | |
| | |
| Total | |
$ | 92,632 | | |
$ | - | |
Our Chief Executive Officer, Mr. Wong Kai Cheong is a majority shareholder of Insite MY International, Inc.
|
| Director [Member] |
|
| Deferred Compensation Arrangement with Individual, Excluding Share-Based Payments and Postretirement Benefits [Line Items] |
|
| AMOUNT DUE TO DIRECTOR |
8.
AMOUNT DUE TO DIRECTOR
As
of September 30, 2023, the company had an outstanding amount due to director amounted $221,038, mainly consist of a loan from Mr. Wong
Kai Cheng for the acquisition of property.
Aforementioned
amount is unsecured, non-interest bearing and payable on demand.
|
| X |
- DefinitionLine items represent financial concepts included in a table. These concepts are used to disclose reportable information associated with domain members defined in one or many axes to the table.
| Name: |
us-gaap_DeferredCompensationArrangementWithIndividualExcludingShareBasedPaymentsAndPostretirementBenefitsLineItems |
| Namespace Prefix: |
us-gaap_ |
| Data Type: |
xbrli:stringItemType |
| Balance Type: |
na |
| Period Type: |
duration |
|
| X |
- DefinitionThe entire disclosure for related party transactions. Examples of related party transactions include transactions between (a) a parent company and its subsidiary; (b) subsidiaries of a common parent; (c) and entity and its principal owners; and (d) affiliates. Reference 1: http://www.xbrl.org/2003/role/disclosureRef
-Topic 946
-SubTopic 20
-Name Accounting Standards Codification
-Section 50
-Paragraph 2
-Publisher FASB
-URI https://asc.fasb.org//1943274/2147480990/946-20-50-2
Reference 2: http://www.xbrl.org/2003/role/disclosureRef
-Topic 946
-SubTopic 20
-Name Accounting Standards Codification
-Section 50
-Paragraph 5
-Publisher FASB
-URI https://asc.fasb.org//1943274/2147480990/946-20-50-5
Reference 3: http://www.xbrl.org/2003/role/disclosureRef
-Topic 946
-SubTopic 20
-Name Accounting Standards Codification
-Section 50
-Paragraph 6
-Publisher FASB
-URI https://asc.fasb.org//1943274/2147480990/946-20-50-6
Reference 4: http://www.xbrl.org/2003/role/disclosureRef
-Topic 946
-SubTopic 235
-Name Accounting Standards Codification
-Section 50
-Paragraph 2
-Subparagraph (c)
-Publisher FASB
-URI https://asc.fasb.org//1943274/2147481062/946-235-50-2
Reference 5: http://www.xbrl.org/2003/role/disclosureRef
-Topic 946
-SubTopic 235
-Name Accounting Standards Codification
-Section 50
-Paragraph 2
-Subparagraph (e)
-Publisher FASB
-URI https://asc.fasb.org//1943274/2147481062/946-235-50-2
Reference 6: http://www.xbrl.org/2003/role/disclosureRef
-Topic 850
-SubTopic 10
-Name Accounting Standards Codification
-Section 50
-Paragraph 1
-Subparagraph (d)
-Publisher FASB
-URI https://asc.fasb.org//1943274/2147483326/850-10-50-1
Reference 7: http://www.xbrl.org/2003/role/disclosureRef
-Topic 946
-SubTopic 220
-Name Accounting Standards Codification
-Section S99
-Paragraph 1
-Subparagraph (SX 210.6-07(2)(g)(3))
-Publisher FASB
-URI https://asc.fasb.org//1943274/2147483575/946-220-S99-1
Reference 8: http://www.xbrl.org/2003/role/disclosureRef
-Topic 946
-SubTopic 220
-Name Accounting Standards Codification
-Section S99
-Paragraph 1
-Subparagraph (SX 210.6-07(2)(c))
-Publisher FASB
-URI https://asc.fasb.org//1943274/2147483575/946-220-S99-1
Reference 9: http://www.xbrl.org/2003/role/disclosureRef
-Topic 946
-SubTopic 220
-Name Accounting Standards Codification
-Section S99
-Paragraph 1
-Subparagraph (SX 210.6-07(2)(e))
-Publisher FASB
-URI https://asc.fasb.org//1943274/2147483575/946-220-S99-1
Reference 10: http://www.xbrl.org/2003/role/disclosureRef
-Topic 850
-Name Accounting Standards Codification
-Publisher FASB
-URI https://asc.fasb.org//850/tableOfContent
Reference 11: http://www.xbrl.org/2003/role/disclosureRef
-Topic 850
-SubTopic 10
-Name Accounting Standards Codification
-Section 50
-Paragraph 6
-Publisher FASB
-URI https://asc.fasb.org//1943274/2147483326/850-10-50-6
Reference 12: http://www.xbrl.org/2003/role/disclosureRef
-Topic 850
-SubTopic 10
-Name Accounting Standards Codification
-Section 50
-Paragraph 1
-Subparagraph (a)
-Publisher FASB
-URI https://asc.fasb.org//1943274/2147483326/850-10-50-1
Reference 13: http://www.xbrl.org/2003/role/disclosureRef
-Topic 850
-SubTopic 10
-Name Accounting Standards Codification
-Section 50
-Paragraph 1
-Subparagraph (b)
-Publisher FASB
-URI https://asc.fasb.org//1943274/2147483326/850-10-50-1
| Name: |
us-gaap_RelatedPartyTransactionsDisclosureTextBlock |
| Namespace Prefix: |
us-gaap_ |
| Data Type: |
dtr-types:textBlockItemType |
| Balance Type: |
na |
| Period Type: |
duration |
|
| X |
- Details
| Name: |
srt_TitleOfIndividualAxis=srt_DirectorMember |
| Namespace Prefix: |
|
| Data Type: |
na |
| Balance Type: |
|
| Period Type: |
|
|
v3.23.3
AMOUNT DUE TO A RELATED PARTIES
|
9 Months Ended |
Sep. 30, 2023 |
|---|
| Amount Due To Related Parties |
|
| AMOUNT DUE TO A RELATED PARTIES |
9.
AMOUNT DUE TO A RELATED PARTIES
As
of September 30, 2023, the Company has an outstanding amount due to a number of related companies with common director and shareholder
pertaining to miscellaneous expenses made by these related parties on behalf in aggregate amounted $978.
Aforementioned
amount is unsecured, non-interest bearing and payable on demand.
For
the nine months ended September 30, 2023, the Company has paid $69,366 to Ms. Tan Siew Meng, spouse of our Chief Executive Officer, Mr.
Wong Kai Cheong pertaining to leasing of office space.
|
| X |
- References
+ Details
| Name: |
ASFH_AmountDueToRelatedPartiesDisclosureTextBlock |
| Namespace Prefix: |
ASFH_ |
| Data Type: |
dtr-types:textBlockItemType |
| Balance Type: |
na |
| Period Type: |
duration |
|
v3.23.3
HIRE PURCHASE
|
9 Months Ended |
Sep. 30, 2023 |
|---|
| Hire Purchase |
|
| HIRE PURCHASE |
10.
HIRE PURCHASE
On
April 30, 2021, the Company through subsidiary acquired a motor vehicle amounted $69,148 financed by $36,006 hire purchase loan for 36
months at a fixed flat rate of 1.88% per annum with first installment commencing June 5, 2021 and monthly installment amounted approximately
$1,063. Remaining balance finance through cash in hand.
For
the nine months ended September 30, 2023, the Company repaid $8,405 in hire purchase loan with an outstanding $7,406 as of September
30, 2023.
Maturities
of the loan for each of the two years and thereafter are as follows:
SCHEDULE OF MATURITIES OF THE LOAN
| Year ending December 31 | |
| | |
| 2023 | |
$ | 2,756 | |
| 2024 | |
$ | 4,650 | |
| Total | |
$ | 7,406 | |
|
| X |
- References
+ Details
| Name: |
ASFH_DisclosureHirePurchaseAbstract |
| Namespace Prefix: |
ASFH_ |
| Data Type: |
xbrli:stringItemType |
| Balance Type: |
na |
| Period Type: |
duration |
|
| X |
- DefinitionHire Purchase [Text Block]
| Name: |
ASFH_HirePurchaseTextBlock |
| Namespace Prefix: |
ASFH_ |
| Data Type: |
dtr-types:textBlockItemType |
| Balance Type: |
na |
| Period Type: |
duration |
|
v3.23.3
LEASE RIGHT-OF-USE ASSET AND LEASE LIABILITIES
|
9 Months Ended |
Sep. 30, 2023 |
|---|
| Lease Right-of-use Asset And Lease Liabilities |
|
| LEASE RIGHT-OF-USE ASSET AND LEASE LIABILITIES |
11.
LEASE RIGHT-OF-USE ASSET AND LEASE LIABILITIES
SCHEDULE OF LEASE RIGHT OF USE ASSETS AND LEASE LIABILITIES
| Right-Of-Use Assets | |
| | |
| Purchase price allocation pertaining to acquisition of StarFIN Holdings Limited | |
$ | 134,807 | |
| New lease recognized | |
| 16,513 | |
| Amortization for the nine months ended September 30, 2023 | |
| (65,252 | ) |
| Adjustment for foreign currency translation difference | |
| (6,161 | ) |
| Balance as of September 30, 2023 | |
$ | 79,907 | |
| | |
| | |
| Lease Liability | |
| | |
| Purchase price allocation pertaining to acquisition of StarFIN Holdings Limited | |
$ | 134,807 | |
| New lease recognized | |
| 16,513 | |
| Imputed interest for nine months ended September 30, 2023 | |
| 4,114 | |
| Gross repayment for nine months ended September 30, 2023 | |
| (69,366 | ) |
| Adjustment for foreign currency translation difference | |
| (6,161 | ) |
| Balance as of September 30, 2023 | |
| 79,907 | |
| | |
| | |
| Lease liability current portion | |
| 74,204 | |
| Lease liability non-current portion | |
$ | 5,703 | |
Other
information:
SCHEDULE OF OTHER INFORMATION
| | |
Nine months ended
September 30, 2023 | | |
Nine months ended
September 30, 2022 | |
| Cash paid for amounts included in the measurement of lease liabilities: | |
| | | |
| | |
| Operating cash flow to operating lease | |
$ | 69,366 | | |
$ | - | |
| Right-of-use assets obtained in exchange for operating lease liabilities | |
| - | | |
| - | |
| Remaining lease term for operating lease (years) | |
| 1.02 | | |
| - | |
| Weighted average discount rate for operating lease | |
| 5.40 | % | |
| - | % |
|
| X |
- References
+ Details
| Name: |
ASFH_DisclosureLeaseRightofuseAssetAndLeaseLiabilitiesAbstract |
| Namespace Prefix: |
ASFH_ |
| Data Type: |
xbrli:stringItemType |
| Balance Type: |
na |
| Period Type: |
duration |
|
| X |
- DefinitionThe entire disclosure for operating leases of lessee. Includes, but is not limited to, description of operating lease and maturity analysis of operating lease liability. Reference 1: http://www.xbrl.org/2003/role/disclosureRef
-Topic 842
-SubTopic 20
-Name Accounting Standards Codification
-Publisher FASB
-URI https://asc.fasb.org//842-20/tableOfContent
| Name: |
us-gaap_LesseeOperatingLeasesTextBlock |
| Namespace Prefix: |
us-gaap_ |
| Data Type: |
dtr-types:textBlockItemType |
| Balance Type: |
na |
| Period Type: |
duration |
|
v3.23.3
RELATED PARTY TRANSACTIONS
|
9 Months Ended |
Sep. 30, 2023 |
|---|
| Related Party Transactions [Abstract] |
|
| RELATED PARTY TRANSACTIONS |
12.
RELATED PARTY TRANSACTIONS
For the nine months ended September 30, 2023 and 2022, the Company has following transactions with related parties:
SCHEDULE
OF RELATED PARTIES TRANSACTIONS
| | |
Nine months ended September 30, 2023 | | |
Nine months ended September 30, 2022 | |
| Purchases | |
| | | |
| | |
| - Insite MY International, Inc. | |
$ | 92,632 | | |
$ | - | |
| | |
| | | |
| | |
| Total | |
$ | 92,632 | | |
$ | - | |
Our Chief Executive Officer, Mr. Wong Kai Cheong is a majority shareholder of Insite MY International, Inc.
|
| X |
- DefinitionThe entire disclosure for related party transactions. Examples of related party transactions include transactions between (a) a parent company and its subsidiary; (b) subsidiaries of a common parent; (c) and entity and its principal owners; and (d) affiliates. Reference 1: http://www.xbrl.org/2003/role/disclosureRef
-Topic 946
-SubTopic 20
-Name Accounting Standards Codification
-Section 50
-Paragraph 2
-Publisher FASB
-URI https://asc.fasb.org//1943274/2147480990/946-20-50-2
Reference 2: http://www.xbrl.org/2003/role/disclosureRef
-Topic 946
-SubTopic 20
-Name Accounting Standards Codification
-Section 50
-Paragraph 5
-Publisher FASB
-URI https://asc.fasb.org//1943274/2147480990/946-20-50-5
Reference 3: http://www.xbrl.org/2003/role/disclosureRef
-Topic 946
-SubTopic 20
-Name Accounting Standards Codification
-Section 50
-Paragraph 6
-Publisher FASB
-URI https://asc.fasb.org//1943274/2147480990/946-20-50-6
Reference 4: http://www.xbrl.org/2003/role/disclosureRef
-Topic 946
-SubTopic 235
-Name Accounting Standards Codification
-Section 50
-Paragraph 2
-Subparagraph (c)
-Publisher FASB
-URI https://asc.fasb.org//1943274/2147481062/946-235-50-2
Reference 5: http://www.xbrl.org/2003/role/disclosureRef
-Topic 946
-SubTopic 235
-Name Accounting Standards Codification
-Section 50
-Paragraph 2
-Subparagraph (e)
-Publisher FASB
-URI https://asc.fasb.org//1943274/2147481062/946-235-50-2
Reference 6: http://www.xbrl.org/2003/role/disclosureRef
-Topic 850
-SubTopic 10
-Name Accounting Standards Codification
-Section 50
-Paragraph 1
-Subparagraph (d)
-Publisher FASB
-URI https://asc.fasb.org//1943274/2147483326/850-10-50-1
Reference 7: http://www.xbrl.org/2003/role/disclosureRef
-Topic 946
-SubTopic 220
-Name Accounting Standards Codification
-Section S99
-Paragraph 1
-Subparagraph (SX 210.6-07(2)(g)(3))
-Publisher FASB
-URI https://asc.fasb.org//1943274/2147483575/946-220-S99-1
Reference 8: http://www.xbrl.org/2003/role/disclosureRef
-Topic 946
-SubTopic 220
-Name Accounting Standards Codification
-Section S99
-Paragraph 1
-Subparagraph (SX 210.6-07(2)(c))
-Publisher FASB
-URI https://asc.fasb.org//1943274/2147483575/946-220-S99-1
Reference 9: http://www.xbrl.org/2003/role/disclosureRef
-Topic 946
-SubTopic 220
-Name Accounting Standards Codification
-Section S99
-Paragraph 1
-Subparagraph (SX 210.6-07(2)(e))
-Publisher FASB
-URI https://asc.fasb.org//1943274/2147483575/946-220-S99-1
Reference 10: http://www.xbrl.org/2003/role/disclosureRef
-Topic 850
-Name Accounting Standards Codification
-Publisher FASB
-URI https://asc.fasb.org//850/tableOfContent
Reference 11: http://www.xbrl.org/2003/role/disclosureRef
-Topic 850
-SubTopic 10
-Name Accounting Standards Codification
-Section 50
-Paragraph 6
-Publisher FASB
-URI https://asc.fasb.org//1943274/2147483326/850-10-50-6
Reference 12: http://www.xbrl.org/2003/role/disclosureRef
-Topic 850
-SubTopic 10
-Name Accounting Standards Codification
-Section 50
-Paragraph 1
-Subparagraph (a)
-Publisher FASB
-URI https://asc.fasb.org//1943274/2147483326/850-10-50-1
Reference 13: http://www.xbrl.org/2003/role/disclosureRef
-Topic 850
-SubTopic 10
-Name Accounting Standards Codification
-Section 50
-Paragraph 1
-Subparagraph (b)
-Publisher FASB
-URI https://asc.fasb.org//1943274/2147483326/850-10-50-1
| Name: |
us-gaap_RelatedPartyTransactionsDisclosureTextBlock |
| Namespace Prefix: |
us-gaap_ |
| Data Type: |
dtr-types:textBlockItemType |
| Balance Type: |
na |
| Period Type: |
duration |
|
v3.23.3
CONCENTRATION OF RISK
|
9 Months Ended |
Sep. 30, 2023 |
|---|
| Risks and Uncertainties [Abstract] |
|
| CONCENTRATION OF RISK |
13. CONCENTRATION OF RISK
For
the three months ended September 30, 2023, the Company generated total revenue of $695,145, of which two customers accounted for more
than 10% of the Company’s total revenue. For the three months ended September 30, 2022, the Company does not generate any revenue
and hence there was no customer accounted for more than 10% of the Company’s revenue. The customers who accounted for more than
10% of the Company’s total revenue and its outstanding receivable balance at period-end is presented below:
SCHEDULE OF CONCENTRATION OF RISK
| | |
For the three months ended September 30 | |
| | |
2023 | | |
2022 | | |
2023 | | |
2022 | | |
2023 | | |
2022 | |
| | |
Revenue | | |
Percentage of Revenue | | |
Accounts receivable, gross | |
| | |
| | |
| | |
| | |
| | |
| | |
| |
| Customer F | |
$ | 96,312 | | |
$ | - | | |
| 14 | % | |
| - | % | |
$ | - | | |
$ | - | |
| Customer G | |
| 71,499 | | |
| - | | |
| 10 | % | |
| - | | |
| 76,696 | | |
| - | |
| Others | |
| 527,334 | | |
| - | | |
| 76 | % | |
| - | % | |
| 535,765 | | |
| - | |
| Total | |
$ | 695,145 | | |
$ | - | | |
| 100 | % | |
| - | % | |
$ | 612,461 | | |
$ | - | |
For
the nine months ended September 30, 2023, the Company generated total revenue of $1,813,426, of which no customer accounted for more
than 10% of the Company’s total revenue. For the nine months ended September 30, 2022, the Company does not generate any revenue
and hence there was no customer accounted for more than 10% of the Company’s revenue.
For
the three months ended September 30, 2023, the Company incurred cost of revenue of $33,524, of which two suppliers accounted for more
than 10% of the Company’s cost of revenue. For the three months ended September 30, 2022, the Company does not incur any cost of
revenue and hence there was no supplier accounted for more than 10% of the Company’s cost of revenue. The suppliers who accounted
for more than 10% of the Company’s cost of revenue and its outstanding payable balance at period-end is presented below:
SCHEDULE OF CONCENTRATION OF RISK
| |
|
For
the three months ended September 30 |
|
| |
|
2023 |
|
|
2022 |
|
|
2023 |
|
|
2022 |
|
|
2023 |
|
|
2022 |
|
| |
|
Cost
of revenue |
|
|
Percentage
of
Cost
of revenue |
|
|
Accounts
payable,
trade |
|
| |
|
|
|
|
|
|
|
|
|
|
|
|
|
|
|
|
|
|
| Supplier
A |
|
$ |
46,018 |
|
|
$ |
- |
|
|
|
76 |
% |
|
|
- |
% |
|
$ |
19,027 |
|
|
$ |
- |
|
| Supplier
B |
|
|
9,362 |
|
|
|
- |
|
|
|
15 |
% |
|
|
- |
% |
|
|
3,367 |
|
|
|
- |
|
| Others |
|
|
5,358 |
|
|
|
- |
|
|
|
9 |
% |
|
|
- |
% |
|
|
162 |
|
|
|
- |
|
| Total |
|
$ |
33,524 |
|
|
$ |
- |
|
|
|
100 |
% |
|
|
- |
% |
|
$ |
22,556 |
|
|
$ |
- |
|
For
the nine months ended September 30, 2023, the Company incurred cost of revenue of $147,924, of which two suppliers accounted for more
than 10% of the Company’s cost of revenue. For the nine months ended September 30, 2022, the Company does not incur any cost of
revenue and hence there was no supplier accounted for more than 10% of the Company’s cost of revenue. The suppliers who accounted
for more than 10% of the Company’s cost of revenue and its outstanding payable balance at period-end is presented below:
| | |
For the nine months ended September 30 | |
| | |
2023 | | |
2022 | | |
2023 | | |
2022 | | |
2023 | | |
2022 | |
| | |
Cost of revenue | | |
Percentage of Cost of revenue | | |
Accounts payable, trade | |
| | |
| | |
| | |
| | |
| | |
| | |
| |
| Supplier A | |
$ | 92,632 | | |
$ | - | | |
| 63 | % | |
| - | % | |
$ | 19,027 | | |
$ | - | |
| Supplier B | |
| 32,053 | | |
| - | | |
| 22 | % | |
| - | % | |
| 3,367 | | |
| - | |
| Others | |
| 23,239 | | |
| - | | |
| 15 | % | |
| - | % | |
| 162 | | |
| - | |
| Total | |
$ | 147,924 | | |
$ | - | | |
| 100 | % | |
| - | % | |
$ | 22,556 | | |
$ | - | |
Our
Chief Executive Officer, Mr. Wong Kai Cheong is a majority shareholder of Supplier A.
|
| X |
- DefinitionThe entire disclosure for any concentrations existing at the date of the financial statements that make an entity vulnerable to a reasonably possible, near-term, severe impact. This disclosure informs financial statement users about the general nature of the risk associated with the concentration, and may indicate the percentage of concentration risk as of the balance sheet date. Reference 1: http://fasb.org/us-gaap/role/ref/legacyRef
-Topic 275
-Name Accounting Standards Codification
-Publisher FASB
-URI https://asc.fasb.org//275/tableOfContent
| Name: |
us-gaap_ConcentrationRiskDisclosureTextBlock |
| Namespace Prefix: |
us-gaap_ |
| Data Type: |
dtr-types:textBlockItemType |
| Balance Type: |
na |
| Period Type: |
duration |
|
| X |
- References
+ Details
| Name: |
us-gaap_RisksAndUncertaintiesAbstract |
| Namespace Prefix: |
us-gaap_ |
| Data Type: |
xbrli:stringItemType |
| Balance Type: |
na |
| Period Type: |
duration |
|
v3.23.3
INCOME TAXES
|
9 Months Ended |
Sep. 30, 2023 |
|---|
| Income Tax Disclosure [Abstract] |
|
| INCOME TAXES |
14.
INCOME TAXES
The
loss before income taxes of the Company for the nine months ended September 30, 2023 and 2022 were comprised of the following:
SCHEDULE OF COMPONENTS OF LOSS BEFORE INCOME TAXES
| | |
| | | |
| | |
| | |
For the nine months ended September 30 | |
| | |
2023 | | |
2022 | |
| Tax jurisdictions from: | |
| | | |
| | |
| - Local | |
$ | ) | |
$ | ) |
| - Foreign, representing: | |
| | | |
| | |
| British Virginia Island (non-taxable jurisdiction) | |
| (300 | ) | |
| - | |
Provision
for income taxes consisted of the following:
SCHEDULE OF PROVISION FOR INCOME TAXES
| | |
| | | |
| | |
| | |
For the nine months ended September 30 | |
| | |
2023 | | |
2022 | |
| Current: | |
| | | |
| | |
| - Local | |
$ | - | | |
$ | - | |
| - Foreign | |
$ | (29,409 | ) | |
$ | (1,137 | ) |
| | |
| | | |
| | |
| Deferred tax assets: | |
| | | |
| | |
| - Local | |
$ | - | | |
$ | - | |
| - Foreign | |
$ | 819 | | |
$ | - | |
| | |
| | | |
| | |
| Deferred tax liabilities: | |
| | | |
| | |
| - Local | |
$ | - | | |
$ | - | |
| - Foreign | |
$ | 12,824 | | |
$ | - | |
| | |
| | | |
| | |
| Income tax payable: | |
| | | |
| | |
| - Local | |
$ | - | | |
$ | - | |
| - Foreign | |
$ | 3,357 | | |
$ | - | |
| | |
| | | |
| | |
| Income tax assets: | |
| | | |
| | |
| - Local | |
$ | - | | |
$ | - | |
| - Foreign | |
$ | 243,227 | | |
$ | - | |
All
Malaysia companies are subject to the Malaysia Corporate Tax Laws at a two-tier corporate income tax rate based on amount of paid-up
capital. The 2022 tax rate for company with paid-up capital of MYR2,500,000
(approximately $567,872) or less and
that are not part of a group containing a company exceeding this capitalization threshold is 17%
on the first MYR600,000
(approximately $136,289)
taxable profit with the remaining balance being taxed at 24%.
|
| X |
- DefinitionThe entire disclosure for income taxes. Disclosures may include net deferred tax liability or asset recognized in an enterprise's statement of financial position, net change during the year in the total valuation allowance, approximate tax effect of each type of temporary difference and carryforward that gives rise to a significant portion of deferred tax liabilities and deferred tax assets, utilization of a tax carryback, and tax uncertainties information. Reference 1: http://www.xbrl.org/2003/role/disclosureRef
-Topic 946
-SubTopic 20
-Name Accounting Standards Codification
-Section 50
-Paragraph 13
-Publisher FASB
-URI https://asc.fasb.org//1943274/2147480990/946-20-50-13
Reference 2: http://www.xbrl.org/2003/role/disclosureRef
-Topic 235
-SubTopic 10
-Name Accounting Standards Codification
-Section S99
-Paragraph 1
-Subparagraph (SX 210.4-08(h)(2))
-Publisher FASB
-URI https://asc.fasb.org//1943274/2147480678/235-10-S99-1
Reference 3: http://www.xbrl.org/2003/role/disclosureRef
-Topic 740
-Name Accounting Standards Codification
-Publisher FASB
-URI https://asc.fasb.org//740/tableOfContent
Reference 4: http://www.xbrl.org/2003/role/disclosureRef
-Topic 740
-SubTopic 10
-Name Accounting Standards Codification
-Section 50
-Paragraph 14
-Publisher FASB
-URI https://asc.fasb.org//1943274/2147482685/740-10-50-14
Reference 5: http://www.xbrl.org/2003/role/disclosureRef
-Topic 740
-SubTopic 10
-Name Accounting Standards Codification
-Section 50
-Paragraph 21
-Publisher FASB
-URI https://asc.fasb.org//1943274/2147482685/740-10-50-21
Reference 6: http://www.xbrl.org/2003/role/disclosureRef
-Topic 740
-SubTopic 270
-Name Accounting Standards Codification
-Section 50
-Paragraph 1
-Publisher FASB
-URI https://asc.fasb.org//1943274/2147482526/740-270-50-1
Reference 7: http://www.xbrl.org/2003/role/disclosureRef
-Topic 740
-SubTopic 10
-Name Accounting Standards Codification
-Section 50
-Paragraph 17
-Subparagraph (b)
-Publisher FASB
-URI https://asc.fasb.org//1943274/2147482685/740-10-50-17
Reference 8: http://www.xbrl.org/2003/role/disclosureRef
-Topic 740
-SubTopic 10
-Name Accounting Standards Codification
-Section S99
-Paragraph 1
-Subparagraph (SAB TOPIC 6.I.5.Q1)
-Publisher FASB
-URI https://asc.fasb.org//1943274/2147479360/740-10-S99-1
Reference 9: http://www.xbrl.org/2003/role/disclosureRef
-Topic 740
-SubTopic 10
-Name Accounting Standards Codification
-Section S99
-Paragraph 2
-Subparagraph (SAB Topic 11.C)
-Publisher FASB
-URI https://asc.fasb.org//1943274/2147479360/740-10-S99-2
Reference 10: http://www.xbrl.org/2003/role/disclosureRef
-Topic 740
-SubTopic 30
-Name Accounting Standards Codification
-Section 50
-Paragraph 2
-Subparagraph (a)
-Publisher FASB
-URI https://asc.fasb.org//1943274/2147482603/740-30-50-2
| Name: |
us-gaap_IncomeTaxDisclosureTextBlock |
| Namespace Prefix: |
us-gaap_ |
| Data Type: |
dtr-types:textBlockItemType |
| Balance Type: |
na |
| Period Type: |
duration |
|
v3.23.3
DIVIDEND
|
9 Months Ended |
Sep. 30, 2023 |
|---|
| Dividend |
|
| DIVIDEND |
15.
DIVIDEND
For
the year ended December 31, 2022, Insite MY Innovations Sdn Bhd and Insite MY Systems Sdn Bhd, passed a board resolution for
declaration of dividend amounted MYR1,700,000
(approximately $385,680)
and MYR4,294,000
(approximately $974,182),
respectively to StarFIN Asia Sdn Bhd. Subsequently, StarFIN Asia Sdn Bhd passed a board resolution for declaration of dividend
amounted MYR5,794,000
(approximately $1,314,488) to Mr. Wong Kai Cheong and Mr. Hoo Swee Ping, before acquired by StarFIN Holdings Limited on January 20,
2023.
No
dividend was declared for the nine months ended September 30, 2023.
|
| X |
- References
+ Details
| Name: |
ASFH_DisclosureDividendAbstract |
| Namespace Prefix: |
ASFH_ |
| Data Type: |
xbrli:stringItemType |
| Balance Type: |
na |
| Period Type: |
duration |
|
| X |
- Definition
+ References
+ Details
| Name: |
ASFH_DividendTextBlock |
| Namespace Prefix: |
ASFH_ |
| Data Type: |
dtr-types:textBlockItemType |
| Balance Type: |
na |
| Period Type: |
duration |
|
v3.23.3
FOREIGN CURRENCY EXCHANGE RATE
|
9 Months Ended |
Sep. 30, 2023 |
|---|
| Foreign Currency [Abstract] |
|
| FOREIGN CURRENCY EXCHANGE RATE |
16.
FOREIGN CURRENCY EXCHANGE RATE
The
Company cannot guarantee that the current exchange rate will remain stable, therefore there is a possibility that the Company could post
the same amount of income for two comparable periods and because of the fluctuating exchange rate post higher or lower income depending
on exchange rate converted into US$ at the end of the financial year. The exchange rate could fluctuate depending on changes in political
and economic environments without notice.
|
| X |
- References
+ Details
| Name: |
us-gaap_ForeignCurrencyAbstract |
| Namespace Prefix: |
us-gaap_ |
| Data Type: |
xbrli:stringItemType |
| Balance Type: |
na |
| Period Type: |
duration |
|
| X |
- DefinitionThe entire disclosure for foreign currency transactions and translation. This may include description of foreign currency transactions, foreign currency gains and losses, explanation of change in cumulative translation adjustment, description of effect of subsequent foreign currency exchange rate change, cumulative translation adjustment movement, foreign currency translation adjustment by component movement, translation adjustment for net investment hedge movement, adjustment for long-term intercompany transactions, schedule of long-term intercompany balances and any other foreign currency transactions and translation related items. Reference 1: http://www.xbrl.org/2003/role/exampleRef
-Topic 946
-SubTopic 830
-Name Accounting Standards Codification
-Section 55
-Paragraph 14
-Publisher FASB
-URI https://asc.fasb.org//1943274/2147480167/946-830-55-14
Reference 2: http://www.xbrl.org/2003/role/exampleRef
-Topic 946
-SubTopic 830
-Name Accounting Standards Codification
-Section 55
-Paragraph 15
-Publisher FASB
-URI https://asc.fasb.org//1943274/2147480167/946-830-55-15
Reference 3: http://www.xbrl.org/2003/role/exampleRef
-Topic 946
-SubTopic 830
-Name Accounting Standards Codification
-Section 55
-Paragraph 13
-Publisher FASB
-URI https://asc.fasb.org//1943274/2147480167/946-830-55-13
Reference 4: http://www.xbrl.org/2003/role/exampleRef
-Topic 946
-SubTopic 830
-Name Accounting Standards Codification
-Section 55
-Paragraph 16
-Publisher FASB
-URI https://asc.fasb.org//1943274/2147480167/946-830-55-16
Reference 5: http://www.xbrl.org/2003/role/disclosureRef
-Topic 830
-SubTopic 30
-Name Accounting Standards Codification
-Section S99
-Paragraph 1
-Publisher FASB
-URI https://asc.fasb.org//1943274/2147479424/830-30-S99-1
Reference 6: http://www.xbrl.org/2003/role/disclosureRef
-Topic 830
-Name Accounting Standards Codification
-Publisher FASB
-URI https://asc.fasb.org//830/tableOfContent
Reference 7: http://www.xbrl.org/2003/role/recommendedDisclosureRef
-Topic 830
-SubTopic 20
-Name Accounting Standards Codification
-Section 50
-Paragraph 3
-Publisher FASB
-URI https://asc.fasb.org//1943274/2147481926/830-20-50-3
| Name: |
us-gaap_ForeignCurrencyDisclosureTextBlock |
| Namespace Prefix: |
us-gaap_ |
| Data Type: |
dtr-types:textBlockItemType |
| Balance Type: |
na |
| Period Type: |
duration |
|
v3.23.3
SEGMENT REPORTING
|
9 Months Ended |
Sep. 30, 2023 |
|---|
| Segment Reporting [Abstract] |
|
| SEGMENT REPORTING |
17.
SEGMENT REPORTING
ASC
280, “Segment Reporting” establishes standards for reporting information about operating segments on a basis consistent with
the Company’s internal organization structure as well as information about services categories, business segments and major customers
in financial statements. The Company has single reportable segment based on business unit, information technology business and two reportable
segments based on country, Malaysia and Non-Malaysia.
In
accordance with the “Segment Reporting” Topic of the ASC, the Company’s chief operating decision maker has been identified
as the Chief Executive Officer and President, who reviews operating results to make decisions about allocating resources and assessing
performance for the entire Company. Existing guidance, which is based on a management approach to segment reporting, establishes requirements
to report selected segment information quarterly and to report annually entity-wide disclosures about products and services, major customers,
and the countries in which the entity holds material assets and reports revenue. All material operating units qualify for aggregation
under “Segment Reporting” due to their similar customer base and similarities in economic characteristics; nature of products
and services; and procurement, manufacturing and distribution processes.
SCHEDULE OF SEGMENT REPORTING
| | |
For the Nine Months Ended and As of September 30, 2023 | |
| By Business Unit | |
Information Technology Business | | |
Total | |
| Revenue | |
$ | 1,813,426 | | |
$ | 1,813,426 | |
| | |
| | | |
| | |
| Cost of revenue | |
| (147,924 | ) | |
| (147,924 | ) |
| | |
| | | |
| | |
| Gross profit | |
$ | 1,665,502 | | |
$ | 1,665,502 | |
| | |
| | | |
| | |
| Selling, general and administrative expenses and other income | |
| (2,122,375 | ) | |
| (2,122,375 | ) |
| | |
| | | |
| | |
| Loss from operations | |
| (456,873 | ) | |
| (456,873 | ) |
| | |
| | | |
| | |
| Total assets | |
$ | 2,695,731 | | |
$ | 2,695,731 | |
| Capital expenditure | |
$ | 30,320 | | |
$ | 30,320 | |
| | |
For the Nine Months Ended and As of September 30, 2023 | |
| By Country | |
Malaysia | | |
Non-Malaysia | | |
Total | |
| Revenue | |
$ | 1,813,426 | | |
$ | - | | |
$ | 1,813,426 | |
| | |
| | | |
| | | |
| | |
| Cost of revenue | |
| (147,924 | ) | |
| - | | |
| (147,924 | ) |
| | |
| | | |
| | | |
| | |
| Gross profit | |
$ | 1,665,502 | | |
$ | - | | |
$ | 1,665,502 | |
| | |
| | | |
| | | |
| | |
| Selling, general and administrative expenses and other income | |
| (1,927,468 | ) | |
| (194,907 | ) | |
| (2,122,375 | ) |
| | |
| | | |
| | | |
| | |
| Loss from operations | |
| (261,966 | ) | |
| (194,907 | ) | |
| (456,873 | ) |
| | |
| | | |
| | | |
| | |
| Total assets | |
$ | 2,658,020 | | |
$ | 37,711 | | |
$ | 2,695,731 | |
| Capital expenditure | |
$ | 30,320 | | |
$ | - | | |
$ | 30,320 | |
| | |
For the Nine Months Ended and As of September 30, 2022 | |
| By Business Unit | |
Information Technology Business | | |
Total | |
| Revenue | |
$ | - | | |
$ | - | |
| | |
| | | |
| | |
| Cost of revenue | |
| - | | |
| - | |
| | |
| | | |
| | |
| Gross profit | |
$ | - | | |
$ | - | |
| | |
| | | |
| | |
| General and administrative expenses and other income | |
| (63,576 | ) | |
| (63,576 | ) |
| | |
| | | |
| | |
| Loss from operations | |
| (63,576 | ) | |
| (63,576 | ) |
| | |
| | | |
| | |
| Total assets | |
$ | 919,874 | | |
$ | 919,874 | |
| Capital expenditure | |
$ | - | | |
$ | - | |
| | |
For the Nine Months Ended and As of September 30, 2022 | |
| By Country | |
Malaysia | | |
Non-Malaysia | | |
Total | |
| Revenue | |
$ | - | | |
$ | - | | |
$ | - | |
| | |
| | | |
| | | |
| | |
| Cost of revenue | |
| - | | |
| - | | |
| - | |
| | |
| | | |
| | | |
| | |
| Gross profit | |
$ | - | | |
$ | - | | |
$ | - | |
| | |
| | | |
| | | |
| | |
| General and administrative expenses and other income | |
| - | | |
| (63,576 | ) | |
| (63,576 | ) |
| | |
| | | |
| | | |
| | |
| Loss from operations | |
| - | | |
| (63,576 | ) | |
| (63,576 | ) |
| | |
| | | |
| | | |
| | |
| Total assets | |
$ | - | | |
$ | 919,874 | | |
$ | 919,874 | |
| Capital expenditure | |
$ | - | | |
$ | - | | |
$ | - | |
|
| X |
- References
+ Details
| Name: |
us-gaap_SegmentReportingAbstract |
| Namespace Prefix: |
us-gaap_ |
| Data Type: |
xbrli:stringItemType |
| Balance Type: |
na |
| Period Type: |
duration |
|
| X |
- DefinitionThe entire disclosure for reporting segments including data and tables. Reportable segments include those that meet any of the following quantitative thresholds a) it's reported revenue, including sales to external customers and intersegment sales or transfers is 10 percent or more of the combined revenue, internal and external, of all operating segments b) the absolute amount of its reported profit or loss is 10 percent or more of the greater, in absolute amount of 1) the combined reported profit of all operating segments that did not report a loss or 2) the combined reported loss of all operating segments that did report a loss c) its assets are 10 percent or more of the combined assets of all operating segments. Reference 1: http://www.xbrl.org/2003/role/disclosureRef
-Topic 280
-SubTopic 10
-Name Accounting Standards Codification
-Section 50
-Paragraph 22
-Publisher FASB
-URI https://asc.fasb.org//1943274/2147482810/280-10-50-22
Reference 2: http://www.xbrl.org/2003/role/disclosureRef
-Topic 280
-SubTopic 10
-Name Accounting Standards Codification
-Section 50
-Paragraph 15
-Publisher FASB
-URI https://asc.fasb.org//1943274/2147482810/280-10-50-15
Reference 3: http://www.xbrl.org/2003/role/disclosureRef
-Topic 280
-SubTopic 10
-Name Accounting Standards Codification
-Section 50
-Paragraph 31
-Publisher FASB
-URI https://asc.fasb.org//1943274/2147482810/280-10-50-31
Reference 4: http://www.xbrl.org/2003/role/disclosureRef
-Topic 280
-SubTopic 10
-Name Accounting Standards Codification
-Section 50
-Paragraph 32
-Subparagraph (d)
-Publisher FASB
-URI https://asc.fasb.org//1943274/2147482810/280-10-50-32
Reference 5: http://www.xbrl.org/2003/role/disclosureRef
-Topic 280
-SubTopic 10
-Name Accounting Standards Codification
-Section 50
-Paragraph 42
-Publisher FASB
-URI https://asc.fasb.org//1943274/2147482810/280-10-50-42
Reference 6: http://www.xbrl.org/2003/role/disclosureRef
-Topic 280
-SubTopic 10
-Name Accounting Standards Codification
-Section 50
-Paragraph 32
-Subparagraph (f)
-Publisher FASB
-URI https://asc.fasb.org//1943274/2147482810/280-10-50-32
Reference 7: http://www.xbrl.org/2003/role/disclosureRef
-Topic 280
-SubTopic 10
-Name Accounting Standards Codification
-Section 50
-Paragraph 40
-Publisher FASB
-URI https://asc.fasb.org//1943274/2147482810/280-10-50-40
Reference 8: http://www.xbrl.org/2003/role/disclosureRef
-Topic 280
-Name Accounting Standards Codification
-Publisher FASB
-URI https://asc.fasb.org//280/tableOfContent
Reference 9: http://www.xbrl.org/2003/role/disclosureRef
-Topic 280
-SubTopic 10
-Name Accounting Standards Codification
-Section 50
-Paragraph 26
-Publisher FASB
-URI https://asc.fasb.org//1943274/2147482810/280-10-50-26
Reference 10: http://www.xbrl.org/2003/role/disclosureRef
-Topic 280
-SubTopic 10
-Name Accounting Standards Codification
-Section 50
-Paragraph 34
-Publisher FASB
-URI https://asc.fasb.org//1943274/2147482810/280-10-50-34
Reference 11: http://www.xbrl.org/2003/role/disclosureRef
-Topic 280
-SubTopic 10
-Name Accounting Standards Codification
-Section 50
-Paragraph 41
-Publisher FASB
-URI https://asc.fasb.org//1943274/2147482810/280-10-50-41
Reference 12: http://www.xbrl.org/2003/role/disclosureRef
-Topic 280
-SubTopic 10
-Name Accounting Standards Codification
-Section 50
-Paragraph 21
-Subparagraph (a)
-Publisher FASB
-URI https://asc.fasb.org//1943274/2147482810/280-10-50-21
Reference 13: http://www.xbrl.org/2003/role/disclosureRef
-Topic 280
-SubTopic 10
-Name Accounting Standards Codification
-Section 50
-Paragraph 21
-Subparagraph (b)
-Publisher FASB
-URI https://asc.fasb.org//1943274/2147482810/280-10-50-21
Reference 14: http://www.xbrl.org/2003/role/disclosureRef
-Topic 280
-SubTopic 10
-Name Accounting Standards Codification
-Section 50
-Paragraph 32
-Subparagraph (e)
-Publisher FASB
-URI https://asc.fasb.org//1943274/2147482810/280-10-50-32
| Name: |
us-gaap_SegmentReportingDisclosureTextBlock |
| Namespace Prefix: |
us-gaap_ |
| Data Type: |
dtr-types:textBlockItemType |
| Balance Type: |
na |
| Period Type: |
duration |
|
v3.23.3
SUBSEQUENT EVENTS
|
9 Months Ended |
Sep. 30, 2023 |
|---|
| Subsequent Events [Abstract] |
|
| SUBSEQUENT EVENTS |
18.
SUBSEQUENT EVENTS
In
accordance with ASC Topic 855, “Subsequent Events”, which establishes general standards of accounting for and disclosure
of events that occur after the balance sheet date but before financial statements are issued, the Company has evaluated all events or
transactions that occurred after September 30, 2023 up through the date the Company presented these unaudited financial statements.
|
| X |
- References
+ Details
| Name: |
us-gaap_SubsequentEventsAbstract |
| Namespace Prefix: |
us-gaap_ |
| Data Type: |
xbrli:stringItemType |
| Balance Type: |
na |
| Period Type: |
duration |
|
| X |
- DefinitionThe entire disclosure for significant events or transactions that occurred after the balance sheet date through the date the financial statements were issued or the date the financial statements were available to be issued. Examples include: the sale of a capital stock issue, purchase of a business, settlement of litigation, catastrophic loss, significant foreign exchange rate changes, loans to insiders or affiliates, and transactions not in the ordinary course of business. Reference 1: http://www.xbrl.org/2003/role/disclosureRef
-Topic 855
-Name Accounting Standards Codification
-Publisher FASB
-URI https://asc.fasb.org//855/tableOfContent
Reference 2: http://www.xbrl.org/2003/role/disclosureRef
-Topic 855
-SubTopic 10
-Name Accounting Standards Codification
-Section 50
-Paragraph 2
-Subparagraph (a)
-Publisher FASB
-URI https://asc.fasb.org//1943274/2147483399/855-10-50-2
| Name: |
us-gaap_SubsequentEventsTextBlock |
| Namespace Prefix: |
us-gaap_ |
| Data Type: |
dtr-types:textBlockItemType |
| Balance Type: |
na |
| Period Type: |
duration |
|
v3.23.3
SUMMARY OF SIGNIFICANT ACCOUNTING POLICIES (Policies)
|
9 Months Ended |
Sep. 30, 2023 |
|---|
| Accounting Policies [Abstract] |
|
| Basis of Presentation |
Basis
of Presentation
These
accompanying financial statements have been prepared in accordance with generally accepted accounting principles in the United States
of America (“US GAAP”).
The
accompanying financial statements include the accounts of the Company and its subsidiaries and associates. Intercompany transactions
and balances were eliminated in consolidation. The Company has adopted December 31 as its fiscal year end. Below is the organization
chart of the Group.
The
accompanying unaudited condensed consolidated financial statements as of and for the nine months ended September 30, 2023 and 2022 have
been prepared pursuant to the rules and regulations of the Securities and Exchange Commission (the “SEC”) that permit reduced
disclosure for interim periods. Certain information and footnote disclosures normally included in financial statements prepared in accordance
with accounting principles generally accepted in the United States of America (“US GAAP”) have been condensed or omitted.
In the opinion of management, all adjustments (consisting of normal recurring accruals) considered necessary for a fair presentation
have been included. Operating results for the period ended September 30, 2023 are not necessarily indicative of the results that may
be expected for the year ending December 31, 2023. The Condensed Consolidated Balance Sheet information as of December 31, 2022 was derived
from the Company’s audited Consolidated Financial Statements as of and for the year ended December 31, 2022 included in the Company’s
Annual Report on Form 10-K filed with the SEC on February 16, 2023. These financial statements should be read in conjunction with that
report.
The
accompanying unaudited condensed consolidated financial statements include the accounts of the Company and its wholly owned subsidiaries
and majority-owned subsidiaries which the Company controls and entities for which the Company is the primary beneficiary. For those consolidated
subsidiaries where the Company’s ownership is less than 100%, the outside shareholders’ interests are shown as noncontrolling
interests in equity. Acquired businesses are included in the consolidated financial statements from the date on which control is transferred
to the Company. Subsidiaries are deconsolidated from the date that control ceases. All inter-company accounts and transactions have been
eliminated in consolidation.
|
| Use of Estimates |
Use
of Estimates
In
preparing these financial statements, management makes estimates and assumptions that affect the reported amounts of assets and liabilities
in the balance sheets and revenues and expenses during the years reported. Actual results may differ from these estimates.
|
| Cash and Cash Equivalents |
Cash
and Cash Equivalents
The
Company considers short-term, highly liquid investments with an original maturity of 90 days or less to be cash equivalents.
Our
deposit in Malaysia banks are secured by Perbadanan Insurans Deposit Malaysia, compensating up to a limit of Malaysia Ringgit MYR250,000
per deposit per member bank, which is equivalent to $53,191, if any of our bank fail.
|
| Property, Plant and Equipment |
Property,
Plant and Equipment
Property,
plant and equipment are stated at cost, with depreciation and amortization provided using the straight-line method over the following
periods:
SCHEDULE
OF PLANT AND EQUIPMENT DEPRECIATION PERIODS
| Asset
Categories |
|
Depreciation
Periods |
| Renovation |
|
over
the remaining lease period |
| Computer
Systems |
|
4
to 5 years |
| Furniture
and Fittings |
|
10
years |
| Electrical
Fittings |
|
10
years |
| Handphone |
|
5
years |
| Office
Equipment |
|
10
years |
| Motor
Vehicle |
|
5
years |
| Property |
|
50
years |
|
| Revenue recognition |
Revenue
recognition
The
Company through subsidiaries generate multiple streams of revenues based on different business model adopted by each subsidiary through
provisions of services and recognized upon customer obtained control of promised services and recognized in an amount that reflects the
consideration that the Company expects to receive in exchange for those services. In addition, the standard requires disclosure of the
nature, amount, timing, and uncertainty of revenue and cash flows arising from contracts with customers. The Company applies the following
five-step model in order to determine this amount:
(i)
Identify contract with customer;
(ii)
Identify distinct performance obligations in contract, including promises if any;
(iii)
Measurement of the transaction price, including the constraint on variable consideration;
(iv)
Allocation of the transaction price to the performance obligations; and
(v)
Recognition of revenue when (or as) the Company satisfies each performance obligation.
|
| Cost of revenue |
Cost
of revenue
Cost
of revenue includes direct costs associated with provision of services such as development costs, purchases of third-party software,
maintenance fees and consultation fees.
|
| Income tax expense |
Income
tax expense
Income
taxes are determined in accordance with the provisions of ASC Topic 740, “Income Taxes” (“ASC Topic 740”). Under
this method, deferred tax assets and liabilities are recognized for the future tax consequences attributable to differences between the
financial statement carrying amounts of existing assets and liabilities and their respective tax basis. Deferred tax assets and liabilities
are measured using enacted income tax rates expected to apply to taxable income in the years in which those temporary differences are
expected to be recovered or settled. Any effect on deferred tax assets and liabilities of a change in tax rates is recognized in income
in the period that includes the enactment date.
ASC
740 prescribes a comprehensive model for how companies should recognize, measure, present, and disclosed in their financial statements
uncertain tax positions taken or expected to be taken on a tax return. Under ASC 740, tax positions must initially be recognized in the
financial statements when it is more likely than not the position will be sustained upon examination by the tax authorities. Such tax
positions must initially and subsequently be measured as the largest amount of tax benefit that has a greater than 50% likelihood of
being realized upon ultimate settlement with the tax authority assuming full knowledge of the position and relevant facts.
The
Company conducts major businesses in Malaysia and is subject to tax in their own jurisdictions. As a result of its business activities,
the Company will file separate tax returns that are subject to examination by the foreign tax authorities.
|
| Going concern |
Going concern
The accompanying financial statements have been prepared
on a going concern basis, which contemplates the realization of assets and the settlement of liabilities and commitments in the normal
course of business.
As reflected in the accompanying financial statements,
for the nine months ended September 30, 2023, the Company incurred a net loss of $418,304 and negative operating cash flow of $282,345.
These factors raise substantial doubt about the Company’s ability to continue as a going concern within one year of the date that
the financial statements are issued.
The Company does not have sufficient revenue to cover
its operating cost due to the research and development activities performed in the initial stage. The Company’s ability to continue
as a going concern is dependent upon improving its profitability and the continuing financial support from its major shareholders. Management
believes the existing shareholders or external financing will provide the additional cash to meet the Company’s obligations as they
become due.
No assurance can be given that any future financing,
if needed, will be available. These and other factors raise substantial doubt about the Company’s ability to continue as a going
concern. These financial statements do not include any adjustments to reflect the possible future effects on the recoverability in profitability
that may result in the Company not being able to continue as a going concern.
|
| Foreign currencies translation |
Foreign
currencies translation
Transactions
denominated in currencies other than the functional currency are translated into the functional currency at the exchange rates prevailing
at the dates of the transaction. Monetary assets and liabilities denominated in currencies other than the functional currency are translated
into the functional currency using the applicable exchange rates at the balance sheet dates. The resulting exchange differences are recorded
in the statement of operations and comprehensive income (loss).
The
functional currency of the Company is the United States Dollars (“US$”) and the accompanying financial statements have been
expressed in US$. In addition, the Company’s subsidiary maintains its books and record in Malaysia Ringgits (“MYR”),
United States Dollars (“US$”) and Hong Kong Dollars (“HK$”), which is the respective functional currency as being
the primary currency of the economic environment in which the entity operates.
In
general, for consolidation purposes, assets and liabilities of its subsidiaries whose functional currency is not US$ are translated into
US$, in accordance with ASC Topic 830-30, “Translation of Financial Statement”, using the exchange rate on the balance sheet
date. Revenues and expenses are translated at average rates prevailing during the period. The gains and losses resulting from translation
of financial statements of foreign subsidiary are recorded as a separate component of accumulated other comprehensive income.
Translation
of amounts from the local currency of the Company into US$1 has been made at the following exchange rates for the respective periods:
SCHEDULE OF FOREIGN EXCHANGE RATE
| | |
As of and for the period ended September 30 | |
| | |
2023 | | |
2022 | |
| Period-end MYR : US$1 exchange rate | |
| 4.70 | | |
| 4.53 | |
| Period-average MYR : US$1 exchange rate | |
| 4.53 | | |
| 4.35 | |
| Period-end HK$ : US$1 exchange rate | |
| 7.75 | | |
| 7.85 | |
| Period-average HK$ : US$1 exchange rate | |
| 7.75 | | |
| 7.84 | |
|
| Related parties |
Related
parties
Parties,
which can be a corporation or individual, are considered to be related if the Company has the ability, directly or indirectly, to control
the other party or exercise significant influence over the other party in making financial and operating decisions. Companies are also
considered to be related if they are subject to common control or common significant influence.
|
| Fair value of financial instruments |
Fair
value of financial instruments
The
carrying value of the Company’s financial instruments: cash and cash equivalents, trade receivable, deposits and other receivables,
amount due to related parties and other payables approximate at their fair values because of the short-term nature of these financial
instruments.
The
Company also follows the guidance of the ASC Topic 820-10, “Fair Value Measurements and Disclosures” (“ASC 820-10”),
with respect to financial assets and liabilities that are measured at fair value. ASC 820-10 establishes a three-tier fair value hierarchy
that prioritizes the inputs used in measuring fair value as follows:
Level
1 : Observable inputs such as quoted prices in active markets;
Level
2 : Inputs, other than the quoted prices in active markets, that are observable either directly or indirectly; and
Level
3 : Unobservable inputs in which there is little or no market data, which require the reporting entity to develop its own assumptions.
As
of September 30, 2023, the Company did not have any nonfinancial assets and liabilities that are recognized or disclosed at fair value
in the financial statements, at least annually, on a recurring basis, nor did the Company have any assets or liabilities measured at
fair value on a non-recurring basis.
|
| Net Income/(Loss) per Share |
Net
Income/(Loss) per Share
The
Company calculates net income/(loss) per share in accordance with ASC Topic 260, “Earnings per Share”. Basic income/(loss)
per share is computed by dividing the net income/(loss) by the weighted-average number of common shares outstanding during the period.
Diluted income per share is computed similar to basic income/(loss) per share except that the denominator is increased to include the
number of additional common shares that would have been outstanding if the potential common stock equivalents had been issued and if
the additional common shares were dilutive.
|
| Lease |
Lease
The
Company offices for fixed periods pre-emptive extension options. The Company recognizes lease payments for its short-term lease on a
straight-line basis over the lease term.
Lease
liability is initially and subsequently measured at the present value of the unpaid lease payments at the lease commencement date. The
right-of-use asset is initially measured at cost, which comprises the initial amount of the lease liability adjusted for lease payments
made at or before the lease commencement date, plus any initial direct costs incurred less any lease incentives received. Costs associated
with operating lease assets are recognized on a straight-line basis within operating expenses over the term of the lease.
In
determining the present value of the unpaid lease payments, ASC 842 requires a lessee to discount its unpaid lease payments using the
interest rate implicit in the lease or, if that rate cannot be readily determined, its incremental borrowing rate. As most of the Company
leases do not provide an implicit rate, the Company uses its incremental borrowing rate as the discount rate for the lease. The Company
incremental borrowing rate is estimated to approximate the interest rate on a collateralized basis with similar terms and payments.
|
| Acquisition Agreement |
Acquisition
Agreement
The
acquisition of StarFIN Holdings Limited. (“SFHL”) has been accounted for under the purchase method of accounting in accordance
with Statement of Financial Accounting Standards No. 141, “Business Combinations”. Under the purchase method of accounting,
the purchase price is allocated to the assets acquired and liabilities assumed based on their estimated fair values.
The
allocation of the purchase price has been prepared based on preliminary estimates of fair values. However, actual amounts recorded upon
the finalization of estimates of fair values may differ from the information presented in these unaudited pro forma condensed combined
consolidated financial statements. The Company estimates of the fair values of the assets and liabilities of SFHL have been combined
with the recorded values of the assets and liabilities of SFHL in the audited condensed combined financial information, goodwill was
immediately impaired upon recognition.
|
| Recently Adopted Accounting Standards |
Recently
Adopted Accounting Standards
In
June 2016, the FASB issued Accounting Standards Update No. 2016-13, Financial Instruments—Credit Losses (Topic 326): Measurement
of Credit Losses on Financial Instruments, which introduced the expected credit losses methodology for the measurement of credit losses
on financial assets measured at amortized cost basis, replacing the previous incurred loss methodology. In November 2019, the FASB issued
ASU 2019-10 highlighted the adoption timeline. For smaller reporting entities, Topic 326 is effective for annual periods beginning after
December 15, 2022, including interim periods within those fiscal years, of which is effective for the Company on January 1, 2023.
Credit
loss rate is determined by historical collection based on aging schedule, adjusted for current conditions using reasonable and supportable
forecasts. Based on the aging categorization and the adjusted loss rate per category, an allowance for credit losses is calculated by
multiplying the adjusted loss rate with the amortized cost in the respective age category.
|
| Recently Issued Accounting Standards |
Recently
Issued Accounting Standards
The
Company reviews new accounting standards as issued. Management has not identified any other new standards that it believes will have
a significant impact on the Company’s financial statements.
|
| X |
- DefinitionRecently Adopted Accounting Standards Policy [Text Block]
| Name: |
ASFH_RecentlyAdoptedAccountingStandardsPolicyTextBlock |
| Namespace Prefix: |
ASFH_ |
| Data Type: |
dtr-types:textBlockItemType |
| Balance Type: |
na |
| Period Type: |
duration |
|
| X |
- DefinitionRelated Parties Policy [Text Block]
| Name: |
ASFH_RelatedPartiesPolicyTextBlock |
| Namespace Prefix: |
ASFH_ |
| Data Type: |
dtr-types:textBlockItemType |
| Balance Type: |
na |
| Period Type: |
duration |
|
| X |
- References
+ Details
| Name: |
ASFH_SubstantialDoubtAboutGoingConcernPolicyTextBlock |
| Namespace Prefix: |
ASFH_ |
| Data Type: |
dtr-types:textBlockItemType |
| Balance Type: |
na |
| Period Type: |
duration |
|
| X |
- References
+ Details
| Name: |
us-gaap_AccountingPoliciesAbstract |
| Namespace Prefix: |
us-gaap_ |
| Data Type: |
xbrli:stringItemType |
| Balance Type: |
na |
| Period Type: |
duration |
|
| X |
- DefinitionDisclosure of accounting policy for basis of accounting, or basis of presentation, used to prepare the financial statements (for example, US Generally Accepted Accounting Principles, Other Comprehensive Basis of Accounting, IFRS).
| Name: |
us-gaap_BasisOfAccountingPolicyPolicyTextBlock |
| Namespace Prefix: |
us-gaap_ |
| Data Type: |
dtr-types:textBlockItemType |
| Balance Type: |
na |
| Period Type: |
duration |
|
| X |
- DefinitionDisclosure of accounting policy for completed business combinations (purchase method, acquisition method or combination of entities under common control). This accounting policy may include a general discussion of the purchase method or acquisition method of accounting (including for example, the treatment accorded contingent consideration, the identification of assets and liabilities, the purchase price allocation process, how the fair values of acquired assets and liabilities are determined) and the entity's specific application thereof. An entity that acquires another entity in a leveraged buyout transaction generally discloses the accounting policy followed by the acquiring entity in determining the basis used to value its interest in the acquired entity, and the rationale for that accounting policy. Reference 1: http://fasb.org/us-gaap/role/ref/legacyRef
-Name Accounting Standards Codification
-Topic 805
-SubTopic 10
-Section 05
-Paragraph 4
-Subparagraph (a)-(d)
-Publisher FASB
-URI https://asc.fasb.org//1943274/2147479515/805-10-05-4
| Name: |
us-gaap_BusinessCombinationsPolicy |
| Namespace Prefix: |
us-gaap_ |
| Data Type: |
dtr-types:textBlockItemType |
| Balance Type: |
na |
| Period Type: |
duration |
|
| X |
- DefinitionDisclosure of accounting policy for cash and cash equivalents, including the policy for determining which items are treated as cash equivalents. Other information that may be disclosed includes (1) the nature of any restrictions on the entity's use of its cash and cash equivalents, (2) whether the entity's cash and cash equivalents are insured or expose the entity to credit risk, (3) the classification of any negative balance accounts (overdrafts), and (4) the carrying basis of cash equivalents (for example, at cost) and whether the carrying amount of cash equivalents approximates fair value. Reference 1: http://fasb.org/us-gaap/role/ref/legacyRef
-Name Accounting Standards Codification
-Topic 230
-SubTopic 10
-Section 50
-Paragraph 1
-Publisher FASB
-URI https://asc.fasb.org//1943274/2147482913/230-10-50-1
| Name: |
us-gaap_CashAndCashEquivalentsPolicyTextBlock |
| Namespace Prefix: |
us-gaap_ |
| Data Type: |
dtr-types:textBlockItemType |
| Balance Type: |
na |
| Period Type: |
duration |
|
| X |
- DefinitionDisclosure of accounting policy for computing basic and diluted earnings or loss per share for each class of common stock and participating security. Addresses all significant policy factors, including any antidilutive items that have been excluded from the computation and takes into account stock dividends, splits and reverse splits that occur after the balance sheet date of the latest reporting period but before the issuance of the financial statements. Reference 1: http://fasb.org/us-gaap/role/ref/legacyRef
-Name Accounting Standards Codification
-Topic 260
-SubTopic 10
-Section 50
-Paragraph 1
-Subparagraph (c)
-Publisher FASB
-URI https://asc.fasb.org//1943274/2147482662/260-10-50-1
Reference 2: http://fasb.org/us-gaap/role/ref/legacyRef
-Name Accounting Standards Codification
-Topic 260
-SubTopic 10
-Section 50
-Paragraph 2
-Publisher FASB
-URI https://asc.fasb.org//1943274/2147482662/260-10-50-2
| Name: |
us-gaap_EarningsPerSharePolicyTextBlock |
| Namespace Prefix: |
us-gaap_ |
| Data Type: |
dtr-types:textBlockItemType |
| Balance Type: |
na |
| Period Type: |
duration |
|
| X |
- DefinitionDisclosure of accounting policy for determining the fair value of financial instruments. Reference 1: http://fasb.org/us-gaap/role/ref/legacyRef
-Name Accounting Standards Codification
-Section 60
-Paragraph 1
-SubTopic 10
-Topic 820
-Publisher FASB
-URI https://asc.fasb.org//1943274/2147482053/820-10-60-1
Reference 2: http://fasb.org/us-gaap/role/ref/legacyRef
-Name Accounting Standards Codification
-Section 50
-Paragraph 1
-SubTopic 10
-Topic 825
-Publisher FASB
-URI https://asc.fasb.org//1943274/2147482907/825-10-50-1
| Name: |
us-gaap_FairValueOfFinancialInstrumentsPolicy |
| Namespace Prefix: |
us-gaap_ |
| Data Type: |
dtr-types:textBlockItemType |
| Balance Type: |
na |
| Period Type: |
duration |
|
| X |
- DefinitionDisclosure of accounting policy for (1) transactions denominated in a currency other than the reporting enterprise's functional currency, (2) translating foreign currency financial statements that are incorporated into the financial statements of the reporting enterprise by consolidation, combination, or the equity method of accounting, and (3) remeasurement of the financial statements of a foreign reporting enterprise in a hyperinflationary economy. Reference 1: http://www.xbrl.org/2003/role/disclosureRef
-Topic 830
-Name Accounting Standards Codification
-Publisher FASB
-URI https://asc.fasb.org//830/tableOfContent
| Name: |
us-gaap_ForeignCurrencyTransactionsAndTranslationsPolicyTextBlock |
| Namespace Prefix: |
us-gaap_ |
| Data Type: |
dtr-types:textBlockItemType |
| Balance Type: |
na |
| Period Type: |
duration |
|
| X |
- DefinitionDisclosure of accounting policy for income taxes, which may include its accounting policies for recognizing and measuring deferred tax assets and liabilities and related valuation allowances, recognizing investment tax credits, operating loss carryforwards, tax credit carryforwards, and other carryforwards, methodologies for determining its effective income tax rate and the characterization of interest and penalties in the financial statements. Reference 1: http://www.xbrl.org/2003/role/disclosureRef
-Topic 946
-SubTopic 10
-Name Accounting Standards Codification
-Section S99
-Paragraph 3
-Subparagraph (SX 210.6-03(h)(1))
-Publisher FASB
-URI https://asc.fasb.org//1943274/2147479886/946-10-S99-3
Reference 2: http://www.xbrl.org/2003/role/disclosureRef
-Topic 740
-SubTopic 10
-Name Accounting Standards Codification
-Section 50
-Paragraph 17
-Subparagraph (b)
-Publisher FASB
-URI https://asc.fasb.org//1943274/2147482685/740-10-50-17
Reference 3: http://www.xbrl.org/2003/role/disclosureRef
-Topic 740
-SubTopic 10
-Name Accounting Standards Codification
-Section 50
-Paragraph 9
-Publisher FASB
-URI https://asc.fasb.org//1943274/2147482685/740-10-50-9
Reference 4: http://www.xbrl.org/2003/role/disclosureRef
-Topic 740
-SubTopic 10
-Name Accounting Standards Codification
-Section 45
-Paragraph 25
-Publisher FASB
-URI https://asc.fasb.org//1943274/2147482525/740-10-45-25
Reference 5: http://www.xbrl.org/2003/role/disclosureRef
-Topic 740
-SubTopic 10
-Name Accounting Standards Codification
-Section 45
-Paragraph 28
-Publisher FASB
-URI https://asc.fasb.org//1943274/2147482525/740-10-45-28
Reference 6: http://www.xbrl.org/2003/role/disclosureRef
-Topic 740
-SubTopic 10
-Name Accounting Standards Codification
-Section 50
-Paragraph 19
-Publisher FASB
-URI https://asc.fasb.org//1943274/2147482685/740-10-50-19
Reference 7: http://www.xbrl.org/2003/role/disclosureRef
-Topic 220
-SubTopic 10
-Name Accounting Standards Codification
-Section 50
-Paragraph 1
-Publisher FASB
-URI https://asc.fasb.org//1943274/2147482765/220-10-50-1
Reference 8: http://www.xbrl.org/2003/role/disclosureRef
-Topic 740
-SubTopic 10
-Name Accounting Standards Codification
-Section 50
-Paragraph 20
-Publisher FASB
-URI https://asc.fasb.org//1943274/2147482685/740-10-50-20
| Name: |
us-gaap_IncomeTaxPolicyTextBlock |
| Namespace Prefix: |
us-gaap_ |
| Data Type: |
dtr-types:textBlockItemType |
| Balance Type: |
na |
| Period Type: |
duration |
|
| X |
- DefinitionDisclosure of accounting policy for leasing arrangement entered into by lessee. Reference 1: http://www.xbrl.org/2003/role/disclosureRef
-Topic 842
-SubTopic 20
-Name Accounting Standards Codification
-Section 50
-Paragraph 1
-Subparagraph (b)
-Publisher FASB
-URI https://asc.fasb.org//1943274/2147478964/842-20-50-1
| Name: |
us-gaap_LesseeLeasesPolicyTextBlock |
| Namespace Prefix: |
us-gaap_ |
| Data Type: |
dtr-types:textBlockItemType |
| Balance Type: |
na |
| Period Type: |
duration |
|
| X |
- DefinitionDisclosure of accounting policy pertaining to new accounting pronouncements that may impact the entity's financial reporting. Includes, but is not limited to, quantification of the expected or actual impact.
| Name: |
us-gaap_NewAccountingPronouncementsPolicyPolicyTextBlock |
| Namespace Prefix: |
us-gaap_ |
| Data Type: |
dtr-types:textBlockItemType |
| Balance Type: |
na |
| Period Type: |
duration |
|
| X |
- DefinitionDisclosure of accounting policy for long-lived, physical asset used in normal conduct of business and not intended for resale. Includes, but is not limited to, work of art, historical treasure, and similar asset classified as collections. Reference 1: http://fasb.org/us-gaap/role/ref/legacyRef
-Name Accounting Standards Codification
-Section 50
-Paragraph 1
-SubTopic 10
-Topic 360
-Publisher FASB
-URI https://asc.fasb.org//1943274/2147482099/360-10-50-1
Reference 2: http://www.xbrl.org/2003/role/disclosureRef
-Topic 944
-SubTopic 210
-Name Accounting Standards Codification
-Section S99
-Paragraph 1
-Subparagraph (SX 210.7-03(a)(8)(a))
-Publisher FASB
-URI https://asc.fasb.org//1943274/2147479440/944-210-S99-1
Reference 3: http://www.xbrl.org/2003/role/disclosureRef
-Name Accounting Standards Codification
-Section 50
-Paragraph 6
-SubTopic 360
-Topic 958
-Publisher FASB
-URI https://asc.fasb.org//1943274/2147480321/958-360-50-6
Reference 4: http://www.xbrl.org/2003/role/disclosureRef
-Name Accounting Standards Codification
-Section 50
-Paragraph 1
-Subparagraph (d)
-SubTopic 360
-Topic 958
-Publisher FASB
-URI https://asc.fasb.org//1943274/2147480321/958-360-50-1
| Name: |
us-gaap_PropertyPlantAndEquipmentPolicyTextBlock |
| Namespace Prefix: |
us-gaap_ |
| Data Type: |
dtr-types:textBlockItemType |
| Balance Type: |
na |
| Period Type: |
duration |
|
| X |
- DefinitionDisclosure of accounting policy for revenue from contract with customer. Reference 1: http://www.xbrl.org/2003/role/disclosureRef
-Topic 606
-SubTopic 10
-Name Accounting Standards Codification
-Section 50
-Paragraph 17
-Publisher FASB
-URI https://asc.fasb.org//1943274/2147479806/606-10-50-17
Reference 2: http://www.xbrl.org/2003/role/disclosureRef
-Topic 606
-SubTopic 10
-Name Accounting Standards Codification
-Section 50
-Paragraph 19
-Publisher FASB
-URI https://asc.fasb.org//1943274/2147479806/606-10-50-19
Reference 3: http://www.xbrl.org/2003/role/disclosureRef
-Topic 606
-SubTopic 10
-Name Accounting Standards Codification
-Section 50
-Paragraph 18
-Subparagraph (a)
-Publisher FASB
-URI https://asc.fasb.org//1943274/2147479806/606-10-50-18
Reference 4: http://www.xbrl.org/2003/role/disclosureRef
-Topic 606
-SubTopic 10
-Name Accounting Standards Codification
-Section 50
-Paragraph 18
-Subparagraph (b)
-Publisher FASB
-URI https://asc.fasb.org//1943274/2147479806/606-10-50-18
Reference 5: http://www.xbrl.org/2003/role/disclosureRef
-Topic 606
-SubTopic 10
-Name Accounting Standards Codification
-Section 50
-Paragraph 20
-Subparagraph (a)
-Publisher FASB
-URI https://asc.fasb.org//1943274/2147479806/606-10-50-20
Reference 6: http://www.xbrl.org/2003/role/disclosureRef
-Topic 606
-SubTopic 10
-Name Accounting Standards Codification
-Section 50
-Paragraph 20
-Subparagraph (b)
-Publisher FASB
-URI https://asc.fasb.org//1943274/2147479806/606-10-50-20
Reference 7: http://www.xbrl.org/2003/role/disclosureRef
-Topic 606
-SubTopic 10
-Name Accounting Standards Codification
-Section 50
-Paragraph 20
-Subparagraph (c)
-Publisher FASB
-URI https://asc.fasb.org//1943274/2147479806/606-10-50-20
Reference 8: http://www.xbrl.org/2003/role/disclosureRef
-Topic 606
-SubTopic 10
-Name Accounting Standards Codification
-Section 50
-Paragraph 20
-Subparagraph (d)
-Publisher FASB
-URI https://asc.fasb.org//1943274/2147479806/606-10-50-20
Reference 9: http://www.xbrl.org/2003/role/exampleRef
-Name Accounting Standards Codification
-Section 50
-Paragraph 4
-Subparagraph (e)
-SubTopic 10
-Topic 235
-Publisher FASB
-URI https://asc.fasb.org//1943274/2147483426/235-10-50-4
Reference 10: http://www.xbrl.org/2003/role/disclosureRef
-Name Accounting Standards Codification
-Topic 606
-Publisher FASB
-URI https://asc.fasb.org//606/tableOfContent
| Name: |
us-gaap_RevenueFromContractWithCustomerPolicyTextBlock |
| Namespace Prefix: |
us-gaap_ |
| Data Type: |
dtr-types:textBlockItemType |
| Balance Type: |
na |
| Period Type: |
duration |
|
| X |
- DefinitionDisclosure of accounting policy for revenue. Includes revenue from contract with customer and from other sources. Reference 1: http://www.xbrl.org/2003/role/disclosureRef
-Topic 946
-SubTopic 220
-Name Accounting Standards Codification
-Section S99
-Paragraph 1
-Subparagraph (SX 210.6-07(1))
-Publisher FASB
-URI https://asc.fasb.org//1943274/2147483575/946-220-S99-1
Reference 2: http://www.xbrl.org/2003/role/exampleRef
-Topic 235
-SubTopic 10
-Name Accounting Standards Codification
-Section 50
-Paragraph 4
-Subparagraph (f)
-Publisher FASB
-URI https://asc.fasb.org//1943274/2147483426/235-10-50-4
Reference 3: http://www.xbrl.org/2003/role/exampleRef
-Name Accounting Standards Codification
-Section 50
-Paragraph 4
-Subparagraph (e)
-SubTopic 10
-Topic 235
-Publisher FASB
-URI https://asc.fasb.org//1943274/2147483426/235-10-50-4
| Name: |
us-gaap_RevenueRecognitionPolicyTextBlock |
| Namespace Prefix: |
us-gaap_ |
| Data Type: |
dtr-types:textBlockItemType |
| Balance Type: |
na |
| Period Type: |
duration |
|
| X |
- DefinitionDisclosure of accounting policy for the use of estimates in the preparation of financial statements in conformity with generally accepted accounting principles. Reference 1: http://fasb.org/us-gaap/role/ref/legacyRef
-Name Accounting Standards Codification
-Topic 275
-SubTopic 10
-Section 50
-Paragraph 9
-Publisher FASB
-URI https://asc.fasb.org//1943274/2147482861/275-10-50-9
Reference 2: http://fasb.org/us-gaap/role/ref/legacyRef
-Name Accounting Standards Codification
-Topic 275
-SubTopic 10
-Section 50
-Paragraph 4
-Publisher FASB
-URI https://asc.fasb.org//1943274/2147482861/275-10-50-4
Reference 3: http://www.xbrl.org/2003/role/disclosureRef
-Name Accounting Standards Codification
-Section 50
-Paragraph 1
-Subparagraph (b)
-SubTopic 10
-Topic 275
-Publisher FASB
-URI https://asc.fasb.org//1943274/2147482861/275-10-50-1
Reference 4: http://www.xbrl.org/2003/role/disclosureRef
-Name Accounting Standards Codification
-Section 50
-Paragraph 1
-Subparagraph (c)
-SubTopic 10
-Topic 275
-Publisher FASB
-URI https://asc.fasb.org//1943274/2147482861/275-10-50-1
Reference 5: http://www.xbrl.org/2003/role/disclosureRef
-Name Accounting Standards Codification
-Section 50
-Paragraph 11
-SubTopic 10
-Topic 275
-Publisher FASB
-URI https://asc.fasb.org//1943274/2147482861/275-10-50-11
Reference 6: http://www.xbrl.org/2003/role/disclosureRef
-Name Accounting Standards Codification
-Section 50
-Paragraph 12
-SubTopic 10
-Topic 275
-Publisher FASB
-URI https://asc.fasb.org//1943274/2147482861/275-10-50-12
Reference 7: http://fasb.org/us-gaap/role/ref/legacyRef
-Name Accounting Standards Codification
-Topic 275
-SubTopic 10
-Section 50
-Paragraph 8
-Publisher FASB
-URI https://asc.fasb.org//1943274/2147482861/275-10-50-8
| Name: |
us-gaap_UseOfEstimates |
| Namespace Prefix: |
us-gaap_ |
| Data Type: |
dtr-types:textBlockItemType |
| Balance Type: |
na |
| Period Type: |
duration |
|
v3.23.3
ORGANIZATION AND BUSINESS BACKGROUND (Tables)
|
9 Months Ended |
Sep. 30, 2023 |
|---|
| Organization, Consolidation and Presentation of Financial Statements [Abstract] |
|
| SCHEDULE OF SUBSIDIARIES |
SCHEDULE OF SUBSIDIARIES
| No. |
|
Subsidiary
Company
Name |
|
Domicile
and Date of Incorporation |
|
Particulars
of
Issued
Capital |
|
Principal
Activities |
| 1 |
|
AsiaFIN
Holdings Corp. |
|
Labuan
at July 15, 2019 |
|
1
shares of common stock |
|
Investment
holding company |
| |
|
|
|
|
|
|
|
|
| 2 |
|
AsiaFIN
Holdings Limited |
|
Hong
Kong at July 5, 2019 |
|
1
shares of common stock |
|
Investment
holding company |
| |
|
|
|
|
|
|
|
|
| 3 |
|
StarFIN
Holdings Limited |
|
British
Virgin Island at August 19, 2021 |
|
10,000
shares of common stock |
|
Investment
holding company |
| |
|
|
|
|
|
|
|
|
| 4 |
|
Insite
MY Holdings Sdn Bhd (FKA StarFIN Asia Sdn Bhd) |
|
Malaysia
at May 24, 2018 |
|
11,400,102
shares of common stock |
|
Investment
holding company |
| |
|
|
|
|
|
|
|
|
| 5 |
|
OrangeFIN
Academy Sdn Bhd (FKA Insite MY.Com Sdn Bhd) |
|
Malaysia
at February 2, 2000 |
|
100,000
shares of common stock |
|
Provision
of business system integration and management services |
| |
|
|
|
` |
|
|
|
|
| 6 |
|
Insite
MY Systems Sdn Bhd |
|
Malaysia
at January 18, 2000 |
|
500,000
shares of common stock |
|
Provision
of information technology services |
| |
|
|
|
|
|
|
|
|
| 7 |
|
Insite
MY Innovations Sdn Bhd |
|
Malaysia
at January 18, 2010 |
|
540,000
shares of common stock |
|
Provision
of information technology services |
| |
|
|
|
|
|
|
|
|
| 8 |
|
OrangeFIN
Asia Sdn Bhd |
|
Malaysia
at January 25, 2018 |
|
50,000
shares of common stock |
|
Provision
of computer programming activities and services |
| |
|
|
|
|
|
|
|
|
| 9 |
|
TellUS
Report Sdn Bhd |
|
Malaysia
at September 22, 2023 |
|
60
shares of common stock |
|
Provision
of information technology services |
| No. |
|
Associate
Company
Name |
|
Domicile
and Date of Incorporation |
|
Particulars
of
Issued
Capital |
|
Principal
Activities |
| 1 |
|
Murni
StarFIN Sdn Bhd |
|
Malaysia
at September 9, 2022 |
|
100,000
shares of common stock |
|
Provision
of information technology services |
|
| X |
- DefinitionSchedule of subsidiary and associate details [Table Text Block]
| Name: |
ASFH_ScheduleOfSubsidiaryAndAssociateDetailsTableTextBlock |
| Namespace Prefix: |
ASFH_ |
| Data Type: |
dtr-types:textBlockItemType |
| Balance Type: |
na |
| Period Type: |
duration |
|
| X |
- References
+ Details
| Name: |
us-gaap_OrganizationConsolidationAndPresentationOfFinancialStatementsAbstract |
| Namespace Prefix: |
us-gaap_ |
| Data Type: |
xbrli:stringItemType |
| Balance Type: |
na |
| Period Type: |
duration |
|
v3.23.3
SUMMARY OF SIGNIFICANT ACCOUNTING POLICIES (Tables)
|
9 Months Ended |
Sep. 30, 2023 |
|---|
| Accounting Policies [Abstract] |
|
| SCHEDULE OF PLANT AND EQUIPMENT DEPRECIATION PERIODS |
Property,
plant and equipment are stated at cost, with depreciation and amortization provided using the straight-line method over the following
periods:
SCHEDULE
OF PLANT AND EQUIPMENT DEPRECIATION PERIODS
| Asset
Categories |
|
Depreciation
Periods |
| Renovation |
|
over
the remaining lease period |
| Computer
Systems |
|
4
to 5 years |
| Furniture
and Fittings |
|
10
years |
| Electrical
Fittings |
|
10
years |
| Handphone |
|
5
years |
| Office
Equipment |
|
10
years |
| Motor
Vehicle |
|
5
years |
| Property |
|
50
years |
|
| SCHEDULE OF FOREIGN EXCHANGE RATE |
Translation
of amounts from the local currency of the Company into US$1 has been made at the following exchange rates for the respective periods:
SCHEDULE OF FOREIGN EXCHANGE RATE
| | |
As of and for the period ended September 30 | |
| | |
2023 | | |
2022 | |
| Period-end MYR : US$1 exchange rate | |
| 4.70 | | |
| 4.53 | |
| Period-average MYR : US$1 exchange rate | |
| 4.53 | | |
| 4.35 | |
| Period-end HK$ : US$1 exchange rate | |
| 7.75 | | |
| 7.85 | |
| Period-average HK$ : US$1 exchange rate | |
| 7.75 | | |
| 7.84 | |
|
| X |
- DefinitionProperty Plant And Equipment Assets Categories Table [Text Block]
| Name: |
ASFH_PropertyPlantAndEquipmentAssetsCategoriesTableTextBlock |
| Namespace Prefix: |
ASFH_ |
| Data Type: |
dtr-types:textBlockItemType |
| Balance Type: |
na |
| Period Type: |
duration |
|
| X |
- References
+ Details
| Name: |
us-gaap_AccountingPoliciesAbstract |
| Namespace Prefix: |
us-gaap_ |
| Data Type: |
xbrli:stringItemType |
| Balance Type: |
na |
| Period Type: |
duration |
|
| X |
- DefinitionTabular disclosure of the U.S. dollar denominated balances, balances reported for financial reporting purposes and the differences between the two balances by each relevant line item on the financial statements. Reference 1: http://fasb.org/us-gaap/role/ref/legacyRef
-Name Accounting Standards Codification
-Topic 830
-SubTopic 30
-Section S99
-Paragraph 1
-Publisher FASB
-URI https://asc.fasb.org//1943274/2147479424/830-30-S99-1
| Name: |
us-gaap_ScheduleOfDifferencesBetweenReportedAmountAndReportingCurrencyDenominatedAmountTableTextBlock |
| Namespace Prefix: |
us-gaap_ |
| Data Type: |
dtr-types:textBlockItemType |
| Balance Type: |
na |
| Period Type: |
duration |
|
v3.23.3
BUSINESS COMBINATIONS (Tables)
|
9 Months Ended |
Sep. 30, 2023 |
|---|
| Business Combination and Asset Acquisition [Abstract] |
|
| SCHEDULE OF PURCHASE PRICE ALLOCATION |
SCHEDULE
OF PURCHASE PRICE ALLOCATION
| | |
| | |
| Cash and cash equivalents | |
$ | 705,480 | |
| Trade receivables, net | |
| 676,396 | |
| Deposits paid, prepayments and other receivables | |
| 202,414 | |
| Tax assets | |
| 539,969 | |
| Investment in Associates – Murni StarFIN Sdn Bhd | |
| 8,657 | |
| Property, plant and equipment, net | |
| 585,816 | |
| Trade payable | |
| (24,736 | ) |
| Accrued expenses and other payables | |
| (734,476 | ) |
| Deferred tax liabilities | |
| (213,524 | ) |
| Hire purchase loan | |
| (16,554 | ) |
| Amount due to directors | |
| (283,703 | ) |
| Amount due to related parties | |
| (1,673 | ) |
| Adjustment for foreign exchange fluctuation | |
| 260,052 | |
| Fair value of StarFIN Holdings Limited | |
$ | 1,704,118 | |
| Fair value of consideration | |
| (9,055,242 | ) |
| Goodwill | |
$ | 7,351,124 | |
| Goodwill impairment | |
| (7,351,124 | ) |
|
| X |
- References
+ Details
| Name: |
us-gaap_BusinessCombinationAndAssetAcquisitionAbstract |
| Namespace Prefix: |
us-gaap_ |
| Data Type: |
xbrli:stringItemType |
| Balance Type: |
na |
| Period Type: |
duration |
|
| X |
- DefinitionTabular disclosure of goodwill in a business combination. Reference 1: http://fasb.org/us-gaap/role/ref/legacyRef
-Name Accounting Standards Codification
-Section 50
-Paragraph 1
-SubTopic 30
-Topic 805
-Publisher FASB
-URI https://asc.fasb.org//1943274/2147479581/805-30-50-1
| Name: |
us-gaap_BusinessCombinationSegmentAllocationTableTextBlock |
| Namespace Prefix: |
us-gaap_ |
| Data Type: |
dtr-types:textBlockItemType |
| Balance Type: |
na |
| Period Type: |
duration |
|
v3.23.3
TRADE RECEIVABLE (Tables)
|
9 Months Ended |
Sep. 30, 2023 |
|---|
| Credit Loss [Abstract] |
|
| SCHEDULE OF TRADE RECEIVABLE |
SCHEDULE OF TRADE RECEIVABLE
| | |
As of September 30, 2023 | | |
As of December 31, 2022 | |
| Trade receivable, gross | |
$ | 612,461 | | |
$ | - | |
| Allowance for expected credit loss | |
| (82,220 | ) | |
| - | |
| Trade receivable, net | |
$ | 530,241 | | |
$ | - | |
|
| X |
- References
+ Details
| Name: |
us-gaap_CreditLossAbstract |
| Namespace Prefix: |
us-gaap_ |
| Data Type: |
xbrli:stringItemType |
| Balance Type: |
na |
| Period Type: |
duration |
|
| X |
- DefinitionTabular disclosure of the various types of trade accounts and notes receivable and for each the gross carrying value, allowance, and net carrying value as of the balance sheet date. Presentation is categorized by current, noncurrent and unclassified receivables. Reference 1: http://fasb.org/us-gaap/role/ref/legacyRef
-Name Accounting Standards Codification
-Topic 210
-SubTopic 10
-Section S99
-Paragraph 1
-Subparagraph (SX 210.5-02.3,4)
-Publisher FASB
-URI https://asc.fasb.org//1943274/2147480566/210-10-S99-1
| Name: |
us-gaap_ScheduleOfAccountsNotesLoansAndFinancingReceivableTextBlock |
| Namespace Prefix: |
us-gaap_ |
| Data Type: |
dtr-types:textBlockItemType |
| Balance Type: |
na |
| Period Type: |
duration |
|
v3.23.3
| X |
- References
+ Details
| Name: |
ASFH_DisclosurePrepaymentDepositsAndOtherReceivablesAbstract |
| Namespace Prefix: |
ASFH_ |
| Data Type: |
xbrli:stringItemType |
| Balance Type: |
na |
| Period Type: |
duration |
|
| X |
- DefinitionTabular disclosure of the amounts paid in advance for capitalized costs that will be expensed with the passage of time or the occurrence of a triggering event, and will be charged against earnings within one year or the normal operating cycle, if longer; the aggregate carrying amount of current assets, not separately presented elsewhere in the balance sheet; and other deferred costs.
| Name: |
us-gaap_DeferredCostsCapitalizedPrepaidAndOtherAssetsDisclosureTextBlock |
| Namespace Prefix: |
us-gaap_ |
| Data Type: |
dtr-types:textBlockItemType |
| Balance Type: |
na |
| Period Type: |
duration |
|
v3.23.3
PROPERTY, PLANT AND EQUIPMENT, NET (Tables)
|
9 Months Ended |
Sep. 30, 2023 |
|---|
| Property, Plant and Equipment [Abstract] |
|
| SCHEDULE OF PLANT AND EQUIPMENT |
SCHEDULE OF PLANT AND EQUIPMENT
| | |
As of September 30, 2023 | | |
As of December 31, 2022 | |
| Computer systems | |
$ | 253,420 | | |
$ | - | |
| Furniture and fittings | |
| 78,128 | | |
| - | |
| Electrical fittings | |
| 9,587 | | |
| - | |
| Handphone | |
| 48,358 | | |
| - | |
| Office equipment | |
| 91,146 | | |
| - | |
| Renovation | |
| 81,221 | | |
| - | |
| Motor vehicle | |
| 356,492 | | |
| - | |
| Property | |
| 394,019 | | |
| - | |
| Total property, plant and equipment | |
$ | 1,312,371 | | |
$ | - | |
| Less: Accumulated depreciation | |
| (792,408 | ) | |
| - | |
| Total property, plant and equipment, net | |
$ | 519,963 | | |
$ | - | |
|
| SCHEDULE OF INVESTMENT IN PROPERTY AND PLANT |
SCHEDULE OF INVESTMENT IN PROPERTY AND PLANT
| | |
For nine months
ended
September 30,
2023 | | |
For the year
ended
December 31,
2022 | |
| Investment in computer systems | |
$ | 17,479 | | |
$ | - | |
| Investment in furniture and fittings | |
| 374 | | |
| - | |
| Investment in electrical fittings | |
| 280 | | |
| - | |
| Investment in handphone | |
| 1,874 | | |
| - | |
| Investment in office equipment | |
| 6,216 | | |
| - | |
| Investment in renovation | |
| 4,097 | | |
| - | |
| Total investment in property and plant | |
$ | 30,320 | | |
$ | - | |
| | |
| | | |
| | |
| Depreciation for the period | |
| 34,234 | | |
$ | - | |
|
| X |
- DefinitionSchedule Of Investment In Property And Plant Table [Text Block]
| Name: |
ASFH_ScheduleOfInvestmentInPropertyAndPlantTableTextBlock |
| Namespace Prefix: |
ASFH_ |
| Data Type: |
dtr-types:textBlockItemType |
| Balance Type: |
na |
| Period Type: |
duration |
|
| X |
- References
+ Details
| Name: |
us-gaap_PropertyPlantAndEquipmentAbstract |
| Namespace Prefix: |
us-gaap_ |
| Data Type: |
xbrli:stringItemType |
| Balance Type: |
na |
| Period Type: |
duration |
|
| X |
- DefinitionTabular disclosure of physical assets used in the normal conduct of business and not intended for resale. Includes, but is not limited to, balances by class of assets, depreciation and depletion expense and method used, including composite depreciation, and accumulated deprecation. Reference 1: http://fasb.org/us-gaap/role/ref/legacyRef
-Name Accounting Standards Codification
-Section 50
-Paragraph 1
-SubTopic 10
-Topic 360
-Publisher FASB
-URI https://asc.fasb.org//1943274/2147482099/360-10-50-1
| Name: |
us-gaap_PropertyPlantAndEquipmentTextBlock |
| Namespace Prefix: |
us-gaap_ |
| Data Type: |
dtr-types:textBlockItemType |
| Balance Type: |
na |
| Period Type: |
duration |
|
v3.23.3
| X |
- References
+ Details
| Name: |
ASFH_DisclosureOtherPayablesAndAccruedLiabilitiesAbstract |
| Namespace Prefix: |
ASFH_ |
| Data Type: |
xbrli:stringItemType |
| Balance Type: |
na |
| Period Type: |
duration |
|
| X |
- DefinitionTabular disclosure of the components of accrued liabilities.
| Name: |
us-gaap_ScheduleOfAccruedLiabilitiesTableTextBlock |
| Namespace Prefix: |
us-gaap_ |
| Data Type: |
dtr-types:textBlockItemType |
| Balance Type: |
na |
| Period Type: |
duration |
|
v3.23.3
HIRE PURCHASE (Tables)
|
9 Months Ended |
Sep. 30, 2023 |
|---|
| Hire Purchase |
|
| SCHEDULE OF MATURITIES OF THE LOAN |
Maturities
of the loan for each of the two years and thereafter are as follows:
SCHEDULE OF MATURITIES OF THE LOAN
| Year ending December 31 | |
| | |
| 2023 | |
$ | 2,756 | |
| 2024 | |
$ | 4,650 | |
| Total | |
$ | 7,406 | |
|
| X |
- References
+ Details
| Name: |
ASFH_DisclosureHirePurchaseAbstract |
| Namespace Prefix: |
ASFH_ |
| Data Type: |
xbrli:stringItemType |
| Balance Type: |
na |
| Period Type: |
duration |
|
| X |
- DefinitionTabular disclosure of maturity and sinking fund requirement for long-term debt. Reference 1: http://fasb.org/us-gaap/role/ref/legacyRef
-Name Accounting Standards Codification
-Section 50
-Paragraph 1
-SubTopic 10
-Topic 470
-Publisher FASB
-URI https://asc.fasb.org//1943274/2147481544/470-10-50-1
| Name: |
us-gaap_ScheduleOfMaturitiesOfLongTermDebtTableTextBlock |
| Namespace Prefix: |
us-gaap_ |
| Data Type: |
dtr-types:textBlockItemType |
| Balance Type: |
na |
| Period Type: |
duration |
|
v3.23.3
LEASE RIGHT-OF-USE ASSET AND LEASE LIABILITIES (Tables)
|
9 Months Ended |
Sep. 30, 2023 |
|---|
| Lease Right-of-use Asset And Lease Liabilities |
|
| SCHEDULE OF LEASE RIGHT OF USE ASSETS AND LEASE LIABILITIES |
SCHEDULE OF LEASE RIGHT OF USE ASSETS AND LEASE LIABILITIES
| Right-Of-Use Assets | |
| | |
| Purchase price allocation pertaining to acquisition of StarFIN Holdings Limited | |
$ | 134,807 | |
| New lease recognized | |
| 16,513 | |
| Amortization for the nine months ended September 30, 2023 | |
| (65,252 | ) |
| Adjustment for foreign currency translation difference | |
| (6,161 | ) |
| Balance as of September 30, 2023 | |
$ | 79,907 | |
| | |
| | |
| Lease Liability | |
| | |
| Purchase price allocation pertaining to acquisition of StarFIN Holdings Limited | |
$ | 134,807 | |
| New lease recognized | |
| 16,513 | |
| Imputed interest for nine months ended September 30, 2023 | |
| 4,114 | |
| Gross repayment for nine months ended September 30, 2023 | |
| (69,366 | ) |
| Adjustment for foreign currency translation difference | |
| (6,161 | ) |
| Balance as of September 30, 2023 | |
| 79,907 | |
| | |
| | |
| Lease liability current portion | |
| 74,204 | |
| Lease liability non-current portion | |
$ | 5,703 | |
|
| SCHEDULE OF OTHER INFORMATION |
Other
information:
SCHEDULE OF OTHER INFORMATION
| | |
Nine months ended
September 30, 2023 | | |
Nine months ended
September 30, 2022 | |
| Cash paid for amounts included in the measurement of lease liabilities: | |
| | | |
| | |
| Operating cash flow to operating lease | |
$ | 69,366 | | |
$ | - | |
| Right-of-use assets obtained in exchange for operating lease liabilities | |
| - | | |
| - | |
| Remaining lease term for operating lease (years) | |
| 1.02 | | |
| - | |
| Weighted average discount rate for operating lease | |
| 5.40 | % | |
| - | % |
|
| X |
- References
+ Details
| Name: |
ASFH_DisclosureLeaseRightofuseAssetAndLeaseLiabilitiesAbstract |
| Namespace Prefix: |
ASFH_ |
| Data Type: |
xbrli:stringItemType |
| Balance Type: |
na |
| Period Type: |
duration |
|
| X |
- DefinitionSchedule Of Lease Right Of Use Assets And Lease Liabilities Table [Text Block]
| Name: |
ASFH_ScheduleOfLeaseRightOfUseAssetsAndLeaseLiabilitiesTableTextBlock |
| Namespace Prefix: |
ASFH_ |
| Data Type: |
dtr-types:textBlockItemType |
| Balance Type: |
na |
| Period Type: |
duration |
|
| X |
- DefinitionSchedule Of Other Information Table [Text Block]
| Name: |
ASFH_ScheduleOfOtherInformationTableTextBlock |
| Namespace Prefix: |
ASFH_ |
| Data Type: |
dtr-types:textBlockItemType |
| Balance Type: |
na |
| Period Type: |
duration |
|
v3.23.3
RELATED PARTY TRANSACTIONS (Tables)
|
9 Months Ended |
Sep. 30, 2023 |
|---|
| Related Party Transactions [Abstract] |
|
| SCHEDULE OF RELATED PARTIES TRANSACTIONS |
For the nine months ended September 30, 2023 and 2022, the Company has following transactions with related parties:
SCHEDULE
OF RELATED PARTIES TRANSACTIONS
| | |
Nine months ended September 30, 2023 | | |
Nine months ended September 30, 2022 | |
| Purchases | |
| | | |
| | |
| - Insite MY International, Inc. | |
$ | 92,632 | | |
$ | - | |
| | |
| | | |
| | |
| Total | |
$ | 92,632 | | |
$ | - | |
|
| X |
- DefinitionTabular disclosure of related party transactions. Examples of related party transactions include, but are not limited to, transactions between (a) a parent company and its subsidiary; (b) subsidiaries of a common parent; (c) and entity and its principal owners and (d) affiliates.
| Name: |
us-gaap_ScheduleOfRelatedPartyTransactionsTableTextBlock |
| Namespace Prefix: |
us-gaap_ |
| Data Type: |
dtr-types:textBlockItemType |
| Balance Type: |
na |
| Period Type: |
duration |
|
v3.23.3
CONCENTRATION OF RISK (Tables)
|
9 Months Ended |
Sep. 30, 2023 |
|---|
| Customer Concentration Risk [Member] |
|
| Concentration Risk [Line Items] |
|
| SCHEDULE OF CONCENTRATION OF RISK |
SCHEDULE OF CONCENTRATION OF RISK
| | |
For the three months ended September 30 | |
| | |
2023 | | |
2022 | | |
2023 | | |
2022 | | |
2023 | | |
2022 | |
| | |
Revenue | | |
Percentage of Revenue | | |
Accounts receivable, gross | |
| | |
| | |
| | |
| | |
| | |
| | |
| |
| Customer F | |
$ | 96,312 | | |
$ | - | | |
| 14 | % | |
| - | % | |
$ | - | | |
$ | - | |
| Customer G | |
| 71,499 | | |
| - | | |
| 10 | % | |
| - | | |
| 76,696 | | |
| - | |
| Others | |
| 527,334 | | |
| - | | |
| 76 | % | |
| - | % | |
| 535,765 | | |
| - | |
| Total | |
$ | 695,145 | | |
$ | - | | |
| 100 | % | |
| - | % | |
$ | 612,461 | | |
$ | - | |
For
the nine months ended September 30, 2023, the Company generated total revenue of $1,813,426, of which no customer accounted for more
than 10% of the Company’s total revenue. For the nine months ended September 30, 2022, the Company does not generate any revenue
and hence there was no customer accounted for more than 10% of the Company’s revenue.
For
the three months ended September 30, 2023, the Company incurred cost of revenue of $33,524, of which two suppliers accounted for more
than 10% of the Company’s cost of revenue. For the three months ended September 30, 2022, the Company does not incur any cost of
revenue and hence there was no supplier accounted for more than 10% of the Company’s cost of revenue. The suppliers who accounted
for more than 10% of the Company’s cost of revenue and its outstanding payable balance at period-end is presented below:
SCHEDULE OF CONCENTRATION OF RISK
| |
|
For
the three months ended September 30 |
|
| |
|
2023 |
|
|
2022 |
|
|
2023 |
|
|
2022 |
|
|
2023 |
|
|
2022 |
|
| |
|
Cost
of revenue |
|
|
Percentage
of
Cost
of revenue |
|
|
Accounts
payable,
trade |
|
| |
|
|
|
|
|
|
|
|
|
|
|
|
|
|
|
|
|
|
| Supplier
A |
|
$ |
46,018 |
|
|
$ |
- |
|
|
|
76 |
% |
|
|
- |
% |
|
$ |
19,027 |
|
|
$ |
- |
|
| Supplier
B |
|
|
9,362 |
|
|
|
- |
|
|
|
15 |
% |
|
|
- |
% |
|
|
3,367 |
|
|
|
- |
|
| Others |
|
|
5,358 |
|
|
|
- |
|
|
|
9 |
% |
|
|
- |
% |
|
|
162 |
|
|
|
- |
|
| Total |
|
$ |
33,524 |
|
|
$ |
- |
|
|
|
100 |
% |
|
|
- |
% |
|
$ |
22,556 |
|
|
$ |
- |
|
For
the nine months ended September 30, 2023, the Company incurred cost of revenue of $147,924, of which two suppliers accounted for more
than 10% of the Company’s cost of revenue. For the nine months ended September 30, 2022, the Company does not incur any cost of
revenue and hence there was no supplier accounted for more than 10% of the Company’s cost of revenue. The suppliers who accounted
for more than 10% of the Company’s cost of revenue and its outstanding payable balance at period-end is presented below:
| | |
For the nine months ended September 30 | |
| | |
2023 | | |
2022 | | |
2023 | | |
2022 | | |
2023 | | |
2022 | |
| | |
Cost of revenue | | |
Percentage of Cost of revenue | | |
Accounts payable, trade | |
| | |
| | |
| | |
| | |
| | |
| | |
| |
| Supplier A | |
$ | 92,632 | | |
$ | - | | |
| 63 | % | |
| - | % | |
$ | 19,027 | | |
$ | - | |
| Supplier B | |
| 32,053 | | |
| - | | |
| 22 | % | |
| - | % | |
| 3,367 | | |
| - | |
| Others | |
| 23,239 | | |
| - | | |
| 15 | % | |
| - | % | |
| 162 | | |
| - | |
| Total | |
$ | 147,924 | | |
$ | - | | |
| 100 | % | |
| - | % | |
$ | 22,556 | | |
$ | - | |
|
| Supplier Concentration Risk [Member] |
|
| Concentration Risk [Line Items] |
|
| SCHEDULE OF CONCENTRATION OF RISK |
SCHEDULE OF CONCENTRATION OF RISK
| |
|
For
the three months ended September 30 |
|
| |
|
2023 |
|
|
2022 |
|
|
2023 |
|
|
2022 |
|
|
2023 |
|
|
2022 |
|
| |
|
Cost
of revenue |
|
|
Percentage
of
Cost
of revenue |
|
|
Accounts
payable,
trade |
|
| |
|
|
|
|
|
|
|
|
|
|
|
|
|
|
|
|
|
|
| Supplier
A |
|
$ |
46,018 |
|
|
$ |
- |
|
|
|
76 |
% |
|
|
- |
% |
|
$ |
19,027 |
|
|
$ |
- |
|
| Supplier
B |
|
|
9,362 |
|
|
|
- |
|
|
|
15 |
% |
|
|
- |
% |
|
|
3,367 |
|
|
|
- |
|
| Others |
|
|
5,358 |
|
|
|
- |
|
|
|
9 |
% |
|
|
- |
% |
|
|
162 |
|
|
|
- |
|
| Total |
|
$ |
33,524 |
|
|
$ |
- |
|
|
|
100 |
% |
|
|
- |
% |
|
$ |
22,556 |
|
|
$ |
- |
|
For
the nine months ended September 30, 2023, the Company incurred cost of revenue of $147,924, of which two suppliers accounted for more
than 10% of the Company’s cost of revenue. For the nine months ended September 30, 2022, the Company does not incur any cost of
revenue and hence there was no supplier accounted for more than 10% of the Company’s cost of revenue. The suppliers who accounted
for more than 10% of the Company’s cost of revenue and its outstanding payable balance at period-end is presented below:
| | |
For the nine months ended September 30 | |
| | |
2023 | | |
2022 | | |
2023 | | |
2022 | | |
2023 | | |
2022 | |
| | |
Cost of revenue | | |
Percentage of Cost of revenue | | |
Accounts payable, trade | |
| | |
| | |
| | |
| | |
| | |
| | |
| |
| Supplier A | |
$ | 92,632 | | |
$ | - | | |
| 63 | % | |
| - | % | |
$ | 19,027 | | |
$ | - | |
| Supplier B | |
| 32,053 | | |
| - | | |
| 22 | % | |
| - | % | |
| 3,367 | | |
| - | |
| Others | |
| 23,239 | | |
| - | | |
| 15 | % | |
| - | % | |
| 162 | | |
| - | |
| Total | |
$ | 147,924 | | |
$ | - | | |
| 100 | % | |
| - | % | |
$ | 22,556 | | |
$ | - | |
|
| X |
- DefinitionLine items represent financial concepts included in a table. These concepts are used to disclose reportable information associated with domain members defined in one or many axes to the table. Reference 1: http://www.xbrl.org/2003/role/disclosureRef
-Topic 954
-SubTopic 310
-Name Accounting Standards Codification
-Section 50
-Paragraph 2
-Publisher FASB
-URI https://asc.fasb.org//1943274/2147481027/954-310-50-2
| Name: |
us-gaap_ConcentrationRiskLineItems |
| Namespace Prefix: |
us-gaap_ |
| Data Type: |
xbrli:stringItemType |
| Balance Type: |
na |
| Period Type: |
duration |
|
| X |
- DefinitionTabular disclosure of the nature of a concentration, a benchmark to which it is compared, and the percentage that the risk is to the benchmark. Reference 1: http://fasb.org/us-gaap/role/ref/legacyRef
-Topic 825
-SubTopic 10
-Name Accounting Standards Codification
-Section 50
-Paragraph 21
-Publisher FASB
-URI https://asc.fasb.org//1943274/2147482907/825-10-50-21
Reference 2: http://fasb.org/us-gaap/role/ref/legacyRef
-Name Accounting Standards Codification
-Topic 825
-SubTopic 10
-Section 50
-Paragraph 20
-Publisher FASB
-URI https://asc.fasb.org//1943274/2147482907/825-10-50-20
Reference 3: http://fasb.org/us-gaap/role/ref/legacyRef
-Name Accounting Standards Codification
-Topic 275
-SubTopic 10
-Section 50
-Paragraph 18
-Publisher FASB
-URI https://asc.fasb.org//1943274/2147482861/275-10-50-18
Reference 4: http://fasb.org/us-gaap/role/ref/legacyRef
-Name Accounting Standards Codification
-Topic 275
-SubTopic 10
-Section 50
-Paragraph 20
-Publisher FASB
-URI https://asc.fasb.org//1943274/2147482861/275-10-50-20
Reference 5: http://fasb.org/us-gaap/role/ref/legacyRef
-Name Accounting Standards Codification
-Topic 275
-SubTopic 10
-Section 50
-Paragraph 16
-Publisher FASB
-URI https://asc.fasb.org//1943274/2147482861/275-10-50-16
Reference 6: http://fasb.org/us-gaap/role/ref/legacyRef
-Name Accounting Standards Codification
-Topic 275
-SubTopic 10
-Section 50
-Paragraph 21
-Publisher FASB
-URI https://asc.fasb.org//1943274/2147482861/275-10-50-21
| Name: |
us-gaap_SchedulesOfConcentrationOfRiskByRiskFactorTextBlock |
| Namespace Prefix: |
us-gaap_ |
| Data Type: |
dtr-types:textBlockItemType |
| Balance Type: |
na |
| Period Type: |
duration |
|
| X |
- Details
| Name: |
us-gaap_ConcentrationRiskByTypeAxis=us-gaap_CustomerConcentrationRiskMember |
| Namespace Prefix: |
|
| Data Type: |
na |
| Balance Type: |
|
| Period Type: |
|
|
| X |
- Details
| Name: |
us-gaap_ConcentrationRiskByTypeAxis=us-gaap_SupplierConcentrationRiskMember |
| Namespace Prefix: |
|
| Data Type: |
na |
| Balance Type: |
|
| Period Type: |
|
|
v3.23.3
INCOME TAXES (Tables)
|
9 Months Ended |
Sep. 30, 2023 |
|---|
| Income Tax Disclosure [Abstract] |
|
| SCHEDULE OF PROVISION FOR INCOME TAXES |
The
loss before income taxes of the Company for the nine months ended September 30, 2023 and 2022 were comprised of the following:
SCHEDULE OF COMPONENTS OF LOSS BEFORE INCOME TAXES
| | |
| | | |
| | |
| | |
For the nine months ended September 30 | |
| | |
2023 | | |
2022 | |
| Tax jurisdictions from: | |
| | | |
| | |
| - Local | |
$ | ) | |
$ | ) |
| - Foreign, representing: | |
| | | |
| | |
| British Virginia Island (non-taxable jurisdiction) | |
| (300 | ) | |
| - | |
Provision
for income taxes consisted of the following:
SCHEDULE OF PROVISION FOR INCOME TAXES
| | |
| | | |
| | |
| | |
For the nine months ended September 30 | |
| | |
2023 | | |
2022 | |
| Current: | |
| | | |
| | |
| - Local | |
$ | - | | |
$ | - | |
| - Foreign | |
$ | (29,409 | ) | |
$ | (1,137 | ) |
| | |
| | | |
| | |
| Deferred tax assets: | |
| | | |
| | |
| - Local | |
$ | - | | |
$ | - | |
| - Foreign | |
$ | 819 | | |
$ | - | |
| | |
| | | |
| | |
| Deferred tax liabilities: | |
| | | |
| | |
| - Local | |
$ | - | | |
$ | - | |
| - Foreign | |
$ | 12,824 | | |
$ | - | |
| | |
| | | |
| | |
| Income tax payable: | |
| | | |
| | |
| - Local | |
$ | - | | |
$ | - | |
| - Foreign | |
$ | 3,357 | | |
$ | - | |
| | |
| | | |
| | |
| Income tax assets: | |
| | | |
| | |
| - Local | |
$ | - | | |
$ | - | |
| - Foreign | |
$ | 243,227 | | |
$ | - | |
|
| SCHEDULE OF PROVISION FOR INCOME TAXES |
Provision
for income taxes consisted of the following:
SCHEDULE OF PROVISION FOR INCOME TAXES
| | |
| | | |
| | |
| | |
For the nine months ended September 30 | |
| | |
2023 | | |
2022 | |
| Current: | |
| | | |
| | |
| - Local | |
$ | - | | |
$ | - | |
| - Foreign | |
$ | (29,409 | ) | |
$ | (1,137 | ) |
| | |
| | | |
| | |
| Deferred tax assets: | |
| | | |
| | |
| - Local | |
$ | - | | |
$ | - | |
| - Foreign | |
$ | 819 | | |
$ | - | |
| | |
| | | |
| | |
| Deferred tax liabilities: | |
| | | |
| | |
| - Local | |
$ | - | | |
$ | - | |
| - Foreign | |
$ | 12,824 | | |
$ | - | |
| | |
| | | |
| | |
| Income tax payable: | |
| | | |
| | |
| - Local | |
$ | - | | |
$ | - | |
| - Foreign | |
$ | 3,357 | | |
$ | - | |
| | |
| | | |
| | |
| Income tax assets: | |
| | | |
| | |
| - Local | |
$ | - | | |
$ | - | |
| - Foreign | |
$ | 243,227 | | |
$ | - | |
|
| X |
- DefinitionTabular disclosure of the components of income tax expense attributable to continuing operations for each year presented including, but not limited to: current tax expense (benefit), deferred tax expense (benefit), investment tax credits, government grants, the benefits of operating loss carryforwards, tax expense that results from allocating certain tax benefits either directly to contributed capital or to reduce goodwill or other noncurrent intangible assets of an acquired entity, adjustments of a deferred tax liability or asset for enacted changes in tax laws or rates or a change in the tax status of the entity, and adjustments of the beginning-of-the-year balances of a valuation allowance because of a change in circumstances that causes a change in judgment about the realizability of the related deferred tax asset in future years. Reference 1: http://fasb.org/us-gaap/role/ref/legacyRef
-Topic 740
-SubTopic 10
-Name Accounting Standards Codification
-Paragraph 9
-Section 50
-Publisher FASB
-URI https://asc.fasb.org//1943274/2147482685/740-10-50-9
| Name: |
us-gaap_ScheduleOfComponentsOfIncomeTaxExpenseBenefitTableTextBlock |
| Namespace Prefix: |
us-gaap_ |
| Data Type: |
dtr-types:textBlockItemType |
| Balance Type: |
na |
| Period Type: |
duration |
|
| X |
- DefinitionTabular disclosure of income before income tax between domestic and foreign jurisdictions. Reference 1: http://www.xbrl.org/2009/role/commonPracticeRef
-Topic 235
-SubTopic 10
-Name Accounting Standards Codification
-Section S99
-Paragraph 1
-Subparagraph (SX 210.4-08(h)(1)(Note 1))
-Publisher FASB
-URI https://asc.fasb.org//1943274/2147480678/235-10-S99-1
| Name: |
us-gaap_ScheduleOfIncomeBeforeIncomeTaxDomesticAndForeignTableTextBlock |
| Namespace Prefix: |
us-gaap_ |
| Data Type: |
dtr-types:textBlockItemType |
| Balance Type: |
na |
| Period Type: |
duration |
|
v3.23.3
SEGMENT REPORTING (Tables)
|
9 Months Ended |
Sep. 30, 2023 |
|---|
| Segment Reporting [Abstract] |
|
| SCHEDULE OF SEGMENT REPORTING |
SCHEDULE OF SEGMENT REPORTING
| | |
For the Nine Months Ended and As of September 30, 2023 | |
| By Business Unit | |
Information Technology Business | | |
Total | |
| Revenue | |
$ | 1,813,426 | | |
$ | 1,813,426 | |
| | |
| | | |
| | |
| Cost of revenue | |
| (147,924 | ) | |
| (147,924 | ) |
| | |
| | | |
| | |
| Gross profit | |
$ | 1,665,502 | | |
$ | 1,665,502 | |
| | |
| | | |
| | |
| Selling, general and administrative expenses and other income | |
| (2,122,375 | ) | |
| (2,122,375 | ) |
| | |
| | | |
| | |
| Loss from operations | |
| (456,873 | ) | |
| (456,873 | ) |
| | |
| | | |
| | |
| Total assets | |
$ | 2,695,731 | | |
$ | 2,695,731 | |
| Capital expenditure | |
$ | 30,320 | | |
$ | 30,320 | |
| | |
For the Nine Months Ended and As of September 30, 2023 | |
| By Country | |
Malaysia | | |
Non-Malaysia | | |
Total | |
| Revenue | |
$ | 1,813,426 | | |
$ | - | | |
$ | 1,813,426 | |
| | |
| | | |
| | | |
| | |
| Cost of revenue | |
| (147,924 | ) | |
| - | | |
| (147,924 | ) |
| | |
| | | |
| | | |
| | |
| Gross profit | |
$ | 1,665,502 | | |
$ | - | | |
$ | 1,665,502 | |
| | |
| | | |
| | | |
| | |
| Selling, general and administrative expenses and other income | |
| (1,927,468 | ) | |
| (194,907 | ) | |
| (2,122,375 | ) |
| | |
| | | |
| | | |
| | |
| Loss from operations | |
| (261,966 | ) | |
| (194,907 | ) | |
| (456,873 | ) |
| | |
| | | |
| | | |
| | |
| Total assets | |
$ | 2,658,020 | | |
$ | 37,711 | | |
$ | 2,695,731 | |
| Capital expenditure | |
$ | 30,320 | | |
$ | - | | |
$ | 30,320 | |
| | |
For the Nine Months Ended and As of September 30, 2022 | |
| By Business Unit | |
Information Technology Business | | |
Total | |
| Revenue | |
$ | - | | |
$ | - | |
| | |
| | | |
| | |
| Cost of revenue | |
| - | | |
| - | |
| | |
| | | |
| | |
| Gross profit | |
$ | - | | |
$ | - | |
| | |
| | | |
| | |
| General and administrative expenses and other income | |
| (63,576 | ) | |
| (63,576 | ) |
| | |
| | | |
| | |
| Loss from operations | |
| (63,576 | ) | |
| (63,576 | ) |
| | |
| | | |
| | |
| Total assets | |
$ | 919,874 | | |
$ | 919,874 | |
| Capital expenditure | |
$ | - | | |
$ | - | |
| | |
For the Nine Months Ended and As of September 30, 2022 | |
| By Country | |
Malaysia | | |
Non-Malaysia | | |
Total | |
| Revenue | |
$ | - | | |
$ | - | | |
$ | - | |
| | |
| | | |
| | | |
| | |
| Cost of revenue | |
| - | | |
| - | | |
| - | |
| | |
| | | |
| | | |
| | |
| Gross profit | |
$ | - | | |
$ | - | | |
$ | - | |
| | |
| | | |
| | | |
| | |
| General and administrative expenses and other income | |
| - | | |
| (63,576 | ) | |
| (63,576 | ) |
| | |
| | | |
| | | |
| | |
| Loss from operations | |
| - | | |
| (63,576 | ) | |
| (63,576 | ) |
| | |
| | | |
| | | |
| | |
| Total assets | |
$ | - | | |
$ | 919,874 | | |
$ | 919,874 | |
| Capital expenditure | |
$ | - | | |
$ | - | | |
$ | - | |
|
| X |
- DefinitionTabular disclosure of the profit or loss and total assets for each reportable segment. An entity discloses certain information on each reportable segment if the amounts (a) are included in the measure of segment profit or loss reviewed by the chief operating decision maker or (b) are otherwise regularly provided to the chief operating decision maker, even if not included in that measure of segment profit or loss. Reference 1: http://fasb.org/us-gaap/role/ref/legacyRef
-Name Accounting Standards Codification
-Topic 350
-SubTopic 20
-Section 50
-Paragraph 1
-Publisher FASB
-URI https://asc.fasb.org//1943274/2147482573/350-20-50-1
Reference 2: http://fasb.org/us-gaap/role/ref/legacyRef
-Name Accounting Standards Codification
-Topic 280
-SubTopic 10
-Section 50
-Paragraph 25
-Publisher FASB
-URI https://asc.fasb.org//1943274/2147482810/280-10-50-25
Reference 3: http://fasb.org/us-gaap/role/ref/legacyRef
-Name Accounting Standards Codification
-Topic 280
-SubTopic 10
-Section 50
-Paragraph 22
-Publisher FASB
-URI https://asc.fasb.org//1943274/2147482810/280-10-50-22
Reference 4: http://fasb.org/us-gaap/role/ref/legacyRef
-Name Accounting Standards Codification
-Topic 280
-SubTopic 10
-Section 50
-Paragraph 30
-Publisher FASB
-URI https://asc.fasb.org//1943274/2147482810/280-10-50-30
| Name: |
us-gaap_ScheduleOfSegmentReportingInformationBySegmentTextBlock |
| Namespace Prefix: |
us-gaap_ |
| Data Type: |
dtr-types:textBlockItemType |
| Balance Type: |
na |
| Period Type: |
duration |
|
| X |
- References
+ Details
| Name: |
us-gaap_SegmentReportingAbstract |
| Namespace Prefix: |
us-gaap_ |
| Data Type: |
xbrli:stringItemType |
| Balance Type: |
na |
| Period Type: |
duration |
|
v3.23.3
SCHEDULE OF SUBSIDIARIES (Details) - shares
|
9 Months Ended |
|
Sep. 30, 2023 |
Dec. 31, 2022 |
| Particulars of Issued Capital |
81,551,838
|
73,319,800
|
| AsiaFIN Holdings Corp. Labuan [Member] |
|
|
| Domicile and Date of Incorporation |
Labuan
at July 15, 2019
|
|
| Particulars of Issued Capital |
1
|
|
| Principal activities |
Investment
holding company
|
|
| AsiaFIN Holdings Limited (Hong Kong) [Member] |
|
|
| Domicile and Date of Incorporation |
Hong
Kong at July 5, 2019
|
|
| Particulars of Issued Capital |
1
|
|
| Principal activities |
Investment
holding company
|
|
| Star FIN Holdings Limited [Member] |
|
|
| Domicile and Date of Incorporation |
British
Virgin Island at August 19, 2021
|
|
| Particulars of Issued Capital |
10,000
|
|
| Principal activities |
Investment
holding company
|
|
| Star FIN Asia Sdn Bhd [Member] |
|
|
| Domicile and Date of Incorporation |
Malaysia
at May 24, 2018
|
|
| Particulars of Issued Capital |
11,400,102
|
|
| Principal activities |
Investment
holding company
|
|
| Insite M Y Com Sdn Bhd [Member] |
|
|
| Domicile and Date of Incorporation |
Malaysia
at February 2, 2000
|
|
| Particulars of Issued Capital |
100,000
|
|
| Principal activities |
Provision
of business system integration and management services
|
|
| Insite MY Systems Sdn Bhd [Member] |
|
|
| Domicile and Date of Incorporation |
Malaysia
at January 18, 2000
|
|
| Particulars of Issued Capital |
500,000
|
|
| Principal activities |
Provision
of information technology services
|
|
| Insite MY Innovations Sdn Bhd [Member] |
|
|
| Domicile and Date of Incorporation |
Malaysia
at January 18, 2010
|
|
| Particulars of Issued Capital |
540,000
|
|
| Principal activities |
Provision
of information technology services
|
|
| Orange FIN Asia Sdn Bhd [Member] |
|
|
| Domicile and Date of Incorporation |
Malaysia
at January 25, 2018
|
|
| Particulars of Issued Capital |
50,000
|
|
| Principal activities |
Provision
of computer programming activities and services
|
|
| Tell U S Report Sdn Bhd [Member] |
|
|
| Domicile and Date of Incorporation |
Malaysia
at September 22, 2023
|
|
| Particulars of Issued Capital |
60
|
|
| Principal activities |
Provision
of information technology services
|
|
| Murni Star FIN Sdn Bhd [Member] |
|
|
| Domicile and Date of Incorporation |
Malaysia
at September 9, 2022
|
|
| Particulars of Issued Capital |
100,000
|
|
| Principal activities |
Provision
of information technology services
|
|
| X |
- Definition
+ References
+ Details
| Name: |
ASFH_DescriptionOfAcquiredEntity |
| Namespace Prefix: |
ASFH_ |
| Data Type: |
xbrli:stringItemType |
| Balance Type: |
na |
| Period Type: |
duration |
|
| X |
- DefinitionTotal number of common shares of an entity that have been sold or granted to shareholders (includes common shares that were issued, repurchased and remain in the treasury). These shares represent capital invested by the firm's shareholders and owners, and may be all or only a portion of the number of shares authorized. Shares issued include shares outstanding and shares held in the treasury. Reference 1: http://fasb.org/us-gaap/role/ref/legacyRef
-Topic 210
-SubTopic 10
-Name Accounting Standards Codification
-Section S99
-Paragraph 1
-Subparagraph (SX 210.5-02(29))
-Publisher FASB
-URI https://asc.fasb.org//1943274/2147480566/210-10-S99-1
| Name: |
us-gaap_CommonStockSharesIssued |
| Namespace Prefix: |
us-gaap_ |
| Data Type: |
xbrli:sharesItemType |
| Balance Type: |
na |
| Period Type: |
instant |
|
| X |
- DefinitionA description of the principal activities of an investee accounted for under the equity method.
| Name: |
us-gaap_EquityMethodInvestmentDescriptionOfPrincipalActivities |
| Namespace Prefix: |
us-gaap_ |
| Data Type: |
xbrli:stringItemType |
| Balance Type: |
na |
| Period Type: |
duration |
|
| X |
- Details
| Name: |
srt_ScheduleOfEquityMethodInvestmentEquityMethodInvesteeNameAxis=ASFH_AsiaFINHoldingsCorpLabuanMember |
| Namespace Prefix: |
|
| Data Type: |
na |
| Balance Type: |
|
| Period Type: |
|
|
| X |
- Details
| Name: |
srt_ScheduleOfEquityMethodInvestmentEquityMethodInvesteeNameAxis=ASFH_AsiaFINHoldingsLimitedHongKongMember |
| Namespace Prefix: |
|
| Data Type: |
na |
| Balance Type: |
|
| Period Type: |
|
|
| X |
- Details
| Name: |
srt_ScheduleOfEquityMethodInvestmentEquityMethodInvesteeNameAxis=ASFH_StarFINHoldingsLimitedMember |
| Namespace Prefix: |
|
| Data Type: |
na |
| Balance Type: |
|
| Period Type: |
|
|
| X |
- Details
| Name: |
srt_ScheduleOfEquityMethodInvestmentEquityMethodInvesteeNameAxis=ASFH_StarFINAsiaSdnBhdMember |
| Namespace Prefix: |
|
| Data Type: |
na |
| Balance Type: |
|
| Period Type: |
|
|
| X |
- Details
| Name: |
srt_ScheduleOfEquityMethodInvestmentEquityMethodInvesteeNameAxis=ASFH_InsiteMYComSdnBhdMember |
| Namespace Prefix: |
|
| Data Type: |
na |
| Balance Type: |
|
| Period Type: |
|
|
| X |
- Details
| Name: |
srt_ScheduleOfEquityMethodInvestmentEquityMethodInvesteeNameAxis=ASFH_InsiteMYSystemsSdnBhdMember |
| Namespace Prefix: |
|
| Data Type: |
na |
| Balance Type: |
|
| Period Type: |
|
|
| X |
- Details
| Name: |
srt_ScheduleOfEquityMethodInvestmentEquityMethodInvesteeNameAxis=ASFH_InsiteMYInnovationsSdnBhdMember |
| Namespace Prefix: |
|
| Data Type: |
na |
| Balance Type: |
|
| Period Type: |
|
|
| X |
- Details
| Name: |
srt_ScheduleOfEquityMethodInvestmentEquityMethodInvesteeNameAxis=ASFH_OrangeFINAsiaSdnBhdMember |
| Namespace Prefix: |
|
| Data Type: |
na |
| Balance Type: |
|
| Period Type: |
|
|
| X |
- Details
| Name: |
srt_ScheduleOfEquityMethodInvestmentEquityMethodInvesteeNameAxis=ASFH_TellUSReportSdnBhdMember |
| Namespace Prefix: |
|
| Data Type: |
na |
| Balance Type: |
|
| Period Type: |
|
|
| X |
- Details
| Name: |
srt_ScheduleOfEquityMethodInvestmentEquityMethodInvesteeNameAxis=ASFH_MurniStarFINSdnBhdMember |
| Namespace Prefix: |
|
| Data Type: |
na |
| Balance Type: |
|
| Period Type: |
|
|
v3.23.3
SCHEDULE OF PLANT AND EQUIPMENT DEPRECIATION PERIODS (Details)
|
Sep. 30, 2023 |
| Renovation [Member] |
|
| Property, Plant and Equipment [Line Items] |
|
| Property, Plant, and Equipment, Useful Life, Term, Description [Extensible Enumeration] |
Useful Life, Lease Term [Member]
|
| Computer Equipment [Member] | Minimum [Member] |
|
| Property, Plant and Equipment [Line Items] |
|
| Property, Plant and Equipment, Useful Life |
4 years
|
| Computer Equipment [Member] | Maximum [Member] |
|
| Property, Plant and Equipment [Line Items] |
|
| Property, Plant and Equipment, Useful Life |
5 years
|
| Furniture and Fixtures [Member] |
|
| Property, Plant and Equipment [Line Items] |
|
| Property, Plant and Equipment, Useful Life |
10 years
|
| Electrical Fittings [Member] |
|
| Property, Plant and Equipment [Line Items] |
|
| Property, Plant and Equipment, Useful Life |
10 years
|
| Handphone [Member] |
|
| Property, Plant and Equipment [Line Items] |
|
| Property, Plant and Equipment, Useful Life |
5 years
|
| Office Equipment [Member] |
|
| Property, Plant and Equipment [Line Items] |
|
| Property, Plant and Equipment, Useful Life |
10 years
|
| Motor Vehical [Member] |
|
| Property, Plant and Equipment [Line Items] |
|
| Property, Plant and Equipment, Useful Life |
5 years
|
| Property [Member] |
|
| Property, Plant and Equipment [Line Items] |
|
| Property, Plant and Equipment, Useful Life |
50 years
|
| X |
- DefinitionLine items represent financial concepts included in a table. These concepts are used to disclose reportable information associated with domain members defined in one or many axes to the table.
| Name: |
us-gaap_PropertyPlantAndEquipmentLineItems |
| Namespace Prefix: |
us-gaap_ |
| Data Type: |
xbrli:stringItemType |
| Balance Type: |
na |
| Period Type: |
duration |
|
| X |
- DefinitionUseful life of long lived, physical assets used in the normal conduct of business and not intended for resale, in 'PnYnMnDTnHnMnS' format, for example, 'P1Y5M13D' represents the reported fact of one year, five months, and thirteen days. Examples include, but not limited to, land, buildings, machinery and equipment, office equipment, furniture and fixtures, and computer equipment.
| Name: |
us-gaap_PropertyPlantAndEquipmentUsefulLife |
| Namespace Prefix: |
us-gaap_ |
| Data Type: |
xbrli:durationItemType |
| Balance Type: |
na |
| Period Type: |
instant |
|
| X |
- DefinitionIndicates description of term of useful life for property, plant, and equipment when not stated as numeric value. Reference 1: http://www.xbrl.org/2009/role/commonPracticeRef
-Topic 360
-SubTopic 10
-Name Accounting Standards Codification
-Section 35
-Paragraph 3
-Publisher FASB
-URI https://asc.fasb.org//1943274/2147482190/360-10-35-3
| Name: |
us-gaap_PropertyPlantAndEquipmentUsefulLifeDescriptionOfTermExtensibleEnumeration |
| Namespace Prefix: |
us-gaap_ |
| Data Type: |
enum2:enumerationSetItemType |
| Balance Type: |
na |
| Period Type: |
instant |
|
| X |
- Details
| Name: |
us-gaap_PropertyPlantAndEquipmentByTypeAxis=ASFH_RenovationMember |
| Namespace Prefix: |
|
| Data Type: |
na |
| Balance Type: |
|
| Period Type: |
|
|
| X |
- Details
| Name: |
us-gaap_PropertyPlantAndEquipmentByTypeAxis=us-gaap_ComputerEquipmentMember |
| Namespace Prefix: |
|
| Data Type: |
na |
| Balance Type: |
|
| Period Type: |
|
|
| X |
- Details
| Name: |
srt_RangeAxis=srt_MinimumMember |
| Namespace Prefix: |
|
| Data Type: |
na |
| Balance Type: |
|
| Period Type: |
|
|
| X |
- Details
| Name: |
srt_RangeAxis=srt_MaximumMember |
| Namespace Prefix: |
|
| Data Type: |
na |
| Balance Type: |
|
| Period Type: |
|
|
| X |
- Details
| Name: |
us-gaap_PropertyPlantAndEquipmentByTypeAxis=us-gaap_FurnitureAndFixturesMember |
| Namespace Prefix: |
|
| Data Type: |
na |
| Balance Type: |
|
| Period Type: |
|
|
| X |
- Details
| Name: |
us-gaap_PropertyPlantAndEquipmentByTypeAxis=ASFH_ElectricalFittingsMember |
| Namespace Prefix: |
|
| Data Type: |
na |
| Balance Type: |
|
| Period Type: |
|
|
| X |
- Details
| Name: |
us-gaap_PropertyPlantAndEquipmentByTypeAxis=ASFH_HandphoneMember |
| Namespace Prefix: |
|
| Data Type: |
na |
| Balance Type: |
|
| Period Type: |
|
|
| X |
- Details
| Name: |
us-gaap_PropertyPlantAndEquipmentByTypeAxis=us-gaap_OfficeEquipmentMember |
| Namespace Prefix: |
|
| Data Type: |
na |
| Balance Type: |
|
| Period Type: |
|
|
| X |
- Details
| Name: |
us-gaap_PropertyPlantAndEquipmentByTypeAxis=ASFH_MotorVehicalMember |
| Namespace Prefix: |
|
| Data Type: |
na |
| Balance Type: |
|
| Period Type: |
|
|
| X |
- Details
| Name: |
us-gaap_PropertyPlantAndEquipmentByTypeAxis=ASFH_PropertyMember |
| Namespace Prefix: |
|
| Data Type: |
na |
| Balance Type: |
|
| Period Type: |
|
|
v3.23.3
| X |
- DefinitionForeign exchange rate used to translate amounts denominated in functional currency to reporting currency. Reference 1: http://www.xbrl.org/2003/role/disclosureRef
-Topic 830
-SubTopic 30
-Name Accounting Standards Codification
-Section 50
-Paragraph 2
-Publisher FASB
-URI https://asc.fasb.org//1943274/2147481674/830-30-50-2
Reference 2: http://www.xbrl.org/2003/role/disclosureRef
-Topic 830
-SubTopic 30
-Name Accounting Standards Codification
-Section S99
-Paragraph 1
-Publisher FASB
-URI https://asc.fasb.org//1943274/2147479424/830-30-S99-1
| Name: |
us-gaap_ForeignCurrencyExchangeRateTranslation1 |
| Namespace Prefix: |
us-gaap_ |
| Data Type: |
xbrli:pureItemType |
| Balance Type: |
na |
| Period Type: |
instant |
|
| X |
- Details
| Name: |
srt_StatementScenarioAxis=ASFH_PeriodEndMYRUSexchangeRateMember |
| Namespace Prefix: |
|
| Data Type: |
na |
| Balance Type: |
|
| Period Type: |
|
|
| X |
- Details
| Name: |
srt_StatementScenarioAxis=ASFH_PeriodAverageMYRUSexchangeRateMember |
| Namespace Prefix: |
|
| Data Type: |
na |
| Balance Type: |
|
| Period Type: |
|
|
| X |
- Details
| Name: |
srt_StatementScenarioAxis=ASFH_PeriodEndHKUSexchangeRateMember |
| Namespace Prefix: |
|
| Data Type: |
na |
| Balance Type: |
|
| Period Type: |
|
|
| X |
- Details
| Name: |
srt_StatementScenarioAxis=ASFH_PeriodAverageHKUSexchangeRateMember |
| Namespace Prefix: |
|
| Data Type: |
na |
| Balance Type: |
|
| Period Type: |
|
|
v3.23.3
SUMMARY OF SIGNIFICANT ACCOUNTING POLICIES (Details Narrative)
|
3 Months Ended |
9 Months Ended |
|
|
Sep. 30, 2023
USD ($)
|
Sep. 30, 2022
USD ($)
|
Sep. 30, 2023
USD ($)
|
Sep. 30, 2022
USD ($)
|
Sep. 30, 2023
MYR (RM)
|
| Accounting Policies [Abstract] |
|
|
|
|
|
| Deposits |
$ 53,191
|
|
$ 53,191
|
|
RM 250,000
|
| Net loss |
$ 74,394
|
$ 10,879
|
418,304
|
$ 55,552
|
|
| Net loss |
|
|
$ 282,345
|
$ 63,807
|
|
| X |
- References
+ Details
| Name: |
us-gaap_AccountingPoliciesAbstract |
| Namespace Prefix: |
us-gaap_ |
| Data Type: |
xbrli:stringItemType |
| Balance Type: |
na |
| Period Type: |
duration |
|
| X |
- DefinitionThe aggregate of all deposit liabilities held by the entity, including foreign and domestic, interest and noninterest bearing; may include demand deposits, saving deposits, Negotiable Order of Withdrawal (NOW) and time deposits among others. Reference 1: http://fasb.org/us-gaap/role/ref/legacyRef
-Name Accounting Standards Codification
-Topic 942
-SubTopic 210
-Section S99
-Paragraph 1
-Subparagraph (SX 210.9-03.12)
-Publisher FASB
-URI https://asc.fasb.org//1943274/2147479853/942-210-S99-1
| Name: |
us-gaap_Deposits |
| Namespace Prefix: |
us-gaap_ |
| Data Type: |
xbrli:monetaryItemType |
| Balance Type: |
credit |
| Period Type: |
instant |
|
| X |
- DefinitionAmount of cash inflow (outflow) from operating activities, including discontinued operations. Operating activity cash flows include transactions, adjustments, and changes in value not defined as investing or financing activities. Reference 1: http://fasb.org/us-gaap/role/ref/legacyRef
-Topic 230
-SubTopic 10
-Name Accounting Standards Codification
-Section 45
-Paragraph 28
-Publisher FASB
-URI https://asc.fasb.org//1943274/2147482740/230-10-45-28
Reference 2: http://fasb.org/us-gaap/role/ref/legacyRef
-Topic 230
-SubTopic 10
-Name Accounting Standards Codification
-Section 45
-Paragraph 24
-Publisher FASB
-URI https://asc.fasb.org//1943274/2147482740/230-10-45-24
Reference 3: http://fasb.org/us-gaap/role/ref/legacyRef
-Topic 230
-SubTopic 10
-Name Accounting Standards Codification
-Section 45
-Paragraph 25
-Publisher FASB
-URI https://asc.fasb.org//1943274/2147482740/230-10-45-25
| Name: |
us-gaap_NetCashProvidedByUsedInOperatingActivities |
| Namespace Prefix: |
us-gaap_ |
| Data Type: |
xbrli:monetaryItemType |
| Balance Type: |
na |
| Period Type: |
duration |
|
| X |
- DefinitionThe portion of profit or loss for the period, net of income taxes, which is attributable to the parent. Reference 1: http://www.xbrl.org/2003/role/disclosureRef
-Topic 235
-SubTopic 10
-Name Accounting Standards Codification
-Section S99
-Paragraph 1
-Subparagraph (SX 210.4-08(g)(1)(ii))
-Publisher FASB
-URI https://asc.fasb.org//1943274/2147480678/235-10-S99-1
Reference 2: http://www.xbrl.org/2003/role/disclosureRef
-Topic 323
-SubTopic 10
-Name Accounting Standards Codification
-Section 50
-Paragraph 3
-Subparagraph (c)
-Publisher FASB
-URI https://asc.fasb.org//1943274/2147481687/323-10-50-3
Reference 3: http://www.xbrl.org/2003/role/disclosureRef
-Topic 825
-SubTopic 10
-Name Accounting Standards Codification
-Section 50
-Paragraph 28
-Subparagraph (f)
-Publisher FASB
-URI https://asc.fasb.org//1943274/2147482907/825-10-50-28
Reference 4: http://www.xbrl.org/2003/role/disclosureRef
-Topic 220
-SubTopic 10
-Name Accounting Standards Codification
-Section 50
-Paragraph 6
-Publisher FASB
-URI https://asc.fasb.org//1943274/2147482765/220-10-50-6
Reference 5: http://www.xbrl.org/2003/role/disclosureRef
-Topic 250
-SubTopic 10
-Name Accounting Standards Codification
-Section 50
-Paragraph 3
-Publisher FASB
-URI https://asc.fasb.org//1943274/2147483443/250-10-50-3
Reference 6: http://www.xbrl.org/2003/role/disclosureRef
-Topic 250
-SubTopic 10
-Name Accounting Standards Codification
-Section 50
-Paragraph 1
-Subparagraph (b)(2)
-Publisher FASB
-URI https://asc.fasb.org//1943274/2147483443/250-10-50-1
Reference 7: http://www.xbrl.org/2003/role/disclosureRef
-Topic 815
-SubTopic 40
-Name Accounting Standards Codification
-Section 65
-Paragraph 1
-Subparagraph (f)
-Publisher FASB
-URI https://asc.fasb.org//1943274/2147480175/815-40-65-1
Reference 8: http://www.xbrl.org/2003/role/disclosureRef
-Topic 250
-SubTopic 10
-Name Accounting Standards Codification
-Section 50
-Paragraph 8
-Publisher FASB
-URI https://asc.fasb.org//1943274/2147483443/250-10-50-8
Reference 9: http://www.xbrl.org/2003/role/disclosureRef
-Topic 250
-SubTopic 10
-Name Accounting Standards Codification
-Section 50
-Paragraph 9
-Publisher FASB
-URI https://asc.fasb.org//1943274/2147483443/250-10-50-9
Reference 10: http://www.xbrl.org/2003/role/disclosureRef
-Topic 250
-SubTopic 10
-Name Accounting Standards Codification
-Section 50
-Paragraph 11
-Subparagraph (a)
-Publisher FASB
-URI https://asc.fasb.org//1943274/2147483443/250-10-50-11
Reference 11: http://www.xbrl.org/2003/role/disclosureRef
-Topic 250
-SubTopic 10
-Name Accounting Standards Codification
-Section 50
-Paragraph 11
-Subparagraph (b)
-Publisher FASB
-URI https://asc.fasb.org//1943274/2147483443/250-10-50-11
Reference 12: http://www.xbrl.org/2003/role/disclosureRef
-Topic 250
-SubTopic 10
-Name Accounting Standards Codification
-Section 50
-Paragraph 4
-Publisher FASB
-URI https://asc.fasb.org//1943274/2147483443/250-10-50-4
Reference 13: http://www.xbrl.org/2003/role/exampleRef
-Topic 946
-SubTopic 830
-Name Accounting Standards Codification
-Section 55
-Paragraph 10
-Publisher FASB
-URI https://asc.fasb.org//1943274/2147480167/946-830-55-10
Reference 14: http://www.xbrl.org/2003/role/disclosureRef
-Topic 946
-SubTopic 220
-Name Accounting Standards Codification
-Section 45
-Paragraph 7
-Publisher FASB
-URI https://asc.fasb.org//1943274/2147483581/946-220-45-7
Reference 15: http://www.xbrl.org/2003/role/disclosureRef
-Topic 944
-SubTopic 220
-Name Accounting Standards Codification
-Section S99
-Paragraph 1
-Subparagraph (SX 210.7-04(18))
-Publisher FASB
-URI https://asc.fasb.org//1943274/2147483586/944-220-S99-1
Reference 16: http://www.xbrl.org/2003/role/disclosureRef
-Topic 280
-SubTopic 10
-Name Accounting Standards Codification
-Section 50
-Paragraph 22
-Publisher FASB
-URI https://asc.fasb.org//1943274/2147482810/280-10-50-22
Reference 17: http://www.xbrl.org/2003/role/disclosureRef
-Topic 946
-SubTopic 220
-Name Accounting Standards Codification
-Section S99
-Paragraph 1
-Subparagraph (SX 210.6-07(9))
-Publisher FASB
-URI https://asc.fasb.org//1943274/2147483575/946-220-S99-1
Reference 18: http://www.xbrl.org/2003/role/disclosureRef
-Topic 946
-SubTopic 220
-Name Accounting Standards Codification
-Section S99
-Paragraph 3
-Subparagraph (SX 210.6-09(1)(d))
-Publisher FASB
-URI https://asc.fasb.org//1943274/2147483575/946-220-S99-3
Reference 19: http://www.xbrl.org/2003/role/disclosureRef
-Topic 470
-SubTopic 10
-Name Accounting Standards Codification
-Section S99
-Paragraph 1A
-Subparagraph (SX 210.13-01(a)(4)(i))
-Publisher FASB
-URI https://asc.fasb.org//1943274/2147480097/470-10-S99-1A
Reference 20: http://www.xbrl.org/2009/role/commonPracticeRef
-Topic 470
-SubTopic 10
-Name Accounting Standards Codification
-Section S99
-Paragraph 1A
-Subparagraph (SX 210.13-01(a)(4)(ii))
-Publisher FASB
-URI https://asc.fasb.org//1943274/2147480097/470-10-S99-1A
Reference 21: http://www.xbrl.org/2003/role/disclosureRef
-Topic 470
-SubTopic 10
-Name Accounting Standards Codification
-Section S99
-Paragraph 1A
-Subparagraph (SX 210.13-01(a)(4)(iii)(A))
-Publisher FASB
-URI https://asc.fasb.org//1943274/2147480097/470-10-S99-1A
Reference 22: http://www.xbrl.org/2003/role/disclosureRef
-Topic 470
-SubTopic 10
-Name Accounting Standards Codification
-Section S99
-Paragraph 1A
-Subparagraph (SX 210.13-01(a)(4)(iv))
-Publisher FASB
-URI https://asc.fasb.org//1943274/2147480097/470-10-S99-1A
Reference 23: http://www.xbrl.org/2003/role/disclosureRef
-Topic 470
-SubTopic 10
-Name Accounting Standards Codification
-Section S99
-Paragraph 1A
-Subparagraph (SX 210.13-01(a)(5))
-Publisher FASB
-URI https://asc.fasb.org//1943274/2147480097/470-10-S99-1A
Reference 24: http://www.xbrl.org/2003/role/disclosureRef
-Topic 470
-SubTopic 10
-Name Accounting Standards Codification
-Section S99
-Paragraph 1B
-Subparagraph (SX 210.13-02(a)(4)(i))
-Publisher FASB
-URI https://asc.fasb.org//1943274/2147480097/470-10-S99-1B
Reference 25: http://www.xbrl.org/2003/role/disclosureRef
-Topic 470
-SubTopic 10
-Name Accounting Standards Codification
-Section S99
-Paragraph 1B
-Subparagraph (SX 210.13-02(a)(4)(iii)(A))
-Publisher FASB
-URI https://asc.fasb.org//1943274/2147480097/470-10-S99-1B
Reference 26: http://www.xbrl.org/2003/role/disclosureRef
-Topic 470
-SubTopic 10
-Name Accounting Standards Codification
-Section S99
-Paragraph 1B
-Subparagraph (SX 210.13-02(a)(4)(iii)(B))
-Publisher FASB
-URI https://asc.fasb.org//1943274/2147480097/470-10-S99-1B
Reference 27: http://www.xbrl.org/2003/role/disclosureRef
-Topic 470
-SubTopic 10
-Name Accounting Standards Codification
-Section S99
-Paragraph 1B
-Subparagraph (SX 210.13-02(a)(4)(iv))
-Publisher FASB
-URI https://asc.fasb.org//1943274/2147480097/470-10-S99-1B
Reference 28: http://www.xbrl.org/2003/role/disclosureRef
-Topic 470
-SubTopic 10
-Name Accounting Standards Codification
-Section S99
-Paragraph 1B
-Subparagraph (SX 210.13-02(a)(5))
-Publisher FASB
-URI https://asc.fasb.org//1943274/2147480097/470-10-S99-1B
Reference 29: http://www.xbrl.org/2003/role/disclosureRef
-Topic 280
-SubTopic 10
-Name Accounting Standards Codification
-Section 50
-Paragraph 30
-Subparagraph (b)
-Publisher FASB
-URI https://asc.fasb.org//1943274/2147482810/280-10-50-30
Reference 30: http://www.xbrl.org/2003/role/disclosureRef
-Topic 280
-SubTopic 10
-Name Accounting Standards Codification
-Section 50
-Paragraph 32
-Subparagraph (f)
-Publisher FASB
-URI https://asc.fasb.org//1943274/2147482810/280-10-50-32
Reference 31: http://www.xbrl.org/2003/role/disclosureRef
-Topic 260
-SubTopic 10
-Name Accounting Standards Codification
-Section 45
-Paragraph 60B
-Subparagraph (a)
-Publisher FASB
-URI https://asc.fasb.org//1943274/2147482689/260-10-45-60B
Reference 32: http://www.xbrl.org/2003/role/exampleRef
-Topic 280
-SubTopic 10
-Name Accounting Standards Codification
-Section 50
-Paragraph 31
-Publisher FASB
-URI https://asc.fasb.org//1943274/2147482810/280-10-50-31
Reference 33: http://www.xbrl.org/2003/role/disclosureRef
-Topic 280
-SubTopic 10
-Name Accounting Standards Codification
-Section 50
-Paragraph 32
-Subparagraph (c)
-Publisher FASB
-URI https://asc.fasb.org//1943274/2147482810/280-10-50-32
Reference 34: http://www.xbrl.org/2003/role/disclosureRef
-Topic 205
-SubTopic 20
-Name Accounting Standards Codification
-Section 50
-Paragraph 7
-Publisher FASB
-URI https://asc.fasb.org//1943274/2147483499/205-20-50-7
Reference 35: http://fasb.org/us-gaap/role/ref/legacyRef
-Topic 230
-SubTopic 10
-Name Accounting Standards Codification
-Section 45
-Paragraph 28
-Publisher FASB
-URI https://asc.fasb.org//1943274/2147482740/230-10-45-28
Reference 36: http://www.xbrl.org/2003/role/disclosureRef
-Topic 220
-SubTopic 10
-Name Accounting Standards Codification
-Section 45
-Paragraph 1A
-Subparagraph (a)
-Publisher FASB
-URI https://asc.fasb.org//1943274/2147482790/220-10-45-1A
Reference 37: http://www.xbrl.org/2003/role/disclosureRef
-Topic 220
-SubTopic 10
-Name Accounting Standards Codification
-Section 45
-Paragraph 1B
-Subparagraph (a)
-Publisher FASB
-URI https://asc.fasb.org//1943274/2147482790/220-10-45-1B
Reference 38: http://fasb.org/us-gaap/role/ref/legacyRef
-Topic 220
-SubTopic 10
-Name Accounting Standards Codification
-Section S99
-Paragraph 2
-Subparagraph (SX 210.5-03(20))
-Publisher FASB
-URI https://asc.fasb.org//1943274/2147483621/220-10-S99-2
Reference 39: http://fasb.org/us-gaap/role/ref/legacyRef
-Topic 942
-SubTopic 220
-Name Accounting Standards Codification
-Section S99
-Paragraph 1
-Subparagraph (SX 210.9-04(22))
-Publisher FASB
-URI https://asc.fasb.org//1943274/2147483589/942-220-S99-1
| Name: |
us-gaap_NetIncomeLoss |
| Namespace Prefix: |
us-gaap_ |
| Data Type: |
xbrli:monetaryItemType |
| Balance Type: |
credit |
| Period Type: |
duration |
|
v3.23.3
SCHEDULE OF PURCHASE PRICE ALLOCATION (Details) - StarFin Holdings [Member]
|
Dec. 22, 2022
USD ($)
|
| Business Acquisition [Line Items] |
|
| Cash and cash equivalents |
$ 705,480
|
| Trade receivables, net |
676,396
|
| Deposits paid, prepayments and other receivables |
202,414
|
| Tax assets |
539,969
|
| Investment in Associates – Murni StarFIN Sdn Bhd |
8,657
|
| Property, plant and equipment, net |
585,816
|
| Trade payable |
(24,736)
|
| Accrued expenses and other payables |
(734,476)
|
| Deferred tax liabilities |
(213,524)
|
| Hire purchase loan |
(16,554)
|
| Amount due to directors |
(283,703)
|
| Amount due to related parties |
(1,673)
|
| Adjustment for foreign exchange fluctuation |
260,052
|
| Fair value of StarFIN Holdings Limited |
1,704,118
|
| Fair value of consideration |
(9,055,242)
|
| Goodwill |
7,351,124
|
| Goodwill impairment |
$ (7,351,124)
|
| X |
- DefinitionBusiness combination recognized identifiable assets acquired and liabilities assumed current liabilities accrued expenses and other payables.
| Name: |
ASFH_BusinessCombinationRecognizedIdentifiableAssetsAcquiredAndLiabilitiesAssumedCurrentLiabilitiesAccruedExpensesAndOtherPayables |
| Namespace Prefix: |
ASFH_ |
| Data Type: |
xbrli:monetaryItemType |
| Balance Type: |
credit |
| Period Type: |
instant |
|
| X |
- DefinitionBusiness combination recognized identifiable assets acquired and liabilities assumed noncurrent liabilities amount due to directors.
| Name: |
ASFH_BusinessCombinationRecognizedIdentifiableAssetsAcquiredAndLiabilitiesAssumedNoncurrentLiabilitiesAmountDueToDirectors |
| Namespace Prefix: |
ASFH_ |
| Data Type: |
xbrli:monetaryItemType |
| Balance Type: |
credit |
| Period Type: |
instant |
|
| X |
- DefinitionAdjustment for foreign exchange fluctuation.
| Name: |
ASFH_BusinessCombinationRecognizedIdentifiableAssetsAcquiredAndLiabilitiesAssumedNoncurrentLiabilitiesForeignExchangeFluctuation |
| Namespace Prefix: |
ASFH_ |
| Data Type: |
xbrli:monetaryItemType |
| Balance Type: |
debit |
| Period Type: |
instant |
|
| X |
- DefinitionLine items represent financial concepts included in a table. These concepts are used to disclose reportable information associated with domain members defined in one or many axes to the table. Reference 1: http://www.xbrl.org/2003/role/disclosureRef
-Topic 805
-SubTopic 20
-Name Accounting Standards Codification
-Section 50
-Paragraph 5
-Subparagraph (a)
-Publisher FASB
-URI https://asc.fasb.org//1943274/2147479907/805-20-50-5
| Name: |
us-gaap_BusinessAcquisitionLineItems |
| Namespace Prefix: |
us-gaap_ |
| Data Type: |
xbrli:stringItemType |
| Balance Type: |
na |
| Period Type: |
duration |
|
| X |
- DefinitionAmount of consideration transferred, consisting of acquisition-date fair value of assets transferred by the acquirer, liabilities incurred by the acquirer, and equity interest issued by the acquirer. Reference 1: http://fasb.org/us-gaap/role/ref/legacyRef
-Name Accounting Standards Codification
-Section 30
-Paragraph 8
-SubTopic 30
-Topic 805
-Publisher FASB
-URI https://asc.fasb.org//1943274/2147479637/805-30-30-8
Reference 2: http://fasb.org/us-gaap/role/ref/legacyRef
-Name Accounting Standards Codification
-Section 50
-Paragraph 1
-Subparagraph (b)
-SubTopic 30
-Topic 805
-Publisher FASB
-URI https://asc.fasb.org//1943274/2147479581/805-30-50-1
Reference 3: http://fasb.org/us-gaap/role/ref/legacyRef
-Name Accounting Standards Codification
-Section 30
-Paragraph 7
-SubTopic 30
-Topic 805
-Publisher FASB
-URI https://asc.fasb.org//1943274/2147479637/805-30-30-7
| Name: |
us-gaap_BusinessCombinationConsiderationTransferred1 |
| Namespace Prefix: |
us-gaap_ |
| Data Type: |
xbrli:monetaryItemType |
| Balance Type: |
credit |
| Period Type: |
duration |
|
| X |
- DefinitionAmount of currency on hand as well as demand deposits with banks or financial institutions, acquired at the acquisition date. Includes other kinds of accounts that have the general characteristics of demand deposits. Also includes short-term, highly liquid investments that are both readily convertible to known amounts of cash and so near their maturity that they present insignificant risk of changes in value because of changes in interest rates. Reference 1: http://fasb.org/us-gaap/role/ref/legacyRef
-Name Accounting Standards Codification
-Topic 805
-SubTopic 20
-Section 50
-Paragraph 1
-Subparagraph (c)
-Publisher FASB
-URI https://asc.fasb.org//1943274/2147479907/805-20-50-1
| Name: |
us-gaap_BusinessCombinationRecognizedIdentifiableAssetsAcquiredAndLiabilitiesAssumedCashAndEquivalents |
| Namespace Prefix: |
us-gaap_ |
| Data Type: |
xbrli:monetaryItemType |
| Balance Type: |
debit |
| Period Type: |
instant |
|
| X |
- DefinitionAmount of investments in debt and equity securities, including, but not limited to, held-to-maturity, trading and available-for-sale expected to be converted to cash, sold or exchanged within one year or the normal operating cycle, if longer, acquired at the acquisition date. Reference 1: http://fasb.org/us-gaap/role/ref/legacyRef
-Name Accounting Standards Codification
-Topic 805
-SubTopic 20
-Section 50
-Paragraph 1
-Subparagraph (c)
-Publisher FASB
-URI https://asc.fasb.org//1943274/2147479907/805-20-50-1
| Name: |
us-gaap_BusinessCombinationRecognizedIdentifiableAssetsAcquiredAndLiabilitiesAssumedCurrentAssetsMarketableSecurities |
| Namespace Prefix: |
us-gaap_ |
| Data Type: |
xbrli:monetaryItemType |
| Balance Type: |
debit |
| Period Type: |
instant |
|
| X |
- DefinitionAmount of asset related to consideration paid in advance for costs that provide economic benefits in future periods, and amount of other assets that are expected to be realized or consumed within one year or the normal operating cycle, if longer, acquired at the acquisition date. Reference 1: http://fasb.org/us-gaap/role/ref/legacyRef
-Name Accounting Standards Codification
-Topic 805
-SubTopic 20
-Section 50
-Paragraph 1
-Subparagraph (c)
-Publisher FASB
-URI https://asc.fasb.org//1943274/2147479907/805-20-50-1
| Name: |
us-gaap_BusinessCombinationRecognizedIdentifiableAssetsAcquiredAndLiabilitiesAssumedCurrentAssetsPrepaidExpenseAndOtherAssets |
| Namespace Prefix: |
us-gaap_ |
| Data Type: |
xbrli:monetaryItemType |
| Balance Type: |
debit |
| Period Type: |
instant |
|
| X |
- DefinitionAmount due from customers or clients for goods or services, including trade receivables, that have been delivered or sold in the normal course of business, and amounts due from others, including related parties expected to be converted to cash, sold or exchanged within one year or the normal operating cycle, if longer, acquired at the acquisition date. Reference 1: http://fasb.org/us-gaap/role/ref/legacyRef
-Name Accounting Standards Codification
-Topic 805
-SubTopic 20
-Section 50
-Paragraph 1
-Subparagraph (c)
-Publisher FASB
-URI https://asc.fasb.org//1943274/2147479907/805-20-50-1
| Name: |
us-gaap_BusinessCombinationRecognizedIdentifiableAssetsAcquiredAndLiabilitiesAssumedCurrentAssetsReceivables |
| Namespace Prefix: |
us-gaap_ |
| Data Type: |
xbrli:monetaryItemType |
| Balance Type: |
debit |
| Period Type: |
instant |
|
| X |
- DefinitionAmount of liabilities incurred for goods and services received that are used in an entity's business and related party payables, assumed at the acquisition date. Reference 1: http://fasb.org/us-gaap/role/ref/legacyRef
-Name Accounting Standards Codification
-Topic 805
-SubTopic 20
-Section 50
-Paragraph 1
-Subparagraph (c)
-Publisher FASB
-URI https://asc.fasb.org//1943274/2147479907/805-20-50-1
| Name: |
us-gaap_BusinessCombinationRecognizedIdentifiableAssetsAcquiredAndLiabilitiesAssumedCurrentLiabilitiesAccountsPayable |
| Namespace Prefix: |
us-gaap_ |
| Data Type: |
xbrli:monetaryItemType |
| Balance Type: |
credit |
| Period Type: |
instant |
|
| X |
- DefinitionAmount of deferred tax asset attributable to deductible temporary differences and carryforwards acquired at the acquisition date. Reference 1: http://fasb.org/us-gaap/role/ref/legacyRef
-Name Accounting Standards Codification
-Topic 805
-SubTopic 20
-Section 50
-Paragraph 1
-Subparagraph (c)
-Publisher FASB
-URI https://asc.fasb.org//1943274/2147479907/805-20-50-1
| Name: |
us-gaap_BusinessCombinationRecognizedIdentifiableAssetsAcquiredAndLiabilitiesAssumedDeferredTaxAssets |
| Namespace Prefix: |
us-gaap_ |
| Data Type: |
xbrli:monetaryItemType |
| Balance Type: |
debit |
| Period Type: |
instant |
|
| X |
- DefinitionAmount of deferred tax liability attributable to taxable temporary differences assumed at the acquisition date. Reference 1: http://fasb.org/us-gaap/role/ref/legacyRef
-Name Accounting Standards Codification
-Topic 805
-SubTopic 20
-Section 50
-Paragraph 1
-Subparagraph (c)
-Publisher FASB
-URI https://asc.fasb.org//1943274/2147479907/805-20-50-1
| Name: |
us-gaap_BusinessCombinationRecognizedIdentifiableAssetsAcquiredAndLiabilitiesAssumedDeferredTaxLiabilities |
| Namespace Prefix: |
us-gaap_ |
| Data Type: |
xbrli:monetaryItemType |
| Balance Type: |
credit |
| Period Type: |
instant |
|
| X |
- DefinitionAmount recognized as of the acquisition date for the identifiable assets acquired in excess of (less than) the aggregate liabilities assumed. Reference 1: http://fasb.org/us-gaap/role/ref/legacyRef
-Name Accounting Standards Codification
-Topic 805
-SubTopic 10
-Section 55
-Paragraph 37
-Publisher FASB
-URI https://asc.fasb.org//1943274/2147479303/805-10-55-37
Reference 2: http://fasb.org/us-gaap/role/ref/legacyRef
-Name Accounting Standards Codification
-Topic 805
-SubTopic 20
-Section 50
-Paragraph 1
-Subparagraph (c)
-Publisher FASB
-URI https://asc.fasb.org//1943274/2147479907/805-20-50-1
| Name: |
us-gaap_BusinessCombinationRecognizedIdentifiableAssetsAcquiredAndLiabilitiesAssumedNet |
| Namespace Prefix: |
us-gaap_ |
| Data Type: |
xbrli:monetaryItemType |
| Balance Type: |
debit |
| Period Type: |
instant |
|
| X |
- DefinitionAmount of long-term debt due after one year or the normal operating cycle, if longer, assumed at the acquisition date. Reference 1: http://fasb.org/us-gaap/role/ref/legacyRef
-Name Accounting Standards Codification
-Topic 805
-SubTopic 20
-Section 50
-Paragraph 1
-Subparagraph (c)
-Publisher FASB
-URI https://asc.fasb.org//1943274/2147479907/805-20-50-1
| Name: |
us-gaap_BusinessCombinationRecognizedIdentifiableAssetsAcquiredAndLiabilitiesAssumedNoncurrentLiabilitiesLongTermDebt |
| Namespace Prefix: |
us-gaap_ |
| Data Type: |
xbrli:monetaryItemType |
| Balance Type: |
credit |
| Period Type: |
instant |
|
| X |
- DefinitionThe amount of property, plant, and equipment recognized as of the acquisition date. Reference 1: http://fasb.org/us-gaap/role/ref/legacyRef
-Name Accounting Standards Codification
-Topic 805
-SubTopic 10
-Section 55
-Paragraph 37
-Publisher FASB
-URI https://asc.fasb.org//1943274/2147479303/805-10-55-37
Reference 2: http://fasb.org/us-gaap/role/ref/legacyRef
-Name Accounting Standards Codification
-Topic 805
-SubTopic 20
-Section 50
-Paragraph 1
-Subparagraph (c)
-Publisher FASB
-URI https://asc.fasb.org//1943274/2147479907/805-20-50-1
| Name: |
us-gaap_BusinessCombinationRecognizedIdentifiableAssetsAcquiredAndLiabilitiesAssumedPropertyPlantAndEquipment |
| Namespace Prefix: |
us-gaap_ |
| Data Type: |
xbrli:monetaryItemType |
| Balance Type: |
debit |
| Period Type: |
instant |
|
| X |
- DefinitionAmount after accumulated impairment loss of an asset representing future economic benefits arising from other assets acquired in a business combination that are not individually identified and separately recognized. Reference 1: http://www.xbrl.org/2003/role/exampleRef
-Topic 852
-SubTopic 10
-Name Accounting Standards Codification
-Section 55
-Paragraph 10
-Publisher FASB
-URI https://asc.fasb.org//1943274/2147481372/852-10-55-10
Reference 2: http://www.xbrl.org/2003/role/exampleRef
-Topic 350
-SubTopic 20
-Name Accounting Standards Codification
-Section 55
-Paragraph 24
-Publisher FASB
-URI https://asc.fasb.org//1943274/2147482548/350-20-55-24
Reference 3: http://www.xbrl.org/2003/role/disclosureRef
-Topic 210
-SubTopic 10
-Name Accounting Standards Codification
-Section S99
-Paragraph 1
-Subparagraph (SX 210.5-02(15))
-Publisher FASB
-URI https://asc.fasb.org//1943274/2147480566/210-10-S99-1
Reference 4: http://www.xbrl.org/2003/role/disclosureRef
-Topic 350
-SubTopic 20
-Name Accounting Standards Codification
-Section 45
-Paragraph 1
-Publisher FASB
-URI https://asc.fasb.org//1943274/2147482598/350-20-45-1
Reference 5: http://www.xbrl.org/2009/role/commonPracticeRef
-Topic 350
-SubTopic 20
-Name Accounting Standards Codification
-Section 50
-Paragraph 1
-Subparagraph (a)
-Publisher FASB
-URI https://asc.fasb.org//1943274/2147482573/350-20-50-1
Reference 6: http://www.xbrl.org/2009/role/commonPracticeRef
-Topic 350
-SubTopic 20
-Name Accounting Standards Codification
-Section 50
-Paragraph 1
-Subparagraph (h)
-Publisher FASB
-URI https://asc.fasb.org//1943274/2147482573/350-20-50-1
Reference 7: http://www.xbrl.org/2003/role/disclosureRef
-Topic 942
-SubTopic 210
-Name Accounting Standards Codification
-Section S99
-Paragraph 1
-Subparagraph (SX 210.9-03(10)(1))
-Publisher FASB
-URI https://asc.fasb.org//1943274/2147479853/942-210-S99-1
| Name: |
us-gaap_Goodwill |
| Namespace Prefix: |
us-gaap_ |
| Data Type: |
xbrli:monetaryItemType |
| Balance Type: |
debit |
| Period Type: |
instant |
|
| X |
- DefinitionAmount of loss from the write-down of an asset representing the future economic benefits arising from other assets acquired in a business combination that are not individually identified and separately recognized. Reference 1: http://fasb.org/us-gaap/role/ref/legacyRef
-Name Accounting Standards Codification
-Section 45
-Paragraph 28
-Subparagraph (b)
-SubTopic 10
-Topic 230
-Publisher FASB
-URI https://asc.fasb.org//1943274/2147482740/230-10-45-28
Reference 2: http://www.xbrl.org/2003/role/exampleRef
-Topic 350
-SubTopic 20
-Name Accounting Standards Codification
-Section 55
-Paragraph 24
-Publisher FASB
-URI https://asc.fasb.org//1943274/2147482548/350-20-55-24
Reference 3: http://www.xbrl.org/2003/role/disclosureRef
-Topic 350
-SubTopic 20
-Name Accounting Standards Codification
-Section 50
-Paragraph 1
-Subparagraph (e)
-Publisher FASB
-URI https://asc.fasb.org//1943274/2147482573/350-20-50-1
Reference 4: http://www.xbrl.org/2003/role/disclosureRef
-Topic 350
-SubTopic 20
-Name Accounting Standards Codification
-Section 50
-Paragraph 2
-Subparagraph (b)
-Publisher FASB
-URI https://asc.fasb.org//1943274/2147482573/350-20-50-2
Reference 5: http://www.xbrl.org/2003/role/disclosureRef
-Topic 350
-SubTopic 20
-Name Accounting Standards Codification
-Section 45
-Paragraph 2
-Publisher FASB
-URI https://asc.fasb.org//1943274/2147482598/350-20-45-2
| Name: |
us-gaap_GoodwillImpairmentLoss |
| Namespace Prefix: |
us-gaap_ |
| Data Type: |
xbrli:monetaryItemType |
| Balance Type: |
debit |
| Period Type: |
duration |
|
| X |
- Details
| Name: |
us-gaap_BusinessAcquisitionAxis=ASFH_StarFinHoldingsMember |
| Namespace Prefix: |
|
| Data Type: |
na |
| Balance Type: |
|
| Period Type: |
|
|
v3.23.3
| X |
- DefinitionNumber of shares of equity interests issued or issuable to acquire entity. Reference 1: http://fasb.org/us-gaap/role/ref/legacyRef
-Topic 805
-SubTopic 30
-Name Accounting Standards Codification
-Section 50
-Paragraph 1
-Subparagraph (b)(4)
-Publisher FASB
-URI https://asc.fasb.org//1943274/2147479581/805-30-50-1
| Name: |
us-gaap_BusinessAcquisitionEquityInterestsIssuedOrIssuableNumberOfSharesIssued |
| Namespace Prefix: |
us-gaap_ |
| Data Type: |
xbrli:sharesItemType |
| Balance Type: |
na |
| Period Type: |
duration |
|
| X |
- DefinitionLine items represent financial concepts included in a table. These concepts are used to disclose reportable information associated with domain members defined in one or many axes to the table. Reference 1: http://www.xbrl.org/2003/role/disclosureRef
-Topic 805
-SubTopic 20
-Name Accounting Standards Codification
-Section 50
-Paragraph 5
-Subparagraph (a)
-Publisher FASB
-URI https://asc.fasb.org//1943274/2147479907/805-20-50-5
| Name: |
us-gaap_BusinessAcquisitionLineItems |
| Namespace Prefix: |
us-gaap_ |
| Data Type: |
xbrli:stringItemType |
| Balance Type: |
na |
| Period Type: |
duration |
|
| X |
- DefinitionPercentage of voting equity interests acquired at the acquisition date in the business combination. Reference 1: http://fasb.org/us-gaap/role/ref/legacyRef
-Name Accounting Standards Codification
-Topic 805
-SubTopic 10
-Section 50
-Paragraph 2
-Subparagraph (c)
-Publisher FASB
-URI https://asc.fasb.org//1943274/2147479328/805-10-50-2
| Name: |
us-gaap_BusinessAcquisitionPercentageOfVotingInterestsAcquired |
| Namespace Prefix: |
us-gaap_ |
| Data Type: |
dtr-types:percentItemType |
| Balance Type: |
na |
| Period Type: |
instant |
|
| X |
- DefinitionAmount of equity interests of the acquirer, including instruments or interests issued or issuable in consideration for the business combination. Reference 1: http://fasb.org/us-gaap/role/ref/legacyRef
-Name Accounting Standards Codification
-Section 30
-Paragraph 8
-SubTopic 30
-Topic 805
-Publisher FASB
-URI https://asc.fasb.org//1943274/2147479637/805-30-30-8
Reference 2: http://fasb.org/us-gaap/role/ref/legacyRef
-Name Accounting Standards Codification
-Section 30
-Paragraph 7
-SubTopic 30
-Topic 805
-Publisher FASB
-URI https://asc.fasb.org//1943274/2147479637/805-30-30-7
| Name: |
us-gaap_BusinessCombinationConsiderationTransferredEquityInterestsIssuedAndIssuable |
| Namespace Prefix: |
us-gaap_ |
| Data Type: |
xbrli:monetaryItemType |
| Balance Type: |
credit |
| Period Type: |
duration |
|
| X |
- Details
| Name: |
us-gaap_BusinessAcquisitionAxis=ASFH_StarFinHoldingsMember |
| Namespace Prefix: |
|
| Data Type: |
na |
| Balance Type: |
|
| Period Type: |
|
|
v3.23.3
SCHEDULE OF TRADE RECEIVABLE (Details) - USD ($)
|
Sep. 30, 2023 |
Dec. 31, 2022 |
Sep. 30, 2022 |
| Accounts, Notes, Loans and Financing Receivable [Line Items] |
|
|
|
| Trade receivable, gross |
$ 612,461
|
|
|
| Trade receivable, net |
530,241
|
|
|
| Trade Accounts Receivable [Member] |
|
|
|
| Accounts, Notes, Loans and Financing Receivable [Line Items] |
|
|
|
| Trade receivable, gross |
612,461
|
|
|
| Allowance for expected credit loss |
(82,220)
|
|
|
| Trade receivable, net |
$ 530,241
|
|
|
| X |
- DefinitionLine items represent financial concepts included in a table. These concepts are used to disclose reportable information associated with domain members defined in one or many axes to the table.
| Name: |
us-gaap_AccountsNotesAndLoansReceivableLineItems |
| Namespace Prefix: |
us-gaap_ |
| Data Type: |
xbrli:stringItemType |
| Balance Type: |
na |
| Period Type: |
duration |
|
| X |
- DefinitionAmount, before allowance for credit loss, of right to consideration from customer for product sold and service rendered in normal course of business, classified as current. Reference 1: http://www.xbrl.org/2003/role/disclosureRef
-Topic 210
-SubTopic 10
-Name Accounting Standards Codification
-Section S99
-Paragraph 1
-Subparagraph (SX 210.5-02(3)(a)(1))
-Publisher FASB
-URI https://asc.fasb.org//1943274/2147480566/210-10-S99-1
Reference 2: http://www.xbrl.org/2003/role/exampleRef
-Topic 210
-SubTopic 10
-Name Accounting Standards Codification
-Section 45
-Paragraph 1
-Subparagraph (c)
-Publisher FASB
-URI https://asc.fasb.org//1943274/2147483467/210-10-45-1
Reference 3: http://www.xbrl.org/2003/role/disclosureRef
-Topic 310
-SubTopic 10
-Name Accounting Standards Codification
-Section 45
-Paragraph 2
-Publisher FASB
-URI https://asc.fasb.org//1943274/2147481990/310-10-45-2
Reference 4: http://www.xbrl.org/2003/role/disclosureRef
-Topic 310
-SubTopic 10
-Name Accounting Standards Codification
-Section 45
-Paragraph 9
-Publisher FASB
-URI https://asc.fasb.org//1943274/2147481990/310-10-45-9
| Name: |
us-gaap_AccountsReceivableGrossCurrent |
| Namespace Prefix: |
us-gaap_ |
| Data Type: |
xbrli:monetaryItemType |
| Balance Type: |
debit |
| Period Type: |
instant |
|
| X |
- DefinitionAmount, after allowance for credit loss, of right to consideration from customer for product sold and service rendered in normal course of business, classified as current. Reference 1: http://www.xbrl.org/2003/role/disclosureRef
-Topic 310
-SubTopic 10
-Name Accounting Standards Codification
-Section 45
-Paragraph 2
-Publisher FASB
-URI https://asc.fasb.org//1943274/2147481990/310-10-45-2
Reference 2: http://www.xbrl.org/2003/role/disclosureRef
-Topic 310
-SubTopic 10
-Name Accounting Standards Codification
-Section 45
-Paragraph 9
-Publisher FASB
-URI https://asc.fasb.org//1943274/2147481990/310-10-45-9
| Name: |
us-gaap_AccountsReceivableNetCurrent |
| Namespace Prefix: |
us-gaap_ |
| Data Type: |
xbrli:monetaryItemType |
| Balance Type: |
debit |
| Period Type: |
instant |
|
| X |
- DefinitionAmount of allowance for credit loss on accounts receivable, classified as current. Reference 1: http://www.xbrl.org/2003/role/disclosureRef
-Topic 210
-SubTopic 10
-Name Accounting Standards Codification
-Section S99
-Paragraph 1
-Subparagraph (SX 210.5-02(4))
-Publisher FASB
-URI https://asc.fasb.org//1943274/2147480566/210-10-S99-1
Reference 2: http://www.xbrl.org/2003/role/disclosureRef
-Topic 326
-SubTopic 20
-Name Accounting Standards Codification
-Section 45
-Paragraph 1
-Publisher FASB
-URI https://asc.fasb.org//1943274/2147479344/326-20-45-1
Reference 3: http://www.xbrl.org/2003/role/disclosureRef
-Topic 310
-SubTopic 10
-Name Accounting Standards Codification
-Section 50
-Paragraph 4
-Publisher FASB
-URI https://asc.fasb.org//1943274/2147481962/310-10-50-4
| Name: |
us-gaap_AllowanceForDoubtfulAccountsReceivableCurrent |
| Namespace Prefix: |
us-gaap_ |
| Data Type: |
xbrli:monetaryItemType |
| Balance Type: |
credit |
| Period Type: |
instant |
|
| X |
- Details
| Name: |
us-gaap_AccountsNotesLoansAndFinancingReceivableByReceivableTypeAxis=us-gaap_TradeAccountsReceivableMember |
| Namespace Prefix: |
|
| Data Type: |
na |
| Balance Type: |
|
| Period Type: |
|
|
v3.23.3
| X |
- References
+ Details
| Name: |
ASFH_DisclosurePrepaymentDepositsAndOtherReceivablesAbstract |
| Namespace Prefix: |
ASFH_ |
| Data Type: |
xbrli:stringItemType |
| Balance Type: |
na |
| Period Type: |
duration |
|
| X |
- DefinitionAmount due from parties in nontrade transactions, classified as other. Reference 1: http://www.xbrl.org/2003/role/disclosureRef
-Topic 946
-SubTopic 210
-Name Accounting Standards Codification
-Section S99
-Paragraph 1
-Subparagraph (SX 210.6-04(5)(a)(5))
-Publisher FASB
-URI https://asc.fasb.org//1943274/2147479617/946-210-S99-1
Reference 2: http://www.xbrl.org/2003/role/disclosureRef
-Topic 210
-SubTopic 10
-Name Accounting Standards Codification
-Section S99
-Paragraph 1
-Subparagraph (SX 210.5-02(3)(a)(4))
-Publisher FASB
-URI https://asc.fasb.org//1943274/2147480566/210-10-S99-1
| Name: |
us-gaap_OtherReceivables |
| Namespace Prefix: |
us-gaap_ |
| Data Type: |
xbrli:monetaryItemType |
| Balance Type: |
debit |
| Period Type: |
instant |
|
| X |
- DefinitionAmount of asset related to consideration paid in advance for costs that provide economic benefits within a future period of one year or the normal operating cycle, if longer. Reference 1: http://www.xbrl.org/2003/role/exampleRef
-Topic 210
-SubTopic 10
-Name Accounting Standards Codification
-Section 45
-Paragraph 1
-Subparagraph (g)
-Publisher FASB
-URI https://asc.fasb.org//1943274/2147483467/210-10-45-1
Reference 2: http://www.xbrl.org/2003/role/disclosureRef
-Topic 210
-SubTopic 10
-Name Accounting Standards Codification
-Section S99
-Paragraph 1
-Subparagraph (SX 210.5-02(7))
-Publisher FASB
-URI https://asc.fasb.org//1943274/2147480566/210-10-S99-1
Reference 3: http://www.xbrl.org/2003/role/disclosureRef
-Topic 340
-SubTopic 10
-Name Accounting Standards Codification
-Section 05
-Paragraph 5
-Publisher FASB
-URI https://asc.fasb.org//1943274/2147482955/340-10-05-5
Reference 4: http://www.xbrl.org/2003/role/disclosureRef
-Topic 340
-SubTopic 10
-Name Accounting Standards Codification
-Section 45
-Paragraph 1
-Publisher FASB
-URI https://asc.fasb.org//1943274/2147483032/340-10-45-1
| Name: |
us-gaap_PrepaidExpenseCurrent |
| Namespace Prefix: |
us-gaap_ |
| Data Type: |
xbrli:monetaryItemType |
| Balance Type: |
debit |
| Period Type: |
instant |
|
v3.23.3
SCHEDULE OF PLANT AND EQUIPMENT (Details) - USD ($)
|
Sep. 30, 2023 |
Dec. 31, 2022 |
| Property, Plant and Equipment [Line Items] |
|
|
| Total property, plant and equipment |
$ 1,312,371
|
|
| Less: Accumulated depreciation |
(792,408)
|
|
| Total property, plant and equipment, net |
519,963
|
|
| Computer Equipment [Member] |
|
|
| Property, Plant and Equipment [Line Items] |
|
|
| Total property, plant and equipment |
253,420
|
|
| Furniture and Fixtures [Member] |
|
|
| Property, Plant and Equipment [Line Items] |
|
|
| Total property, plant and equipment |
78,128
|
|
| Electric Transmission [Member] |
|
|
| Property, Plant and Equipment [Line Items] |
|
|
| Total property, plant and equipment |
9,587
|
|
| Handphone [Member] |
|
|
| Property, Plant and Equipment [Line Items] |
|
|
| Total property, plant and equipment |
48,358
|
|
| Office Equipment [Member] |
|
|
| Property, Plant and Equipment [Line Items] |
|
|
| Total property, plant and equipment |
91,146
|
|
| Renovation [Member] |
|
|
| Property, Plant and Equipment [Line Items] |
|
|
| Total property, plant and equipment |
81,221
|
|
| Motor Vehical [Member] |
|
|
| Property, Plant and Equipment [Line Items] |
|
|
| Total property, plant and equipment |
356,492
|
|
| Property [Member] |
|
|
| Property, Plant and Equipment [Line Items] |
|
|
| Total property, plant and equipment |
$ 394,019
|
|
| X |
- DefinitionAmount of accumulated depreciation, depletion and amortization for physical assets used in the normal conduct of business to produce goods and services. Reference 1: http://www.xbrl.org/2003/role/disclosureRef
-Topic 944
-SubTopic 210
-Name Accounting Standards Codification
-Section S99
-Paragraph 1
-Subparagraph (SX 210.7-03(a)(8)(b))
-Publisher FASB
-URI https://asc.fasb.org//1943274/2147479440/944-210-S99-1
Reference 2: http://www.xbrl.org/2003/role/disclosureRef
-Topic 210
-SubTopic 10
-Name Accounting Standards Codification
-Section S99
-Paragraph 1
-Subparagraph (SX 210.5-02(14))
-Publisher FASB
-URI https://asc.fasb.org//1943274/2147480566/210-10-S99-1
Reference 3: http://fasb.org/us-gaap/role/ref/legacyRef
-Name Accounting Standards Codification
-Topic 360
-SubTopic 10
-Section 50
-Paragraph 1
-Subparagraph (c)
-Publisher FASB
-URI https://asc.fasb.org//1943274/2147482099/360-10-50-1
| Name: |
us-gaap_AccumulatedDepreciationDepletionAndAmortizationPropertyPlantAndEquipment |
| Namespace Prefix: |
us-gaap_ |
| Data Type: |
xbrli:monetaryItemType |
| Balance Type: |
credit |
| Period Type: |
instant |
|
| X |
- DefinitionAmount before accumulated depreciation, depletion and amortization of physical assets used in the normal conduct of business and not intended for resale. Examples include, but are not limited to, land, buildings, machinery and equipment, office equipment, and furniture and fixtures. Reference 1: http://www.xbrl.org/2003/role/disclosureRef
-Topic 944
-SubTopic 210
-Name Accounting Standards Codification
-Section S99
-Paragraph 1
-Subparagraph (SX 210.7-03(a)(8))
-Publisher FASB
-URI https://asc.fasb.org//1943274/2147479440/944-210-S99-1
Reference 2: http://www.xbrl.org/2003/role/disclosureRef
-Topic 210
-SubTopic 10
-Name Accounting Standards Codification
-Section S99
-Paragraph 1
-Subparagraph (SX 210.5-02(13))
-Publisher FASB
-URI https://asc.fasb.org//1943274/2147480566/210-10-S99-1
Reference 3: http://fasb.org/us-gaap/role/ref/legacyRef
-Topic 360
-SubTopic 10
-Name Accounting Standards Codification
-Section 50
-Paragraph 1
-Subparagraph (b)
-Publisher FASB
-URI https://asc.fasb.org//1943274/2147482099/360-10-50-1
| Name: |
us-gaap_PropertyPlantAndEquipmentGross |
| Namespace Prefix: |
us-gaap_ |
| Data Type: |
xbrli:monetaryItemType |
| Balance Type: |
debit |
| Period Type: |
instant |
|
| X |
- DefinitionLine items represent financial concepts included in a table. These concepts are used to disclose reportable information associated with domain members defined in one or many axes to the table.
| Name: |
us-gaap_PropertyPlantAndEquipmentLineItems |
| Namespace Prefix: |
us-gaap_ |
| Data Type: |
xbrli:stringItemType |
| Balance Type: |
na |
| Period Type: |
duration |
|
| X |
- DefinitionAmount after accumulated depreciation, depletion and amortization of physical assets used in the normal conduct of business to produce goods and services and not intended for resale. Examples include, but are not limited to, land, buildings, machinery and equipment, office equipment, and furniture and fixtures. Reference 1: http://fasb.org/us-gaap/role/ref/legacyRef
-Name Accounting Standards Codification
-Section 50
-Paragraph 1
-SubTopic 10
-Topic 360
-Publisher FASB
-URI https://asc.fasb.org//1943274/2147482099/360-10-50-1
Reference 2: http://www.xbrl.org/2003/role/exampleRef
-Topic 852
-SubTopic 10
-Name Accounting Standards Codification
-Section 55
-Paragraph 10
-Publisher FASB
-URI https://asc.fasb.org//1943274/2147481372/852-10-55-10
Reference 3: http://www.xbrl.org/2003/role/disclosureRef
-Topic 944
-SubTopic 210
-Name Accounting Standards Codification
-Section S99
-Paragraph 1
-Subparagraph (SX 210.7-03(a)(8))
-Publisher FASB
-URI https://asc.fasb.org//1943274/2147479440/944-210-S99-1
Reference 4: http://www.xbrl.org/2003/role/disclosureRef
-Topic 942
-SubTopic 360
-Name Accounting Standards Codification
-Section 50
-Paragraph 1
-Publisher FASB
-URI https://asc.fasb.org//1943274/2147480842/942-360-50-1
| Name: |
us-gaap_PropertyPlantAndEquipmentNet |
| Namespace Prefix: |
us-gaap_ |
| Data Type: |
xbrli:monetaryItemType |
| Balance Type: |
debit |
| Period Type: |
instant |
|
| X |
- Details
| Name: |
us-gaap_PropertyPlantAndEquipmentByTypeAxis=us-gaap_ComputerEquipmentMember |
| Namespace Prefix: |
|
| Data Type: |
na |
| Balance Type: |
|
| Period Type: |
|
|
| X |
- Details
| Name: |
us-gaap_PropertyPlantAndEquipmentByTypeAxis=us-gaap_FurnitureAndFixturesMember |
| Namespace Prefix: |
|
| Data Type: |
na |
| Balance Type: |
|
| Period Type: |
|
|
| X |
- Details
| Name: |
us-gaap_PropertyPlantAndEquipmentByTypeAxis=us-gaap_ElectricTransmissionMember |
| Namespace Prefix: |
|
| Data Type: |
na |
| Balance Type: |
|
| Period Type: |
|
|
| X |
- Details
| Name: |
us-gaap_PropertyPlantAndEquipmentByTypeAxis=ASFH_HandphoneMember |
| Namespace Prefix: |
|
| Data Type: |
na |
| Balance Type: |
|
| Period Type: |
|
|
| X |
- Details
| Name: |
us-gaap_PropertyPlantAndEquipmentByTypeAxis=us-gaap_OfficeEquipmentMember |
| Namespace Prefix: |
|
| Data Type: |
na |
| Balance Type: |
|
| Period Type: |
|
|
| X |
- Details
| Name: |
us-gaap_PropertyPlantAndEquipmentByTypeAxis=ASFH_RenovationMember |
| Namespace Prefix: |
|
| Data Type: |
na |
| Balance Type: |
|
| Period Type: |
|
|
| X |
- Details
| Name: |
us-gaap_PropertyPlantAndEquipmentByTypeAxis=ASFH_MotorVehicalMember |
| Namespace Prefix: |
|
| Data Type: |
na |
| Balance Type: |
|
| Period Type: |
|
|
| X |
- Details
| Name: |
us-gaap_PropertyPlantAndEquipmentByTypeAxis=ASFH_PropertyMember |
| Namespace Prefix: |
|
| Data Type: |
na |
| Balance Type: |
|
| Period Type: |
|
|
v3.23.3
SCHEDULE OF INVESTMENT IN PROPERTY AND PLANT (Details) - USD ($)
|
9 Months Ended |
12 Months Ended |
Sep. 30, 2023 |
Sep. 30, 2022 |
Dec. 31, 2022 |
| Property, Plant and Equipment [Line Items] |
|
|
|
| Investment in renovation |
$ 30,320
|
|
|
| Total investment in property and plant |
30,320
|
|
|
| Depreciation for the period |
34,234
|
|
|
| Computer Equipment [Member] |
|
|
|
| Property, Plant and Equipment [Line Items] |
|
|
|
| Investment in renovation |
17,479
|
|
|
| Total investment in property and plant |
17,479
|
|
|
| Furniture and Fixtures [Member] |
|
|
|
| Property, Plant and Equipment [Line Items] |
|
|
|
| Investment in renovation |
374
|
|
|
| Total investment in property and plant |
374
|
|
|
| Electric Transmission and Distribution Equipment [Member] |
|
|
|
| Property, Plant and Equipment [Line Items] |
|
|
|
| Investment in renovation |
280
|
|
|
| Total investment in property and plant |
280
|
|
|
| Handphone [Member] |
|
|
|
| Property, Plant and Equipment [Line Items] |
|
|
|
| Investment in renovation |
1,874
|
|
|
| Total investment in property and plant |
1,874
|
|
|
| Office Equipment [Member] |
|
|
|
| Property, Plant and Equipment [Line Items] |
|
|
|
| Investment in renovation |
6,216
|
|
|
| Total investment in property and plant |
6,216
|
|
|
| Renovation [Member] |
|
|
|
| Property, Plant and Equipment [Line Items] |
|
|
|
| Investment in renovation |
4,097
|
|
|
| Total investment in property and plant |
$ 4,097
|
|
|
| X |
- DefinitionThe amount of expense recognized in the current period that reflects the allocation of the cost of tangible assets over the assets' useful lives. Includes production and non-production related depreciation. Reference 1: http://fasb.org/us-gaap/role/ref/legacyRef
-Name Accounting Standards Codification
-Section 45
-Paragraph 28
-Subparagraph (b)
-SubTopic 10
-Topic 230
-Publisher FASB
-URI https://asc.fasb.org//1943274/2147482740/230-10-45-28
Reference 2: http://fasb.org/us-gaap/role/ref/legacyRef
-Name Accounting Standards Codification
-Topic 360
-SubTopic 10
-Section 50
-Paragraph 1
-Subparagraph (a)
-Publisher FASB
-URI https://asc.fasb.org//1943274/2147482099/360-10-50-1
| Name: |
us-gaap_Depreciation |
| Namespace Prefix: |
us-gaap_ |
| Data Type: |
xbrli:monetaryItemType |
| Balance Type: |
debit |
| Period Type: |
duration |
|
| X |
- DefinitionThe cash outflow associated with the acquisition of long-lived, physical assets that are used in the normal conduct of business to produce goods and services and not intended for resale; includes cash outflows to pay for construction of self-constructed assets. Reference 1: http://fasb.org/us-gaap/role/ref/legacyRef
-Topic 230
-SubTopic 10
-Name Accounting Standards Codification
-Section 45
-Paragraph 13
-Subparagraph (c)
-Publisher FASB
-URI https://asc.fasb.org//1943274/2147482740/230-10-45-13
| Name: |
us-gaap_PaymentsToAcquirePropertyPlantAndEquipment |
| Namespace Prefix: |
us-gaap_ |
| Data Type: |
xbrli:monetaryItemType |
| Balance Type: |
credit |
| Period Type: |
duration |
|
| X |
- DefinitionLine items represent financial concepts included in a table. These concepts are used to disclose reportable information associated with domain members defined in one or many axes to the table.
| Name: |
us-gaap_PropertyPlantAndEquipmentLineItems |
| Namespace Prefix: |
us-gaap_ |
| Data Type: |
xbrli:stringItemType |
| Balance Type: |
na |
| Period Type: |
duration |
|
| X |
- Details
| Name: |
us-gaap_PropertyPlantAndEquipmentByTypeAxis=us-gaap_ComputerEquipmentMember |
| Namespace Prefix: |
|
| Data Type: |
na |
| Balance Type: |
|
| Period Type: |
|
|
| X |
- Details
| Name: |
us-gaap_PropertyPlantAndEquipmentByTypeAxis=us-gaap_FurnitureAndFixturesMember |
| Namespace Prefix: |
|
| Data Type: |
na |
| Balance Type: |
|
| Period Type: |
|
|
| X |
- Details
| Name: |
us-gaap_PropertyPlantAndEquipmentByTypeAxis=us-gaap_ElectricTransmissionAndDistributionMember |
| Namespace Prefix: |
|
| Data Type: |
na |
| Balance Type: |
|
| Period Type: |
|
|
| X |
- Details
| Name: |
us-gaap_PropertyPlantAndEquipmentByTypeAxis=ASFH_HandphoneMember |
| Namespace Prefix: |
|
| Data Type: |
na |
| Balance Type: |
|
| Period Type: |
|
|
| X |
- Details
| Name: |
us-gaap_PropertyPlantAndEquipmentByTypeAxis=us-gaap_OfficeEquipmentMember |
| Namespace Prefix: |
|
| Data Type: |
na |
| Balance Type: |
|
| Period Type: |
|
|
| X |
- Details
| Name: |
us-gaap_PropertyPlantAndEquipmentByTypeAxis=ASFH_RenovationMember |
| Namespace Prefix: |
|
| Data Type: |
na |
| Balance Type: |
|
| Period Type: |
|
|
v3.23.3
| X |
- DefinitionThe cash outflow associated with the acquisition of long-lived, physical assets that are used in the normal conduct of business to produce goods and services and not intended for resale; includes cash outflows to pay for construction of self-constructed assets. Reference 1: http://fasb.org/us-gaap/role/ref/legacyRef
-Topic 230
-SubTopic 10
-Name Accounting Standards Codification
-Section 45
-Paragraph 13
-Subparagraph (c)
-Publisher FASB
-URI https://asc.fasb.org//1943274/2147482740/230-10-45-13
| Name: |
us-gaap_PaymentsToAcquirePropertyPlantAndEquipment |
| Namespace Prefix: |
us-gaap_ |
| Data Type: |
xbrli:monetaryItemType |
| Balance Type: |
credit |
| Period Type: |
duration |
|
| X |
- DefinitionLine items represent financial concepts included in a table. These concepts are used to disclose reportable information associated with domain members defined in one or many axes to the table.
| Name: |
us-gaap_PropertyPlantAndEquipmentLineItems |
| Namespace Prefix: |
us-gaap_ |
| Data Type: |
xbrli:stringItemType |
| Balance Type: |
na |
| Period Type: |
duration |
|
| X |
- Details
| Name: |
us-gaap_PropertyPlantAndEquipmentByTypeAxis=ASFH_PropertyMember |
| Namespace Prefix: |
|
| Data Type: |
na |
| Balance Type: |
|
| Period Type: |
|
|
| X |
- Details
| Name: |
srt_TitleOfIndividualAxis=srt_DirectorMember |
| Namespace Prefix: |
|
| Data Type: |
na |
| Balance Type: |
|
| Period Type: |
|
|
v3.23.3
| X |
- References
+ Details
| Name: |
ASFH_DisclosureOtherPayablesAndAccruedLiabilitiesAbstract |
| Namespace Prefix: |
ASFH_ |
| Data Type: |
xbrli:stringItemType |
| Balance Type: |
na |
| Period Type: |
duration |
|
| X |
- DefinitionAmount of liabilities incurred to vendors for goods and services received, and accrued liabilities classified as other, payable within one year or the normal operating cycle, if longer.
| Name: |
us-gaap_AccountsPayableAndOtherAccruedLiabilitiesCurrent |
| Namespace Prefix: |
us-gaap_ |
| Data Type: |
xbrli:monetaryItemType |
| Balance Type: |
credit |
| Period Type: |
instant |
|
| X |
- DefinitionAmount of obligations incurred classified as other, payable within one year or the normal operating cycle, if longer. Reference 1: http://fasb.org/us-gaap/role/ref/legacyRef
-Name Accounting Standards Codification
-Topic 210
-SubTopic 10
-Section S99
-Paragraph 1
-Subparagraph (SX 210.5-02.19(a))
-Publisher FASB
-URI https://asc.fasb.org//1943274/2147480566/210-10-S99-1
| Name: |
us-gaap_AccountsPayableOtherCurrent |
| Namespace Prefix: |
us-gaap_ |
| Data Type: |
xbrli:monetaryItemType |
| Balance Type: |
credit |
| Period Type: |
instant |
|
| X |
- DefinitionCarrying value as of the balance sheet date of obligations incurred and payable, pertaining to costs that are statutory in nature, are incurred on contractual obligations, or accumulate over time and for which invoices have not yet been received or will not be rendered. Examples include taxes, interest, rent and utilities. Used to reflect the current portion of the liabilities (due within one year or within the normal operating cycle if longer). Reference 1: http://fasb.org/us-gaap/role/ref/legacyRef
-Name Accounting Standards Codification
-Topic 210
-SubTopic 10
-Section S99
-Paragraph 1
-Subparagraph (SX 210.5-02.20)
-Publisher FASB
-URI https://asc.fasb.org//1943274/2147480566/210-10-S99-1
| Name: |
us-gaap_AccruedLiabilitiesCurrent |
| Namespace Prefix: |
us-gaap_ |
| Data Type: |
xbrli:monetaryItemType |
| Balance Type: |
credit |
| Period Type: |
instant |
|
v3.23.3
| X |
- DefinitionAmount of liabilities classified as other, due within one year or the normal operating cycle, if longer. Reference 1: http://www.xbrl.org/2003/role/exampleRef
-Topic 852
-SubTopic 10
-Name Accounting Standards Codification
-Section 55
-Paragraph 10
-Publisher FASB
-URI https://asc.fasb.org//1943274/2147481372/852-10-55-10
Reference 2: http://fasb.org/us-gaap/role/ref/legacyRef
-Name Accounting Standards Codification
-Topic 210
-SubTopic 10
-Section S99
-Paragraph 1
-Subparagraph (SX 210.5-02.20)
-Publisher FASB
-URI https://asc.fasb.org//1943274/2147480566/210-10-S99-1
| Name: |
us-gaap_OtherLiabilitiesCurrent |
| Namespace Prefix: |
us-gaap_ |
| Data Type: |
xbrli:monetaryItemType |
| Balance Type: |
credit |
| Period Type: |
instant |
|
v3.23.3
| X |
- DefinitionLine items represent financial concepts included in a table. These concepts are used to disclose reportable information associated with domain members defined in one or many axes to the table.
| Name: |
us-gaap_DefinedBenefitPlanDisclosureLineItems |
| Namespace Prefix: |
us-gaap_ |
| Data Type: |
xbrli:stringItemType |
| Balance Type: |
na |
| Period Type: |
duration |
|
| X |
- DefinitionAmount of cash outflow from operating lease, excluding payments to bring another asset to condition and location necessary for its intended use. Reference 1: http://www.xbrl.org/2003/role/disclosureRef
-Topic 842
-SubTopic 20
-Name Accounting Standards Codification
-Section 45
-Paragraph 5
-Subparagraph (c)
-Publisher FASB
-URI https://asc.fasb.org//1943274/2147479041/842-20-45-5
Reference 2: http://www.xbrl.org/2003/role/disclosureRef
-Topic 842
-SubTopic 20
-Name Accounting Standards Codification
-Section 50
-Paragraph 4
-Subparagraph (g)(1)
-Publisher FASB
-URI https://asc.fasb.org//1943274/2147478964/842-20-50-4
| Name: |
us-gaap_OperatingLeasePayments |
| Namespace Prefix: |
us-gaap_ |
| Data Type: |
xbrli:monetaryItemType |
| Balance Type: |
credit |
| Period Type: |
duration |
|
| X |
- DefinitionAmount of liabilities classified as other, due within one year or the normal operating cycle, if longer. Reference 1: http://www.xbrl.org/2003/role/exampleRef
-Topic 852
-SubTopic 10
-Name Accounting Standards Codification
-Section 55
-Paragraph 10
-Publisher FASB
-URI https://asc.fasb.org//1943274/2147481372/852-10-55-10
Reference 2: http://fasb.org/us-gaap/role/ref/legacyRef
-Name Accounting Standards Codification
-Topic 210
-SubTopic 10
-Section S99
-Paragraph 1
-Subparagraph (SX 210.5-02.20)
-Publisher FASB
-URI https://asc.fasb.org//1943274/2147480566/210-10-S99-1
| Name: |
us-gaap_OtherLiabilitiesCurrent |
| Namespace Prefix: |
us-gaap_ |
| Data Type: |
xbrli:monetaryItemType |
| Balance Type: |
credit |
| Period Type: |
instant |
|
| X |
- Details
| Name: |
srt_TitleOfIndividualAxis=srt_ChiefExecutiveOfficerMember |
| Namespace Prefix: |
|
| Data Type: |
na |
| Balance Type: |
|
| Period Type: |
|
|
v3.23.3
| X |
- DefinitionAmount, after deduction of unamortized premium (discount) and debt issuance cost, of long-term debt. Excludes lease obligation. Reference 1: http://fasb.org/us-gaap/role/ref/legacyRef
-Name Accounting Standards Codification
-Section S99
-Paragraph 1
-Subparagraph (SX 210.5-02(22))
-SubTopic 10
-Topic 210
-Publisher FASB
-URI https://asc.fasb.org//1943274/2147480566/210-10-S99-1
Reference 2: http://www.xbrl.org/2003/role/exampleRef
-Topic 470
-SubTopic 20
-Name Accounting Standards Codification
-Section 55
-Paragraph 69B
-Publisher FASB
-URI https://asc.fasb.org//1943274/2147481568/470-20-55-69B
Reference 3: http://www.xbrl.org/2003/role/exampleRef
-Topic 470
-SubTopic 20
-Name Accounting Standards Codification
-Section 55
-Paragraph 69C
-Publisher FASB
-URI https://asc.fasb.org//1943274/2147481568/470-20-55-69C
Reference 4: http://www.xbrl.org/2003/role/disclosureRef
-Topic 470
-SubTopic 20
-Name Accounting Standards Codification
-Section 50
-Paragraph 1D
-Subparagraph (b)
-Publisher FASB
-URI https://asc.fasb.org//1943274/2147481139/470-20-50-1D
Reference 5: http://www.xbrl.org/2009/role/commonPracticeRef
-Topic 944
-SubTopic 210
-Name Accounting Standards Codification
-Section S99
-Paragraph 1
-Subparagraph (SX 210.7-03(a)(16)(a)(2))
-Publisher FASB
-URI https://asc.fasb.org//1943274/2147479440/944-210-S99-1
Reference 6: http://fasb.org/us-gaap/role/ref/legacyRef
-Topic 942
-SubTopic 210
-Name Accounting Standards Codification
-Section S99
-Paragraph 1
-Subparagraph (SX 210.9-03(16))
-Publisher FASB
-URI https://asc.fasb.org//1943274/2147479853/942-210-S99-1
Reference 7: http://www.xbrl.org/2003/role/disclosureRef
-Topic 470
-SubTopic 20
-Name Accounting Standards Codification
-Section 50
-Paragraph 4
-Subparagraph (b)(3)
-Publisher FASB
-URI https://asc.fasb.org//1943274/2147481139/470-20-50-4
| Name: |
us-gaap_LongTermDebt |
| Namespace Prefix: |
us-gaap_ |
| Data Type: |
xbrli:monetaryItemType |
| Balance Type: |
credit |
| Period Type: |
instant |
|
| X |
- DefinitionAmount of long-term debt payable, sinking fund requirement, and other securities issued that are redeemable by holder at fixed or determinable price and date, maturing in next fiscal year following current fiscal year. Excludes interim and annual periods when interim periods are reported from current statement of financial position date (rolling approach). Reference 1: http://www.xbrl.org/2003/role/disclosureRef
-Topic 235
-SubTopic 10
-Name Accounting Standards Codification
-Section S99
-Paragraph 3
-Subparagraph (SX 210.12-04(a))
-Publisher FASB
-URI https://asc.fasb.org//1943274/2147480678/235-10-S99-3
Reference 2: http://www.xbrl.org/2003/role/disclosureRef
-Topic 470
-SubTopic 20
-Name Accounting Standards Codification
-Section 50
-Paragraph 1E
-Subparagraph (d)
-Publisher FASB
-URI https://asc.fasb.org//1943274/2147481139/470-20-50-1E
Reference 3: http://fasb.org/us-gaap/role/ref/legacyRef
-Name Accounting Standards Codification
-Section 50
-Paragraph 1
-SubTopic 10
-Topic 470
-Publisher FASB
-URI https://asc.fasb.org//1943274/2147481544/470-10-50-1
| Name: |
us-gaap_LongTermDebtMaturitiesRepaymentsOfPrincipalInNextTwelveMonths |
| Namespace Prefix: |
us-gaap_ |
| Data Type: |
xbrli:monetaryItemType |
| Balance Type: |
credit |
| Period Type: |
instant |
|
| X |
- DefinitionAmount of long-term debt payable, sinking fund requirement, and other securities issued that are redeemable by holder at fixed or determinable price and date, maturing in remainder of current fiscal year. Reference 1: http://www.xbrl.org/2009/role/commonPracticeRef
-Topic 235
-SubTopic 10
-Name Accounting Standards Codification
-Section S99
-Paragraph 3
-Subparagraph (SX 210.12-04(a))
-Publisher FASB
-URI https://asc.fasb.org//1943274/2147480678/235-10-S99-3
| Name: |
us-gaap_LongTermDebtMaturitiesRepaymentsOfPrincipalRemainderOfFiscalYear |
| Namespace Prefix: |
us-gaap_ |
| Data Type: |
xbrli:monetaryItemType |
| Balance Type: |
credit |
| Period Type: |
instant |
|
| X |
- DefinitionLine items represent financial concepts included in a table. These concepts are used to disclose reportable information associated with domain members defined in one or many axes to the table.
| Name: |
us-gaap_ShortTermDebtLineItems |
| Namespace Prefix: |
us-gaap_ |
| Data Type: |
xbrli:stringItemType |
| Balance Type: |
na |
| Period Type: |
duration |
|
| X |
- Details
| Name: |
us-gaap_DebtInstrumentAxis=ASFH_HirePurchaseLoanMember |
| Namespace Prefix: |
|
| Data Type: |
na |
| Balance Type: |
|
| Period Type: |
|
|
v3.23.3
| X |
- DefinitionPayments to acquire motor vehicle.
| Name: |
ASFH_PaymentsToAcquireMotorVehicle |
| Namespace Prefix: |
ASFH_ |
| Data Type: |
xbrli:monetaryItemType |
| Balance Type: |
credit |
| Period Type: |
duration |
|
| X |
- DefinitionAverage rate paid on long-term debt. Reference 1: http://www.xbrl.org/2003/role/disclosureRef
-Name Regulation S-K (SK)
-Number 229
-Section 1402
-Paragraph (a)
-Publisher SEC
Reference 2: http://www.xbrl.org/2003/role/disclosureRef
-Name Regulation S-K (SK)
-Number 229
-Section 1402
-Paragraph (b)
-Subparagraph (3)
-Publisher SEC
| Name: |
srt_LongTermDebtAverageRatePaid |
| Namespace Prefix: |
srt_ |
| Data Type: |
dtr-types:percentItemType |
| Balance Type: |
na |
| Period Type: |
duration |
|
| X |
- DefinitionAmount of the required periodic payments applied to principal. Reference 1: http://fasb.org/us-gaap/role/ref/legacyRef
-Name Accounting Standards Codification
-Topic 210
-SubTopic 10
-Section S99
-Paragraph 1
-Subparagraph (SX 210.5-02.22)
-Publisher FASB
-URI https://asc.fasb.org//1943274/2147480566/210-10-S99-1
| Name: |
us-gaap_DebtInstrumentPeriodicPaymentPrincipal |
| Namespace Prefix: |
us-gaap_ |
| Data Type: |
xbrli:monetaryItemType |
| Balance Type: |
debit |
| Period Type: |
duration |
|
| X |
- DefinitionAmount, after deduction of unamortized premium (discount) and debt issuance cost, of long-term debt. Excludes lease obligation. Reference 1: http://fasb.org/us-gaap/role/ref/legacyRef
-Name Accounting Standards Codification
-Section S99
-Paragraph 1
-Subparagraph (SX 210.5-02(22))
-SubTopic 10
-Topic 210
-Publisher FASB
-URI https://asc.fasb.org//1943274/2147480566/210-10-S99-1
Reference 2: http://www.xbrl.org/2003/role/exampleRef
-Topic 470
-SubTopic 20
-Name Accounting Standards Codification
-Section 55
-Paragraph 69B
-Publisher FASB
-URI https://asc.fasb.org//1943274/2147481568/470-20-55-69B
Reference 3: http://www.xbrl.org/2003/role/exampleRef
-Topic 470
-SubTopic 20
-Name Accounting Standards Codification
-Section 55
-Paragraph 69C
-Publisher FASB
-URI https://asc.fasb.org//1943274/2147481568/470-20-55-69C
Reference 4: http://www.xbrl.org/2003/role/disclosureRef
-Topic 470
-SubTopic 20
-Name Accounting Standards Codification
-Section 50
-Paragraph 1D
-Subparagraph (b)
-Publisher FASB
-URI https://asc.fasb.org//1943274/2147481139/470-20-50-1D
Reference 5: http://www.xbrl.org/2009/role/commonPracticeRef
-Topic 944
-SubTopic 210
-Name Accounting Standards Codification
-Section S99
-Paragraph 1
-Subparagraph (SX 210.7-03(a)(16)(a)(2))
-Publisher FASB
-URI https://asc.fasb.org//1943274/2147479440/944-210-S99-1
Reference 6: http://fasb.org/us-gaap/role/ref/legacyRef
-Topic 942
-SubTopic 210
-Name Accounting Standards Codification
-Section S99
-Paragraph 1
-Subparagraph (SX 210.9-03(16))
-Publisher FASB
-URI https://asc.fasb.org//1943274/2147479853/942-210-S99-1
Reference 7: http://www.xbrl.org/2003/role/disclosureRef
-Topic 470
-SubTopic 20
-Name Accounting Standards Codification
-Section 50
-Paragraph 4
-Subparagraph (b)(3)
-Publisher FASB
-URI https://asc.fasb.org//1943274/2147481139/470-20-50-4
| Name: |
us-gaap_LongTermDebt |
| Namespace Prefix: |
us-gaap_ |
| Data Type: |
xbrli:monetaryItemType |
| Balance Type: |
credit |
| Period Type: |
instant |
|
| X |
- DefinitionPeriod between issuance and maturity of long-term debt, in 'PnYnMnDTnHnMnS' format, for example, 'P1Y5M13D' represents reported fact of one year, five months, and thirteen days. Reference 1: http://www.xbrl.org/2009/role/commonPracticeRef
-Topic 820
-SubTopic 10
-Name Accounting Standards Codification
-Section 50
-Paragraph 2
-Subparagraph (bbb)(2)
-Publisher FASB
-URI https://asc.fasb.org//1943274/2147482106/820-10-50-2
| Name: |
us-gaap_LongTermDebtTerm |
| Namespace Prefix: |
us-gaap_ |
| Data Type: |
xbrli:durationItemType |
| Balance Type: |
na |
| Period Type: |
instant |
|
| X |
- DefinitionLine items represent financial concepts included in a table. These concepts are used to disclose reportable information associated with domain members defined in one or many axes to the table.
| Name: |
us-gaap_PropertyPlantAndEquipmentLineItems |
| Namespace Prefix: |
us-gaap_ |
| Data Type: |
xbrli:stringItemType |
| Balance Type: |
na |
| Period Type: |
duration |
|
| X |
- DefinitionThe cash outflow for debt initially having maturity due after one year or beyond the normal operating cycle, if longer. Reference 1: http://www.xbrl.org/2003/role/disclosureRef
-Topic 946
-SubTopic 10
-Name Accounting Standards Codification
-Section S99
-Paragraph 3
-Subparagraph (SX 210.6-03(i)(2))
-Publisher FASB
-URI https://asc.fasb.org//1943274/2147479886/946-10-S99-3
Reference 2: http://fasb.org/us-gaap/role/ref/legacyRef
-Name Accounting Standards Codification
-Topic 230
-SubTopic 10
-Section 45
-Paragraph 15
-Subparagraph (b)
-Publisher FASB
-URI https://asc.fasb.org//1943274/2147482740/230-10-45-15
| Name: |
us-gaap_RepaymentsOfLongTermDebt |
| Namespace Prefix: |
us-gaap_ |
| Data Type: |
xbrli:monetaryItemType |
| Balance Type: |
credit |
| Period Type: |
duration |
|
| X |
- Details
| Name: |
us-gaap_PropertyPlantAndEquipmentByTypeAxis=us-gaap_VehiclesMember |
| Namespace Prefix: |
|
| Data Type: |
na |
| Balance Type: |
|
| Period Type: |
|
|
v3.23.3
SCHEDULE OF LEASE RIGHT OF USE ASSETS AND LEASE LIABILITIES (Details) - USD ($)
|
9 Months Ended |
|
Sep. 30, 2023 |
Sep. 30, 2022 |
Dec. 31, 2022 |
| Lease Right-of-use Asset And Lease Liabilities |
|
|
|
| Right of use asset, balance |
$ 134,807
|
|
|
| New lease recognized |
16,513
|
|
|
| Amortization expenses |
(65,252)
|
|
|
| Adjustment for foreign currency translation difference |
(6,161)
|
|
|
| Right of use asset, balance |
79,907
|
|
|
| Operating Lease, Liability |
134,807
|
|
|
| New lease recognized |
16,513
|
|
|
| Imputed interest |
4,114
|
|
|
| Gross repayments |
(69,366)
|
|
|
| Adjustment for foreign currency translation difference |
(6,161)
|
|
|
| Operating Lease, Liability |
79,907
|
|
|
| Operating Lease, Liability, Current |
74,204
|
|
|
| Operating Lease, Liability, Noncurrent |
$ 5,703
|
|
|
| X |
- DefinitionAdjustment for foreign currency translation difference.
| Name: |
ASFH_AdjustmentForForeignCurrencyTranslationDifference |
| Namespace Prefix: |
ASFH_ |
| Data Type: |
xbrli:monetaryItemType |
| Balance Type: |
debit |
| Period Type: |
duration |
|
| X |
- DefinitionAdjustment for foreign currency translation difference operating leases.
| Name: |
ASFH_AdjustmentForForeignCurrencyTranslationDifferenceOperatingLeases |
| Namespace Prefix: |
ASFH_ |
| Data Type: |
xbrli:monetaryItemType |
| Balance Type: |
debit |
| Period Type: |
duration |
|
| X |
- References
+ Details
| Name: |
ASFH_DisclosureLeaseRightofuseAssetAndLeaseLiabilitiesAbstract |
| Namespace Prefix: |
ASFH_ |
| Data Type: |
xbrli:stringItemType |
| Balance Type: |
na |
| Period Type: |
duration |
|
| X |
- DefinitionNew operating lease recognition.
| Name: |
ASFH_NewOperatingLeaseRecognition |
| Namespace Prefix: |
ASFH_ |
| Data Type: |
xbrli:monetaryItemType |
| Balance Type: |
debit |
| Period Type: |
duration |
|
| X |
- DefinitionOperating lease right of use asset purchase price allocation.
| Name: |
ASFH_OperatingLeaseRightOfUseAssetPurchasePriceAllocation |
| Namespace Prefix: |
ASFH_ |
| Data Type: |
xbrli:monetaryItemType |
| Balance Type: |
debit |
| Period Type: |
instant |
|
| X |
- DefinitionPresent value of lessee's discounted obligation for lease payments from operating lease. Reference 1: http://www.xbrl.org/2003/role/disclosureRef
-Topic 842
-SubTopic 20
-Name Accounting Standards Codification
-Section 45
-Paragraph 1
-Subparagraph (b)
-Publisher FASB
-URI https://asc.fasb.org//1943274/2147479041/842-20-45-1
| Name: |
us-gaap_OperatingLeaseLiability |
| Namespace Prefix: |
us-gaap_ |
| Data Type: |
xbrli:monetaryItemType |
| Balance Type: |
credit |
| Period Type: |
instant |
|
| X |
- DefinitionPresent value of lessee's discounted obligation for lease payments from operating lease, classified as current. Reference 1: http://www.xbrl.org/2003/role/disclosureRef
-Topic 842
-SubTopic 20
-Name Accounting Standards Codification
-Section 45
-Paragraph 1
-Subparagraph (b)
-Publisher FASB
-URI https://asc.fasb.org//1943274/2147479041/842-20-45-1
| Name: |
us-gaap_OperatingLeaseLiabilityCurrent |
| Namespace Prefix: |
us-gaap_ |
| Data Type: |
xbrli:monetaryItemType |
| Balance Type: |
credit |
| Period Type: |
instant |
|
| X |
- DefinitionPresent value of lessee's discounted obligation for lease payments from operating lease, classified as noncurrent. Reference 1: http://www.xbrl.org/2003/role/disclosureRef
-Topic 842
-SubTopic 20
-Name Accounting Standards Codification
-Section 45
-Paragraph 1
-Subparagraph (b)
-Publisher FASB
-URI https://asc.fasb.org//1943274/2147479041/842-20-45-1
| Name: |
us-gaap_OperatingLeaseLiabilityNoncurrent |
| Namespace Prefix: |
us-gaap_ |
| Data Type: |
xbrli:monetaryItemType |
| Balance Type: |
credit |
| Period Type: |
instant |
|
| X |
- DefinitionInterest received on loans and other debt instruments during the current period. Reference 1: http://www.xbrl.org/2009/role/commonPracticeRef
-Topic 230
-SubTopic 10
-Name Accounting Standards Codification
-Section 45
-Paragraph 16
-Subparagraph (b)
-Publisher FASB
-URI https://asc.fasb.org//1943274/2147482740/230-10-45-16
| Name: |
us-gaap_ProceedsFromInterestReceived |
| Namespace Prefix: |
us-gaap_ |
| Data Type: |
xbrli:monetaryItemType |
| Balance Type: |
debit |
| Period Type: |
duration |
|
| X |
- DefinitionAmount of cash inflow from lease payment, classified as operating activity. Reference 1: http://www.xbrl.org/2003/role/disclosureRef
-Topic 842
-SubTopic 30
-Name Accounting Standards Codification
-Section 45
-Paragraph 5
-Publisher FASB
-URI https://asc.fasb.org//1943274/2147479016/842-30-45-5
Reference 2: http://www.xbrl.org/2003/role/disclosureRef
-Topic 842
-SubTopic 30
-Name Accounting Standards Codification
-Section 45
-Paragraph 7
-Publisher FASB
-URI https://asc.fasb.org//1943274/2147479016/842-30-45-7
| Name: |
us-gaap_ProceedsFromLeasePayments |
| Namespace Prefix: |
us-gaap_ |
| Data Type: |
xbrli:monetaryItemType |
| Balance Type: |
debit |
| Period Type: |
duration |
|
v3.23.3
| X |
- References
+ Details
| Name: |
ASFH_DisclosureLeaseRightofuseAssetAndLeaseLiabilitiesAbstract |
| Namespace Prefix: |
ASFH_ |
| Data Type: |
xbrli:stringItemType |
| Balance Type: |
na |
| Period Type: |
duration |
|
| X |
- DefinitionWeighted average discount rate for operating lease calculated at point in time. Reference 1: http://www.xbrl.org/2003/role/exampleRef
-Topic 842
-SubTopic 20
-Name Accounting Standards Codification
-Section 55
-Paragraph 53
-Publisher FASB
-URI https://asc.fasb.org//1943274/2147479589/842-20-55-53
Reference 2: http://www.xbrl.org/2003/role/disclosureRef
-Topic 842
-SubTopic 20
-Name Accounting Standards Codification
-Section 50
-Paragraph 4
-Subparagraph (g)(4)
-Publisher FASB
-URI https://asc.fasb.org//1943274/2147478964/842-20-50-4
| Name: |
us-gaap_OperatingLeaseWeightedAverageDiscountRatePercent |
| Namespace Prefix: |
us-gaap_ |
| Data Type: |
dtr-types:percentItemType |
| Balance Type: |
na |
| Period Type: |
instant |
|
| X |
- DefinitionWeighted average remaining lease term for operating lease, in 'PnYnMnDTnHnMnS' format, for example, 'P1Y5M13D' represents reported fact of one year, five months, and thirteen days. Reference 1: http://www.xbrl.org/2003/role/exampleRef
-Topic 842
-SubTopic 20
-Name Accounting Standards Codification
-Section 55
-Paragraph 53
-Publisher FASB
-URI https://asc.fasb.org//1943274/2147479589/842-20-55-53
Reference 2: http://www.xbrl.org/2003/role/disclosureRef
-Topic 842
-SubTopic 20
-Name Accounting Standards Codification
-Section 50
-Paragraph 4
-Subparagraph (g)(3)
-Publisher FASB
-URI https://asc.fasb.org//1943274/2147478964/842-20-50-4
| Name: |
us-gaap_OperatingLeaseWeightedAverageRemainingLeaseTerm1 |
| Namespace Prefix: |
us-gaap_ |
| Data Type: |
xbrli:durationItemType |
| Balance Type: |
na |
| Period Type: |
instant |
|
| X |
- DefinitionAmount of cash inflow from lease payment, classified as operating activity. Reference 1: http://www.xbrl.org/2003/role/disclosureRef
-Topic 842
-SubTopic 30
-Name Accounting Standards Codification
-Section 45
-Paragraph 5
-Publisher FASB
-URI https://asc.fasb.org//1943274/2147479016/842-30-45-5
Reference 2: http://www.xbrl.org/2003/role/disclosureRef
-Topic 842
-SubTopic 30
-Name Accounting Standards Codification
-Section 45
-Paragraph 7
-Publisher FASB
-URI https://asc.fasb.org//1943274/2147479016/842-30-45-7
| Name: |
us-gaap_ProceedsFromLeasePayments |
| Namespace Prefix: |
us-gaap_ |
| Data Type: |
xbrli:monetaryItemType |
| Balance Type: |
debit |
| Period Type: |
duration |
|
| X |
- DefinitionAmount of increase in right-of-use asset obtained in exchange for operating lease liability. Reference 1: http://www.xbrl.org/2003/role/exampleRef
-Topic 842
-SubTopic 20
-Name Accounting Standards Codification
-Section 55
-Paragraph 53
-Publisher FASB
-URI https://asc.fasb.org//1943274/2147479589/842-20-55-53
Reference 2: http://www.xbrl.org/2003/role/disclosureRef
-Topic 842
-SubTopic 20
-Name Accounting Standards Codification
-Section 50
-Paragraph 4
-Subparagraph (g)(2)
-Publisher FASB
-URI https://asc.fasb.org//1943274/2147478964/842-20-50-4
| Name: |
us-gaap_RightOfUseAssetObtainedInExchangeForOperatingLeaseLiability |
| Namespace Prefix: |
us-gaap_ |
| Data Type: |
xbrli:monetaryItemType |
| Balance Type: |
debit |
| Period Type: |
duration |
|
v3.23.3
v3.23.3
SCHEDULE OF CONCENTRATION OF RISK (Details) - USD ($)
|
3 Months Ended |
9 Months Ended |
Sep. 30, 2023 |
Sep. 30, 2022 |
Sep. 30, 2023 |
Sep. 30, 2022 |
| Concentration Risk [Line Items] |
|
|
|
|
| Revenue |
$ 695,145
|
|
$ 1,813,426
|
|
| Percentage of concentration risk |
100.00%
|
|
100.00%
|
|
| Accounts receivable, gross |
$ 612,461
|
|
$ 612,461
|
|
| Cost of revenue |
33,524
|
|
147,924
|
|
| Accounts payable, trade |
22,556
|
|
22,556
|
|
| Revenue Benchmark [Member] | Customer Concentration Risk [Member] | Customer F [Member] |
|
|
|
|
| Concentration Risk [Line Items] |
|
|
|
|
| Revenue |
$ 96,312
|
|
|
|
| Percentage of concentration risk |
14.00%
|
|
|
|
| Revenue Benchmark [Member] | Customer Concentration Risk [Member] | Customer G [Member] |
|
|
|
|
| Concentration Risk [Line Items] |
|
|
|
|
| Revenue |
$ 71,499
|
|
|
|
| Percentage of concentration risk |
10.00%
|
|
|
|
| Revenue Benchmark [Member] | Customer Concentration Risk [Member] | Others [Member] |
|
|
|
|
| Concentration Risk [Line Items] |
|
|
|
|
| Revenue |
$ 527,334
|
|
|
|
| Percentage of concentration risk |
76.00%
|
|
|
|
| Accounts Receivable [Member] | Customer Concentration Risk [Member] | Customer F [Member] |
|
|
|
|
| Concentration Risk [Line Items] |
|
|
|
|
| Accounts receivable, gross |
|
|
|
|
| Accounts Receivable [Member] | Customer Concentration Risk [Member] | Customer G [Member] |
|
|
|
|
| Concentration Risk [Line Items] |
|
|
|
|
| Accounts receivable, gross |
76,696
|
|
76,696
|
|
| Accounts Receivable [Member] | Customer Concentration Risk [Member] | Others [Member] |
|
|
|
|
| Concentration Risk [Line Items] |
|
|
|
|
| Accounts receivable, gross |
$ 535,765
|
|
$ 535,765
|
|
| Cost of Goods and Service, Product and Service Benchmark [Member] | Supplier Concentration Risk [Member] | Supplier A [Member] |
|
|
|
|
| Concentration Risk [Line Items] |
|
|
|
|
| Percentage of concentration risk |
76.00%
|
|
63.00%
|
|
| Cost of revenue |
$ 46,018
|
|
$ 92,632
|
|
| Cost of Goods and Service, Product and Service Benchmark [Member] | Supplier Concentration Risk [Member] | Supplier B[ Member] |
|
|
|
|
| Concentration Risk [Line Items] |
|
|
|
|
| Percentage of concentration risk |
15.00%
|
|
22.00%
|
|
| Cost of revenue |
$ 9,362
|
|
$ 32,053
|
|
| Cost of Goods and Service, Product and Service Benchmark [Member] | Supplier Concentration Risk [Member] | Others [Member] |
|
|
|
|
| Concentration Risk [Line Items] |
|
|
|
|
| Percentage of concentration risk |
9.00%
|
|
15.00%
|
|
| Cost of revenue |
$ 5,358
|
|
$ 23,239
|
|
| Accounts payable, trade |
162
|
|
162
|
|
| Accounts Payable [Member] | Supplier Concentration Risk [Member] | Supplier A [Member] |
|
|
|
|
| Concentration Risk [Line Items] |
|
|
|
|
| Accounts payable, trade |
19,027
|
|
19,027
|
|
| Accounts Payable [Member] | Supplier Concentration Risk [Member] | Supplier B[ Member] |
|
|
|
|
| Concentration Risk [Line Items] |
|
|
|
|
| Accounts payable, trade |
$ 3,367
|
|
$ 3,367
|
|
| X |
- DefinitionAmount, before allowance for credit loss, of right to consideration from customer for product sold and service rendered in normal course of business, classified as current. Reference 1: http://www.xbrl.org/2003/role/disclosureRef
-Topic 210
-SubTopic 10
-Name Accounting Standards Codification
-Section S99
-Paragraph 1
-Subparagraph (SX 210.5-02(3)(a)(1))
-Publisher FASB
-URI https://asc.fasb.org//1943274/2147480566/210-10-S99-1
Reference 2: http://www.xbrl.org/2003/role/exampleRef
-Topic 210
-SubTopic 10
-Name Accounting Standards Codification
-Section 45
-Paragraph 1
-Subparagraph (c)
-Publisher FASB
-URI https://asc.fasb.org//1943274/2147483467/210-10-45-1
Reference 3: http://www.xbrl.org/2003/role/disclosureRef
-Topic 310
-SubTopic 10
-Name Accounting Standards Codification
-Section 45
-Paragraph 2
-Publisher FASB
-URI https://asc.fasb.org//1943274/2147481990/310-10-45-2
Reference 4: http://www.xbrl.org/2003/role/disclosureRef
-Topic 310
-SubTopic 10
-Name Accounting Standards Codification
-Section 45
-Paragraph 9
-Publisher FASB
-URI https://asc.fasb.org//1943274/2147481990/310-10-45-9
| Name: |
us-gaap_AccountsReceivableGrossCurrent |
| Namespace Prefix: |
us-gaap_ |
| Data Type: |
xbrli:monetaryItemType |
| Balance Type: |
debit |
| Period Type: |
instant |
|
| X |
- DefinitionLine items represent financial concepts included in a table. These concepts are used to disclose reportable information associated with domain members defined in one or many axes to the table. Reference 1: http://www.xbrl.org/2003/role/disclosureRef
-Topic 954
-SubTopic 310
-Name Accounting Standards Codification
-Section 50
-Paragraph 2
-Publisher FASB
-URI https://asc.fasb.org//1943274/2147481027/954-310-50-2
| Name: |
us-gaap_ConcentrationRiskLineItems |
| Namespace Prefix: |
us-gaap_ |
| Data Type: |
xbrli:stringItemType |
| Balance Type: |
na |
| Period Type: |
duration |
|
| X |
- DefinitionFor an entity that discloses a concentration risk in relation to quantitative amount, which serves as the "benchmark" (or denominator) in the equation, this concept represents the concentration percentage derived from the division. Reference 1: http://www.xbrl.org/2003/role/disclosureRef
-Topic 280
-SubTopic 10
-Name Accounting Standards Codification
-Section 50
-Paragraph 42
-Publisher FASB
-URI https://asc.fasb.org//1943274/2147482810/280-10-50-42
Reference 2: http://fasb.org/us-gaap/role/ref/legacyRef
-Name Accounting Standards Codification
-Topic 825
-SubTopic 10
-Section 50
-Paragraph 21
-Subparagraph (a)
-Publisher FASB
-URI https://asc.fasb.org//1943274/2147482907/825-10-50-21
Reference 3: http://fasb.org/us-gaap/role/ref/legacyRef
-Name Accounting Standards Codification
-Topic 825
-SubTopic 10
-Section 50
-Paragraph 20
-Publisher FASB
-URI https://asc.fasb.org//1943274/2147482907/825-10-50-20
Reference 4: http://fasb.org/us-gaap/role/ref/legacyRef
-Name Accounting Standards Codification
-Topic 275
-SubTopic 10
-Section 50
-Paragraph 18
-Publisher FASB
-URI https://asc.fasb.org//1943274/2147482861/275-10-50-18
Reference 5: http://fasb.org/us-gaap/role/ref/legacyRef
-Name Accounting Standards Codification
-Topic 275
-SubTopic 10
-Section 50
-Paragraph 20
-Publisher FASB
-URI https://asc.fasb.org//1943274/2147482861/275-10-50-20
| Name: |
us-gaap_ConcentrationRiskPercentage1 |
| Namespace Prefix: |
us-gaap_ |
| Data Type: |
dtr-types:percentItemType |
| Balance Type: |
na |
| Period Type: |
duration |
|
| X |
- DefinitionThe aggregate costs related to goods produced and sold and services rendered by an entity during the reporting period. This excludes costs incurred during the reporting period related to financial services rendered and other revenue generating activities. Reference 1: http://www.xbrl.org/2003/role/disclosureRef
-Topic 924
-SubTopic 10
-Name Accounting Standards Codification
-Section S99
-Paragraph 1
-Subparagraph (SAB Topic 11.L)
-Publisher FASB
-URI https://asc.fasb.org//1943274/2147479941/924-10-S99-1
Reference 2: http://fasb.org/us-gaap/role/ref/legacyRef
-Topic 220
-SubTopic 10
-Name Accounting Standards Codification
-Section S99
-Paragraph 2
-Subparagraph (SX 210.5-03.2(a),(d))
-Publisher FASB
-URI https://asc.fasb.org//1943274/2147483621/220-10-S99-2
| Name: |
us-gaap_CostOfGoodsAndServicesSold |
| Namespace Prefix: |
us-gaap_ |
| Data Type: |
xbrli:monetaryItemType |
| Balance Type: |
debit |
| Period Type: |
duration |
|
| X |
- DefinitionChange in recurring obligations of a business that arise from the acquisition of merchandise, materials, supplies and services used in the production and sale of goods and services. Reference 1: http://fasb.org/us-gaap/role/ref/legacyRef
-Name Accounting Standards Codification
-Section 45
-Paragraph 28
-Subparagraph (a)
-SubTopic 10
-Topic 230
-Publisher FASB
-URI https://asc.fasb.org//1943274/2147482740/230-10-45-28
| Name: |
us-gaap_IncreaseDecreaseInAccountsPayableTrade |
| Namespace Prefix: |
us-gaap_ |
| Data Type: |
xbrli:monetaryItemType |
| Balance Type: |
debit |
| Period Type: |
duration |
|
| X |
- DefinitionAmount, excluding tax collected from customer, of revenue from satisfaction of performance obligation by transferring promised good or service to customer. Tax collected from customer is tax assessed by governmental authority that is both imposed on and concurrent with specific revenue-producing transaction, including, but not limited to, sales, use, value added and excise. Reference 1: http://www.xbrl.org/2003/role/disclosureRef
-Topic 924
-SubTopic 10
-Name Accounting Standards Codification
-Section S99
-Paragraph 1
-Subparagraph (SAB Topic 11.L)
-Publisher FASB
-URI https://asc.fasb.org//1943274/2147479941/924-10-S99-1
Reference 2: http://www.xbrl.org/2003/role/disclosureRef
-Topic 606
-SubTopic 10
-Name Accounting Standards Codification
-Section 50
-Paragraph 5
-Publisher FASB
-URI https://asc.fasb.org//1943274/2147479806/606-10-50-5
Reference 3: http://www.xbrl.org/2003/role/disclosureRef
-Topic 280
-SubTopic 10
-Name Accounting Standards Codification
-Section 50
-Paragraph 30
-Subparagraph (a)
-Publisher FASB
-URI https://asc.fasb.org//1943274/2147482810/280-10-50-30
Reference 4: http://www.xbrl.org/2003/role/disclosureRef
-Topic 280
-SubTopic 10
-Name Accounting Standards Codification
-Section 50
-Paragraph 42
-Publisher FASB
-URI https://asc.fasb.org//1943274/2147482810/280-10-50-42
Reference 5: http://www.xbrl.org/2003/role/disclosureRef
-Topic 280
-SubTopic 10
-Name Accounting Standards Codification
-Section 50
-Paragraph 22
-Subparagraph (b)
-Publisher FASB
-URI https://asc.fasb.org//1943274/2147482810/280-10-50-22
Reference 6: http://www.xbrl.org/2003/role/disclosureRef
-Topic 280
-SubTopic 10
-Name Accounting Standards Codification
-Section 50
-Paragraph 32
-Subparagraph (b)
-Publisher FASB
-URI https://asc.fasb.org//1943274/2147482810/280-10-50-32
Reference 7: http://www.xbrl.org/2003/role/disclosureRef
-Topic 280
-SubTopic 10
-Name Accounting Standards Codification
-Section 50
-Paragraph 40
-Publisher FASB
-URI https://asc.fasb.org//1943274/2147482810/280-10-50-40
Reference 8: http://www.xbrl.org/2003/role/disclosureRef
-Topic 280
-SubTopic 10
-Name Accounting Standards Codification
-Section 50
-Paragraph 22
-Subparagraph (a)
-Publisher FASB
-URI https://asc.fasb.org//1943274/2147482810/280-10-50-22
Reference 9: http://www.xbrl.org/2003/role/disclosureRef
-Topic 280
-SubTopic 10
-Name Accounting Standards Codification
-Section 50
-Paragraph 32
-Subparagraph (a)
-Publisher FASB
-URI https://asc.fasb.org//1943274/2147482810/280-10-50-32
Reference 10: http://www.xbrl.org/2003/role/disclosureRef
-Topic 280
-SubTopic 10
-Name Accounting Standards Codification
-Section 50
-Paragraph 41
-Subparagraph (a)
-Publisher FASB
-URI https://asc.fasb.org//1943274/2147482810/280-10-50-41
Reference 11: http://www.xbrl.org/2003/role/disclosureRef
-Topic 606
-SubTopic 10
-Name Accounting Standards Codification
-Section 50
-Paragraph 4
-Subparagraph (a)
-Publisher FASB
-URI https://asc.fasb.org//1943274/2147479806/606-10-50-4
| Name: |
us-gaap_RevenueFromContractWithCustomerExcludingAssessedTax |
| Namespace Prefix: |
us-gaap_ |
| Data Type: |
xbrli:monetaryItemType |
| Balance Type: |
credit |
| Period Type: |
duration |
|
| X |
- Details
| Name: |
us-gaap_ConcentrationRiskByBenchmarkAxis=us-gaap_SalesRevenueNetMember |
| Namespace Prefix: |
|
| Data Type: |
na |
| Balance Type: |
|
| Period Type: |
|
|
| X |
- Details
| Name: |
us-gaap_ConcentrationRiskByTypeAxis=us-gaap_CustomerConcentrationRiskMember |
| Namespace Prefix: |
|
| Data Type: |
na |
| Balance Type: |
|
| Period Type: |
|
|
| X |
- Details
| Name: |
srt_MajorCustomersAxis=ASFH_CustomerFMember |
| Namespace Prefix: |
|
| Data Type: |
na |
| Balance Type: |
|
| Period Type: |
|
|
| X |
- Details
| Name: |
srt_MajorCustomersAxis=ASFH_CustomerGMember |
| Namespace Prefix: |
|
| Data Type: |
na |
| Balance Type: |
|
| Period Type: |
|
|
| X |
- Details
| Name: |
srt_MajorCustomersAxis=ASFH_OthersMember |
| Namespace Prefix: |
|
| Data Type: |
na |
| Balance Type: |
|
| Period Type: |
|
|
| X |
- Details
| Name: |
us-gaap_ConcentrationRiskByBenchmarkAxis=us-gaap_AccountsReceivableMember |
| Namespace Prefix: |
|
| Data Type: |
na |
| Balance Type: |
|
| Period Type: |
|
|
| X |
- Details
| Name: |
us-gaap_ConcentrationRiskByBenchmarkAxis=us-gaap_CostOfGoodsProductLineMember |
| Namespace Prefix: |
|
| Data Type: |
na |
| Balance Type: |
|
| Period Type: |
|
|
| X |
- Details
| Name: |
us-gaap_ConcentrationRiskByTypeAxis=us-gaap_SupplierConcentrationRiskMember |
| Namespace Prefix: |
|
| Data Type: |
na |
| Balance Type: |
|
| Period Type: |
|
|
| X |
- Details
| Name: |
us-gaap_ShareBasedGoodsAndNonemployeeServicesTransactionBySupplierAxis=ASFH_SupplierAMember |
| Namespace Prefix: |
|
| Data Type: |
na |
| Balance Type: |
|
| Period Type: |
|
|
| X |
- Details
| Name: |
us-gaap_ShareBasedGoodsAndNonemployeeServicesTransactionBySupplierAxis=ASFH_SupplierBMember |
| Namespace Prefix: |
|
| Data Type: |
na |
| Balance Type: |
|
| Period Type: |
|
|
| X |
- Details
| Name: |
us-gaap_ShareBasedGoodsAndNonemployeeServicesTransactionBySupplierAxis=ASFH_OthersMember |
| Namespace Prefix: |
|
| Data Type: |
na |
| Balance Type: |
|
| Period Type: |
|
|
| X |
- Details
| Name: |
us-gaap_ConcentrationRiskByBenchmarkAxis=us-gaap_AccountsPayableMember |
| Namespace Prefix: |
|
| Data Type: |
na |
| Balance Type: |
|
| Period Type: |
|
|
v3.23.3
| X |
- DefinitionThe aggregate cost of goods produced and sold and services rendered during the reporting period. Reference 1: http://www.xbrl.org/2003/role/disclosureRef
-Topic 235
-SubTopic 10
-Name Accounting Standards Codification
-Section S99
-Paragraph 1
-Subparagraph (SX 210.4-08(g)(1)(ii))
-Publisher FASB
-URI https://asc.fasb.org//1943274/2147480678/235-10-S99-1
Reference 2: http://www.xbrl.org/2003/role/disclosureRef
-Topic 323
-SubTopic 10
-Name Accounting Standards Codification
-Section 50
-Paragraph 3
-Subparagraph (c)
-Publisher FASB
-URI https://asc.fasb.org//1943274/2147481687/323-10-50-3
Reference 3: http://www.xbrl.org/2003/role/disclosureRef
-Topic 825
-SubTopic 10
-Name Accounting Standards Codification
-Section 50
-Paragraph 28
-Subparagraph (f)
-Publisher FASB
-URI https://asc.fasb.org//1943274/2147482907/825-10-50-28
Reference 4: http://www.xbrl.org/2003/role/disclosureRef
-Topic 470
-SubTopic 10
-Name Accounting Standards Codification
-Section S99
-Paragraph 1A
-Subparagraph (SX 210.13-01(a)(4)(i))
-Publisher FASB
-URI https://asc.fasb.org//1943274/2147480097/470-10-S99-1A
Reference 5: http://www.xbrl.org/2009/role/commonPracticeRef
-Topic 470
-SubTopic 10
-Name Accounting Standards Codification
-Section S99
-Paragraph 1A
-Subparagraph (SX 210.13-01(a)(4)(ii))
-Publisher FASB
-URI https://asc.fasb.org//1943274/2147480097/470-10-S99-1A
Reference 6: http://www.xbrl.org/2003/role/disclosureRef
-Topic 470
-SubTopic 10
-Name Accounting Standards Codification
-Section S99
-Paragraph 1A
-Subparagraph (SX 210.13-01(a)(4)(iii)(A))
-Publisher FASB
-URI https://asc.fasb.org//1943274/2147480097/470-10-S99-1A
Reference 7: http://www.xbrl.org/2003/role/disclosureRef
-Topic 470
-SubTopic 10
-Name Accounting Standards Codification
-Section S99
-Paragraph 1A
-Subparagraph (SX 210.13-01(a)(4)(iv))
-Publisher FASB
-URI https://asc.fasb.org//1943274/2147480097/470-10-S99-1A
Reference 8: http://www.xbrl.org/2003/role/disclosureRef
-Topic 470
-SubTopic 10
-Name Accounting Standards Codification
-Section S99
-Paragraph 1A
-Subparagraph (SX 210.13-01(a)(5))
-Publisher FASB
-URI https://asc.fasb.org//1943274/2147480097/470-10-S99-1A
Reference 9: http://www.xbrl.org/2003/role/disclosureRef
-Topic 470
-SubTopic 10
-Name Accounting Standards Codification
-Section S99
-Paragraph 1B
-Subparagraph (SX 210.13-02(a)(4)(i))
-Publisher FASB
-URI https://asc.fasb.org//1943274/2147480097/470-10-S99-1B
Reference 10: http://www.xbrl.org/2003/role/disclosureRef
-Topic 470
-SubTopic 10
-Name Accounting Standards Codification
-Section S99
-Paragraph 1B
-Subparagraph (SX 210.13-02(a)(4)(iii)(A))
-Publisher FASB
-URI https://asc.fasb.org//1943274/2147480097/470-10-S99-1B
Reference 11: http://www.xbrl.org/2003/role/disclosureRef
-Topic 470
-SubTopic 10
-Name Accounting Standards Codification
-Section S99
-Paragraph 1B
-Subparagraph (SX 210.13-02(a)(4)(iii)(B))
-Publisher FASB
-URI https://asc.fasb.org//1943274/2147480097/470-10-S99-1B
Reference 12: http://www.xbrl.org/2003/role/disclosureRef
-Topic 470
-SubTopic 10
-Name Accounting Standards Codification
-Section S99
-Paragraph 1B
-Subparagraph (SX 210.13-02(a)(4)(iv))
-Publisher FASB
-URI https://asc.fasb.org//1943274/2147480097/470-10-S99-1B
Reference 13: http://www.xbrl.org/2003/role/disclosureRef
-Topic 470
-SubTopic 10
-Name Accounting Standards Codification
-Section S99
-Paragraph 1B
-Subparagraph (SX 210.13-02(a)(5))
-Publisher FASB
-URI https://asc.fasb.org//1943274/2147480097/470-10-S99-1B
Reference 14: http://fasb.org/us-gaap/role/ref/legacyRef
-Topic 220
-SubTopic 10
-Name Accounting Standards Codification
-Section S99
-Paragraph 2
-Subparagraph (SX 210.5-03.2)
-Publisher FASB
-URI https://asc.fasb.org//1943274/2147483621/220-10-S99-2
| Name: |
us-gaap_CostOfRevenue |
| Namespace Prefix: |
us-gaap_ |
| Data Type: |
xbrli:monetaryItemType |
| Balance Type: |
debit |
| Period Type: |
duration |
|
| X |
- DefinitionAmount, excluding tax collected from customer, of revenue from satisfaction of performance obligation by transferring promised good or service to customer. Tax collected from customer is tax assessed by governmental authority that is both imposed on and concurrent with specific revenue-producing transaction, including, but not limited to, sales, use, value added and excise. Reference 1: http://www.xbrl.org/2003/role/disclosureRef
-Topic 924
-SubTopic 10
-Name Accounting Standards Codification
-Section S99
-Paragraph 1
-Subparagraph (SAB Topic 11.L)
-Publisher FASB
-URI https://asc.fasb.org//1943274/2147479941/924-10-S99-1
Reference 2: http://www.xbrl.org/2003/role/disclosureRef
-Topic 606
-SubTopic 10
-Name Accounting Standards Codification
-Section 50
-Paragraph 5
-Publisher FASB
-URI https://asc.fasb.org//1943274/2147479806/606-10-50-5
Reference 3: http://www.xbrl.org/2003/role/disclosureRef
-Topic 280
-SubTopic 10
-Name Accounting Standards Codification
-Section 50
-Paragraph 30
-Subparagraph (a)
-Publisher FASB
-URI https://asc.fasb.org//1943274/2147482810/280-10-50-30
Reference 4: http://www.xbrl.org/2003/role/disclosureRef
-Topic 280
-SubTopic 10
-Name Accounting Standards Codification
-Section 50
-Paragraph 42
-Publisher FASB
-URI https://asc.fasb.org//1943274/2147482810/280-10-50-42
Reference 5: http://www.xbrl.org/2003/role/disclosureRef
-Topic 280
-SubTopic 10
-Name Accounting Standards Codification
-Section 50
-Paragraph 22
-Subparagraph (b)
-Publisher FASB
-URI https://asc.fasb.org//1943274/2147482810/280-10-50-22
Reference 6: http://www.xbrl.org/2003/role/disclosureRef
-Topic 280
-SubTopic 10
-Name Accounting Standards Codification
-Section 50
-Paragraph 32
-Subparagraph (b)
-Publisher FASB
-URI https://asc.fasb.org//1943274/2147482810/280-10-50-32
Reference 7: http://www.xbrl.org/2003/role/disclosureRef
-Topic 280
-SubTopic 10
-Name Accounting Standards Codification
-Section 50
-Paragraph 40
-Publisher FASB
-URI https://asc.fasb.org//1943274/2147482810/280-10-50-40
Reference 8: http://www.xbrl.org/2003/role/disclosureRef
-Topic 280
-SubTopic 10
-Name Accounting Standards Codification
-Section 50
-Paragraph 22
-Subparagraph (a)
-Publisher FASB
-URI https://asc.fasb.org//1943274/2147482810/280-10-50-22
Reference 9: http://www.xbrl.org/2003/role/disclosureRef
-Topic 280
-SubTopic 10
-Name Accounting Standards Codification
-Section 50
-Paragraph 32
-Subparagraph (a)
-Publisher FASB
-URI https://asc.fasb.org//1943274/2147482810/280-10-50-32
Reference 10: http://www.xbrl.org/2003/role/disclosureRef
-Topic 280
-SubTopic 10
-Name Accounting Standards Codification
-Section 50
-Paragraph 41
-Subparagraph (a)
-Publisher FASB
-URI https://asc.fasb.org//1943274/2147482810/280-10-50-41
Reference 11: http://www.xbrl.org/2003/role/disclosureRef
-Topic 606
-SubTopic 10
-Name Accounting Standards Codification
-Section 50
-Paragraph 4
-Subparagraph (a)
-Publisher FASB
-URI https://asc.fasb.org//1943274/2147479806/606-10-50-4
| Name: |
us-gaap_RevenueFromContractWithCustomerExcludingAssessedTax |
| Namespace Prefix: |
us-gaap_ |
| Data Type: |
xbrli:monetaryItemType |
| Balance Type: |
credit |
| Period Type: |
duration |
|
| X |
- References
+ Details
| Name: |
us-gaap_RisksAndUncertaintiesAbstract |
| Namespace Prefix: |
us-gaap_ |
| Data Type: |
xbrli:stringItemType |
| Balance Type: |
na |
| Period Type: |
duration |
|
v3.23.3
SCHEDULE OF PROVISION FOR INCOME TAXES (Details) - USD ($)
|
3 Months Ended |
9 Months Ended |
Sep. 30, 2023 |
Sep. 30, 2022 |
Sep. 30, 2023 |
Sep. 30, 2022 |
| Income before income taxes |
$ (74,281)
|
$ (9,983)
|
$ (447,910)
|
$ (54,415)
|
| Local |
|
|
|
|
| Foreign |
|
|
(29,409)
|
(1,137)
|
| - Local |
|
|
|
|
| - Foreign |
819
|
|
819
|
|
| - Local |
|
|
|
|
| - Foreign |
12,824
|
|
12,824
|
|
| - Local |
|
|
|
|
| - Foreign |
3,357
|
|
3,357
|
|
| - Local |
|
|
|
|
| - Foreign |
$ 243,227
|
|
243,227
|
|
| UNITED STATES |
|
|
|
|
| Income before income taxes |
|
|
(179,247)
|
(35,414)
|
| HONG KONG |
|
|
|
|
| Income before income taxes |
|
|
(33,212)
|
(22,736)
|
| British Virginia Island [Member] |
|
|
|
|
| Income before income taxes |
|
|
(300)
|
|
| Labuan [Member] |
|
|
|
|
| Income before income taxes |
|
|
(34,479)
|
3,735
|
| MALAYSIA |
|
|
|
|
| Income before income taxes |
|
|
$ (200,672)
|
|
| X |
- DefinitionDeferred tax liabilities operating loss carryforwards foreign.
| Name: |
ASFH_DeferredTaxLiabilitiesOperatingLossCarryforwardsForeign |
| Namespace Prefix: |
ASFH_ |
| Data Type: |
xbrli:monetaryItemType |
| Balance Type: |
debit |
| Period Type: |
instant |
|
| X |
- DefinitionDeferred tax liabilities operating loss carry forwards state and local.
| Name: |
ASFH_DeferredTaxLiabilitiesOperatingLossCarryforwardsStateAndLocal |
| Namespace Prefix: |
ASFH_ |
| Data Type: |
xbrli:monetaryItemType |
| Balance Type: |
debit |
| Period Type: |
instant |
|
| X |
- DefinitionAmount of current foreign income tax expense (benefit) pertaining to income (loss) from continuing operations. Reference 1: http://www.xbrl.org/2009/role/commonPracticeRef
-Topic 235
-SubTopic 10
-Name Accounting Standards Codification
-Section S99
-Paragraph 1
-Subparagraph (SX 210.4-08(h)(1)(Note 1))
-Publisher FASB
-URI https://asc.fasb.org//1943274/2147480678/235-10-S99-1
Reference 2: http://www.xbrl.org/2009/role/commonPracticeRef
-Name Accounting Standards Codification
-Section 50
-Paragraph 9
-Subparagraph (a)
-SubTopic 10
-Topic 740
-Publisher FASB
-URI https://asc.fasb.org//1943274/2147482685/740-10-50-9
| Name: |
us-gaap_CurrentForeignTaxExpenseBenefit |
| Namespace Prefix: |
us-gaap_ |
| Data Type: |
xbrli:monetaryItemType |
| Balance Type: |
debit |
| Period Type: |
duration |
|
| X |
- DefinitionAmount of current state and local tax expense (benefit) attributable to income (loss) from continuing operations. Includes, but is not limited to, current regional, territorial, and provincial tax expense (benefit) for non-US (United States of America) jurisdiction. Reference 1: http://www.xbrl.org/2009/role/commonPracticeRef
-Topic 235
-SubTopic 10
-Name Accounting Standards Codification
-Section S99
-Paragraph 1
-Subparagraph (SX 210.4-08(h)(1)(Note 1))
-Publisher FASB
-URI https://asc.fasb.org//1943274/2147480678/235-10-S99-1
Reference 2: http://www.xbrl.org/2009/role/commonPracticeRef
-Name Accounting Standards Codification
-Section 50
-Paragraph 9
-Subparagraph (a)
-SubTopic 10
-Topic 740
-Publisher FASB
-URI https://asc.fasb.org//1943274/2147482685/740-10-50-9
Reference 3: http://www.xbrl.org/2009/role/commonPracticeRef
-Topic 740
-SubTopic 10
-Name Accounting Standards Codification
-Section S99
-Paragraph 1
-Subparagraph (SAB Topic 6.I.7)
-Publisher FASB
-URI https://asc.fasb.org//1943274/2147479360/740-10-S99-1
| Name: |
us-gaap_CurrentStateAndLocalTaxExpenseBenefit |
| Namespace Prefix: |
us-gaap_ |
| Data Type: |
xbrli:monetaryItemType |
| Balance Type: |
debit |
| Period Type: |
duration |
|
| X |
- DefinitionAmount before allocation of valuation allowances of deferred tax asset attributable to deductible foreign operating loss carryforwards. Reference 1: http://www.xbrl.org/2009/role/commonPracticeRef
-Topic 740
-SubTopic 10
-Name Accounting Standards Codification
-Section 50
-Paragraph 6
-Publisher FASB
-URI https://asc.fasb.org//1943274/2147482685/740-10-50-6
Reference 2: http://fasb.org/us-gaap/role/ref/legacyRef
-Name Accounting Standards Codification
-Topic 740
-SubTopic 10
-Section 50
-Paragraph 8
-Publisher FASB
-URI https://asc.fasb.org//1943274/2147482685/740-10-50-8
| Name: |
us-gaap_DeferredTaxAssetsOperatingLossCarryforwardsForeign |
| Namespace Prefix: |
us-gaap_ |
| Data Type: |
xbrli:monetaryItemType |
| Balance Type: |
debit |
| Period Type: |
instant |
|
| X |
- DefinitionAmount before allocation of valuation allowances of deferred tax asset attributable to deductible state and local operating loss carryforwards. Reference 1: http://www.xbrl.org/2009/role/commonPracticeRef
-Topic 740
-SubTopic 10
-Name Accounting Standards Codification
-Section 50
-Paragraph 6
-Publisher FASB
-URI https://asc.fasb.org//1943274/2147482685/740-10-50-6
Reference 2: http://fasb.org/us-gaap/role/ref/legacyRef
-Name Accounting Standards Codification
-Topic 740
-SubTopic 10
-Section 50
-Paragraph 8
-Publisher FASB
-URI https://asc.fasb.org//1943274/2147482685/740-10-50-8
| Name: |
us-gaap_DeferredTaxAssetsOperatingLossCarryforwardsStateAndLocal |
| Namespace Prefix: |
us-gaap_ |
| Data Type: |
xbrli:monetaryItemType |
| Balance Type: |
debit |
| Period Type: |
instant |
|
| X |
- Details
| Name: |
srt_StatementGeographicalAxis=country_US |
| Namespace Prefix: |
|
| Data Type: |
na |
| Balance Type: |
|
| Period Type: |
|
|
| X |
- Details
| Name: |
srt_StatementGeographicalAxis=country_HK |
| Namespace Prefix: |
|
| Data Type: |
na |
| Balance Type: |
|
| Period Type: |
|
|
| X |
- Details
| Name: |
srt_StatementGeographicalAxis=ASFH_BritishVirginiaIslandMember |
| Namespace Prefix: |
|
| Data Type: |
na |
| Balance Type: |
|
| Period Type: |
|
|
| X |
- Details
| Name: |
srt_StatementGeographicalAxis=ASFH_LabuanMember |
| Namespace Prefix: |
|
| Data Type: |
na |
| Balance Type: |
|
| Period Type: |
|
|
| X |
- Details
| Name: |
srt_StatementGeographicalAxis=country_MY |
| Namespace Prefix: |
|
| Data Type: |
na |
| Balance Type: |
|
| Period Type: |
|
|
v3.23.3
| X |
- DefinitionTaxable profit remaining balance tax rate.
| Name: |
ASFH_TaxableProfitRemainingBalanceTaxRate |
| Namespace Prefix: |
ASFH_ |
| Data Type: |
dtr-types:percentItemType |
| Balance Type: |
na |
| Period Type: |
duration |
|
| X |
- DefinitionAmount of other income tax expense (benefit). Reference 1: http://www.xbrl.org/2003/role/disclosureRef
-Topic 235
-SubTopic 10
-Name Accounting Standards Codification
-Section S99
-Paragraph 1
-Subparagraph (SX 210.4-08(h)(1)(Note 1))
-Publisher FASB
-URI https://asc.fasb.org//1943274/2147480678/235-10-S99-1
Reference 2: http://www.xbrl.org/2009/role/commonPracticeRef
-Topic 740
-SubTopic 10
-Name Accounting Standards Codification
-Section 50
-Paragraph 10
-Publisher FASB
-URI https://asc.fasb.org//1943274/2147482685/740-10-50-10
Reference 3: http://www.xbrl.org/2009/role/commonPracticeRef
-Topic 740
-SubTopic 10
-Name Accounting Standards Codification
-Section 50
-Paragraph 9
-Publisher FASB
-URI https://asc.fasb.org//1943274/2147482685/740-10-50-9
| Name: |
us-gaap_OtherTaxExpenseBenefit |
| Namespace Prefix: |
us-gaap_ |
| Data Type: |
xbrli:monetaryItemType |
| Balance Type: |
debit |
| Period Type: |
duration |
|
v3.23.3
DIVIDEND (Details Narrative) - 12 months ended Dec. 31, 2022
|
USD ($) |
MYR (RM) |
| Mr Wong Kai Cheong And Mr Hoo Swee Ping [Member] |
|
|
| Payments of dividends |
$ 1,314,488
|
RM 5,794,000
|
| Insite MY Innovations Sdn Bhd [Member] |
|
|
| Dividends |
385,680
|
1,700,000
|
| Insite MY Systems Sdn Bhd [Member] |
|
|
| Dividends |
$ 974,182
|
RM 4,294,000
|
| X |
- DefinitionAmount of paid and unpaid cash, stock, and paid-in-kind (PIK) dividends declared, for example, but not limited to, common and preferred stock. Reference 1: http://fasb.org/us-gaap/role/ref/legacyRef
-Topic 505
-SubTopic 10
-Name Accounting Standards Codification
-Section S99
-Paragraph 1
-Subparagraph (SX 210.3-04)
-Publisher FASB
-URI https://asc.fasb.org//1943274/2147480008/505-10-S99-1
Reference 2: http://fasb.org/us-gaap/role/ref/legacyRef
-Name Accounting Standards Codification
-Section 45
-Paragraph 2
-SubTopic 405
-Topic 942
-Publisher FASB
-URI https://asc.fasb.org//1943274/2147481071/942-405-45-2
| Name: |
us-gaap_Dividends |
| Namespace Prefix: |
us-gaap_ |
| Data Type: |
xbrli:monetaryItemType |
| Balance Type: |
debit |
| Period Type: |
duration |
|
| X |
- DefinitionCash outflow in the form of capital distributions and dividends to common shareholders, preferred shareholders and noncontrolling interests. Reference 1: http://fasb.org/us-gaap/role/ref/legacyRef
-Name Accounting Standards Codification
-Topic 230
-SubTopic 10
-Section 45
-Paragraph 15
-Subparagraph (a)
-Publisher FASB
-URI https://asc.fasb.org//1943274/2147482740/230-10-45-15
| Name: |
us-gaap_PaymentsOfDividends |
| Namespace Prefix: |
us-gaap_ |
| Data Type: |
xbrli:monetaryItemType |
| Balance Type: |
credit |
| Period Type: |
duration |
|
| X |
- Details
| Name: |
srt_TitleOfIndividualAxis=ASFH_MrWongKaiCheongAndMrHooSweePingMember |
| Namespace Prefix: |
|
| Data Type: |
na |
| Balance Type: |
|
| Period Type: |
|
|
| X |
- Details
| Name: |
dei_LegalEntityAxis=ASFH_InsiteMYInnovationsSdnBhdMember |
| Namespace Prefix: |
|
| Data Type: |
na |
| Balance Type: |
|
| Period Type: |
|
|
| X |
- Details
| Name: |
dei_LegalEntityAxis=ASFH_InsiteMYSystemsSdnBhdMember |
| Namespace Prefix: |
|
| Data Type: |
na |
| Balance Type: |
|
| Period Type: |
|
|
v3.23.3
SCHEDULE OF SEGMENT REPORTING (Details) - USD ($)
|
3 Months Ended |
9 Months Ended |
|
Sep. 30, 2023 |
Sep. 30, 2022 |
Sep. 30, 2023 |
Sep. 30, 2022 |
Dec. 31, 2022 |
| Segment Reporting Information [Line Items] |
|
|
|
|
|
| Revenue |
$ 695,145
|
|
$ 1,813,426
|
|
|
| Cost of revenue |
(33,524)
|
|
(147,924)
|
|
|
| Gross profit |
661,621
|
|
1,665,502
|
|
|
| Selling, general and administrative expenses and other income |
(737,279)
|
(12,629)
|
(2,122,375)
|
(63,576)
|
|
| Loss from operations |
(75,658)
|
(12,629)
|
(456,873)
|
(63,576)
|
|
| Total assets |
2,695,731
|
919,874
|
2,695,731
|
919,874
|
$ 877,690
|
| Capital expenditure |
|
|
30,320
|
|
|
| MALAYSIA |
|
|
|
|
|
| Segment Reporting Information [Line Items] |
|
|
|
|
|
| Revenue |
|
|
1,813,426
|
|
|
| Cost of revenue |
|
|
(147,924)
|
|
|
| Gross profit |
|
|
1,665,502
|
|
|
| Selling, general and administrative expenses and other income |
|
|
(1,927,468)
|
|
|
| Loss from operations |
|
|
(261,966)
|
|
|
| Total assets |
2,658,020
|
|
2,658,020
|
|
|
| Capital expenditure |
|
|
30,320
|
|
|
| Non Malaysia [Member] |
|
|
|
|
|
| Segment Reporting Information [Line Items] |
|
|
|
|
|
| Revenue |
|
|
|
|
|
| Cost of revenue |
|
|
|
|
|
| Gross profit |
|
|
|
|
|
| Selling, general and administrative expenses and other income |
|
|
(194,907)
|
(63,576)
|
|
| Loss from operations |
|
|
(194,907)
|
(63,576)
|
|
| Total assets |
37,711
|
919,874
|
37,711
|
919,874
|
|
| Capital expenditure |
|
|
|
|
|
| Information Technology Business [Member] |
|
|
|
|
|
| Segment Reporting Information [Line Items] |
|
|
|
|
|
| Revenue |
|
|
1,813,426
|
|
|
| Cost of revenue |
|
|
(147,924)
|
|
|
| Gross profit |
|
|
1,665,502
|
|
|
| Selling, general and administrative expenses and other income |
|
|
(2,122,375)
|
(63,576)
|
|
| Loss from operations |
|
|
(456,873)
|
(63,576)
|
|
| Total assets |
$ 2,695,731
|
$ 919,874
|
2,695,731
|
919,874
|
|
| Capital expenditure |
|
|
$ 30,320
|
|
|
| X |
- DefinitionSum of the carrying amounts as of the balance sheet date of all assets that are recognized. Assets are probable future economic benefits obtained or controlled by an entity as a result of past transactions or events. Reference 1: http://www.xbrl.org/2003/role/disclosureRef
-Topic 810
-SubTopic 10
-Name Accounting Standards Codification
-Section 50
-Paragraph 3
-Subparagraph (bb)
-Publisher FASB
-URI https://asc.fasb.org//1943274/2147481203/810-10-50-3
Reference 2: http://www.xbrl.org/2003/role/disclosureRef
-Topic 810
-SubTopic 10
-Name Accounting Standards Codification
-Section 45
-Paragraph 25
-Subparagraph (a)
-Publisher FASB
-URI https://asc.fasb.org//1943274/2147481231/810-10-45-25
Reference 3: http://www.xbrl.org/2003/role/disclosureRef
-Topic 235
-SubTopic 10
-Name Accounting Standards Codification
-Section S99
-Paragraph 1
-Subparagraph (SX 210.4-08(g)(1)(ii))
-Publisher FASB
-URI https://asc.fasb.org//1943274/2147480678/235-10-S99-1
Reference 4: http://www.xbrl.org/2003/role/disclosureRef
-Topic 323
-SubTopic 10
-Name Accounting Standards Codification
-Section 50
-Paragraph 3
-Subparagraph (c)
-Publisher FASB
-URI https://asc.fasb.org//1943274/2147481687/323-10-50-3
Reference 5: http://www.xbrl.org/2003/role/disclosureRef
-Topic 825
-SubTopic 10
-Name Accounting Standards Codification
-Section 50
-Paragraph 28
-Subparagraph (f)
-Publisher FASB
-URI https://asc.fasb.org//1943274/2147482907/825-10-50-28
Reference 6: http://www.xbrl.org/2003/role/exampleRef
-Topic 852
-SubTopic 10
-Name Accounting Standards Codification
-Section 55
-Paragraph 10
-Publisher FASB
-URI https://asc.fasb.org//1943274/2147481372/852-10-55-10
Reference 7: http://www.xbrl.org/2003/role/exampleRef
-Topic 946
-SubTopic 830
-Name Accounting Standards Codification
-Section 55
-Paragraph 12
-Publisher FASB
-URI https://asc.fasb.org//1943274/2147480167/946-830-55-12
Reference 8: http://www.xbrl.org/2003/role/disclosureRef
-Topic 944
-SubTopic 210
-Name Accounting Standards Codification
-Section S99
-Paragraph 1
-Subparagraph (SX 210.7-03(a)(12))
-Publisher FASB
-URI https://asc.fasb.org//1943274/2147479440/944-210-S99-1
Reference 9: http://www.xbrl.org/2003/role/disclosureRef
-Topic 280
-SubTopic 10
-Name Accounting Standards Codification
-Section 50
-Paragraph 22
-Publisher FASB
-URI https://asc.fasb.org//1943274/2147482810/280-10-50-22
Reference 10: http://www.xbrl.org/2003/role/disclosureRef
-Topic 946
-SubTopic 210
-Name Accounting Standards Codification
-Section S99
-Paragraph 1
-Subparagraph (SX 210.6-04(8))
-Publisher FASB
-URI https://asc.fasb.org//1943274/2147479617/946-210-S99-1
Reference 11: http://www.xbrl.org/2003/role/disclosureRef
-Topic 210
-SubTopic 10
-Name Accounting Standards Codification
-Section S99
-Paragraph 1
-Subparagraph (SX 210.5-02(18))
-Publisher FASB
-URI https://asc.fasb.org//1943274/2147480566/210-10-S99-1
Reference 12: http://www.xbrl.org/2003/role/disclosureRef
-Topic 470
-SubTopic 10
-Name Accounting Standards Codification
-Section S99
-Paragraph 1A
-Subparagraph (SX 210.13-01(a)(4)(i))
-Publisher FASB
-URI https://asc.fasb.org//1943274/2147480097/470-10-S99-1A
Reference 13: http://www.xbrl.org/2009/role/commonPracticeRef
-Topic 470
-SubTopic 10
-Name Accounting Standards Codification
-Section S99
-Paragraph 1A
-Subparagraph (SX 210.13-01(a)(4)(ii))
-Publisher FASB
-URI https://asc.fasb.org//1943274/2147480097/470-10-S99-1A
Reference 14: http://www.xbrl.org/2009/role/commonPracticeRef
-Topic 470
-SubTopic 10
-Name Accounting Standards Codification
-Section S99
-Paragraph 1A
-Subparagraph (SX 210.13-01(a)(4)(iii))
-Publisher FASB
-URI https://asc.fasb.org//1943274/2147480097/470-10-S99-1A
Reference 15: http://www.xbrl.org/2003/role/disclosureRef
-Topic 470
-SubTopic 10
-Name Accounting Standards Codification
-Section S99
-Paragraph 1A
-Subparagraph (SX 210.13-01(a)(4)(iii)(A))
-Publisher FASB
-URI https://asc.fasb.org//1943274/2147480097/470-10-S99-1A
Reference 16: http://www.xbrl.org/2003/role/disclosureRef
-Topic 470
-SubTopic 10
-Name Accounting Standards Codification
-Section S99
-Paragraph 1A
-Subparagraph (SX 210.13-01(a)(4)(iv))
-Publisher FASB
-URI https://asc.fasb.org//1943274/2147480097/470-10-S99-1A
Reference 17: http://www.xbrl.org/2003/role/disclosureRef
-Topic 470
-SubTopic 10
-Name Accounting Standards Codification
-Section S99
-Paragraph 1A
-Subparagraph (SX 210.13-01(a)(5))
-Publisher FASB
-URI https://asc.fasb.org//1943274/2147480097/470-10-S99-1A
Reference 18: http://www.xbrl.org/2003/role/disclosureRef
-Topic 470
-SubTopic 10
-Name Accounting Standards Codification
-Section S99
-Paragraph 1B
-Subparagraph (SX 210.13-02(a)(4)(i))
-Publisher FASB
-URI https://asc.fasb.org//1943274/2147480097/470-10-S99-1B
Reference 19: http://www.xbrl.org/2003/role/disclosureRef
-Topic 470
-SubTopic 10
-Name Accounting Standards Codification
-Section S99
-Paragraph 1B
-Subparagraph (SX 210.13-02(a)(4)(iii)(A))
-Publisher FASB
-URI https://asc.fasb.org//1943274/2147480097/470-10-S99-1B
Reference 20: http://www.xbrl.org/2003/role/disclosureRef
-Topic 470
-SubTopic 10
-Name Accounting Standards Codification
-Section S99
-Paragraph 1B
-Subparagraph (SX 210.13-02(a)(4)(iii)(B))
-Publisher FASB
-URI https://asc.fasb.org//1943274/2147480097/470-10-S99-1B
Reference 21: http://www.xbrl.org/2003/role/disclosureRef
-Topic 470
-SubTopic 10
-Name Accounting Standards Codification
-Section S99
-Paragraph 1B
-Subparagraph (SX 210.13-02(a)(4)(iv))
-Publisher FASB
-URI https://asc.fasb.org//1943274/2147480097/470-10-S99-1B
Reference 22: http://www.xbrl.org/2003/role/disclosureRef
-Topic 470
-SubTopic 10
-Name Accounting Standards Codification
-Section S99
-Paragraph 1B
-Subparagraph (SX 210.13-02(a)(5))
-Publisher FASB
-URI https://asc.fasb.org//1943274/2147480097/470-10-S99-1B
Reference 23: http://www.xbrl.org/2009/role/commonPracticeRef
-Topic 852
-SubTopic 10
-Name Accounting Standards Codification
-Section 50
-Paragraph 7
-Subparagraph (a)
-Publisher FASB
-URI https://asc.fasb.org//1943274/2147481404/852-10-50-7
Reference 24: http://www.xbrl.org/2003/role/disclosureRef
-Topic 280
-SubTopic 10
-Name Accounting Standards Codification
-Section 50
-Paragraph 30
-Subparagraph (c)
-Publisher FASB
-URI https://asc.fasb.org//1943274/2147482810/280-10-50-30
Reference 25: http://www.xbrl.org/2003/role/disclosureRef
-Topic 280
-SubTopic 10
-Name Accounting Standards Codification
-Section 50
-Paragraph 32
-Subparagraph (d)
-Publisher FASB
-URI https://asc.fasb.org//1943274/2147482810/280-10-50-32
Reference 26: http://fasb.org/us-gaap/role/ref/legacyRef
-Topic 942
-SubTopic 210
-Name Accounting Standards Codification
-Section S99
-Paragraph 1
-Subparagraph (SX 210.9-03(11))
-Publisher FASB
-URI https://asc.fasb.org//1943274/2147479853/942-210-S99-1
| Name: |
us-gaap_Assets |
| Namespace Prefix: |
us-gaap_ |
| Data Type: |
xbrli:monetaryItemType |
| Balance Type: |
debit |
| Period Type: |
instant |
|
| X |
- DefinitionThe aggregate cost of goods produced and sold and services rendered during the reporting period. Reference 1: http://www.xbrl.org/2003/role/disclosureRef
-Topic 235
-SubTopic 10
-Name Accounting Standards Codification
-Section S99
-Paragraph 1
-Subparagraph (SX 210.4-08(g)(1)(ii))
-Publisher FASB
-URI https://asc.fasb.org//1943274/2147480678/235-10-S99-1
Reference 2: http://www.xbrl.org/2003/role/disclosureRef
-Topic 323
-SubTopic 10
-Name Accounting Standards Codification
-Section 50
-Paragraph 3
-Subparagraph (c)
-Publisher FASB
-URI https://asc.fasb.org//1943274/2147481687/323-10-50-3
Reference 3: http://www.xbrl.org/2003/role/disclosureRef
-Topic 825
-SubTopic 10
-Name Accounting Standards Codification
-Section 50
-Paragraph 28
-Subparagraph (f)
-Publisher FASB
-URI https://asc.fasb.org//1943274/2147482907/825-10-50-28
Reference 4: http://www.xbrl.org/2003/role/disclosureRef
-Topic 470
-SubTopic 10
-Name Accounting Standards Codification
-Section S99
-Paragraph 1A
-Subparagraph (SX 210.13-01(a)(4)(i))
-Publisher FASB
-URI https://asc.fasb.org//1943274/2147480097/470-10-S99-1A
Reference 5: http://www.xbrl.org/2009/role/commonPracticeRef
-Topic 470
-SubTopic 10
-Name Accounting Standards Codification
-Section S99
-Paragraph 1A
-Subparagraph (SX 210.13-01(a)(4)(ii))
-Publisher FASB
-URI https://asc.fasb.org//1943274/2147480097/470-10-S99-1A
Reference 6: http://www.xbrl.org/2003/role/disclosureRef
-Topic 470
-SubTopic 10
-Name Accounting Standards Codification
-Section S99
-Paragraph 1A
-Subparagraph (SX 210.13-01(a)(4)(iii)(A))
-Publisher FASB
-URI https://asc.fasb.org//1943274/2147480097/470-10-S99-1A
Reference 7: http://www.xbrl.org/2003/role/disclosureRef
-Topic 470
-SubTopic 10
-Name Accounting Standards Codification
-Section S99
-Paragraph 1A
-Subparagraph (SX 210.13-01(a)(4)(iv))
-Publisher FASB
-URI https://asc.fasb.org//1943274/2147480097/470-10-S99-1A
Reference 8: http://www.xbrl.org/2003/role/disclosureRef
-Topic 470
-SubTopic 10
-Name Accounting Standards Codification
-Section S99
-Paragraph 1A
-Subparagraph (SX 210.13-01(a)(5))
-Publisher FASB
-URI https://asc.fasb.org//1943274/2147480097/470-10-S99-1A
Reference 9: http://www.xbrl.org/2003/role/disclosureRef
-Topic 470
-SubTopic 10
-Name Accounting Standards Codification
-Section S99
-Paragraph 1B
-Subparagraph (SX 210.13-02(a)(4)(i))
-Publisher FASB
-URI https://asc.fasb.org//1943274/2147480097/470-10-S99-1B
Reference 10: http://www.xbrl.org/2003/role/disclosureRef
-Topic 470
-SubTopic 10
-Name Accounting Standards Codification
-Section S99
-Paragraph 1B
-Subparagraph (SX 210.13-02(a)(4)(iii)(A))
-Publisher FASB
-URI https://asc.fasb.org//1943274/2147480097/470-10-S99-1B
Reference 11: http://www.xbrl.org/2003/role/disclosureRef
-Topic 470
-SubTopic 10
-Name Accounting Standards Codification
-Section S99
-Paragraph 1B
-Subparagraph (SX 210.13-02(a)(4)(iii)(B))
-Publisher FASB
-URI https://asc.fasb.org//1943274/2147480097/470-10-S99-1B
Reference 12: http://www.xbrl.org/2003/role/disclosureRef
-Topic 470
-SubTopic 10
-Name Accounting Standards Codification
-Section S99
-Paragraph 1B
-Subparagraph (SX 210.13-02(a)(4)(iv))
-Publisher FASB
-URI https://asc.fasb.org//1943274/2147480097/470-10-S99-1B
Reference 13: http://www.xbrl.org/2003/role/disclosureRef
-Topic 470
-SubTopic 10
-Name Accounting Standards Codification
-Section S99
-Paragraph 1B
-Subparagraph (SX 210.13-02(a)(5))
-Publisher FASB
-URI https://asc.fasb.org//1943274/2147480097/470-10-S99-1B
Reference 14: http://fasb.org/us-gaap/role/ref/legacyRef
-Topic 220
-SubTopic 10
-Name Accounting Standards Codification
-Section S99
-Paragraph 2
-Subparagraph (SX 210.5-03.2)
-Publisher FASB
-URI https://asc.fasb.org//1943274/2147483621/220-10-S99-2
| Name: |
us-gaap_CostOfRevenue |
| Namespace Prefix: |
us-gaap_ |
| Data Type: |
xbrli:monetaryItemType |
| Balance Type: |
debit |
| Period Type: |
duration |
|
| X |
- DefinitionAggregate revenue less cost of goods and services sold or operating expenses directly attributable to the revenue generation activity. Reference 1: http://www.xbrl.org/2003/role/disclosureRef
-Topic 235
-SubTopic 10
-Name Accounting Standards Codification
-Section S99
-Paragraph 1
-Subparagraph (SX 210.4-08(g)(1)(ii))
-Publisher FASB
-URI https://asc.fasb.org//1943274/2147480678/235-10-S99-1
Reference 2: http://www.xbrl.org/2003/role/disclosureRef
-Topic 323
-SubTopic 10
-Name Accounting Standards Codification
-Section 50
-Paragraph 3
-Subparagraph (c)
-Publisher FASB
-URI https://asc.fasb.org//1943274/2147481687/323-10-50-3
Reference 3: http://www.xbrl.org/2003/role/disclosureRef
-Topic 825
-SubTopic 10
-Name Accounting Standards Codification
-Section 50
-Paragraph 28
-Subparagraph (f)
-Publisher FASB
-URI https://asc.fasb.org//1943274/2147482907/825-10-50-28
Reference 4: http://www.xbrl.org/2003/role/disclosureRef
-Topic 280
-SubTopic 10
-Name Accounting Standards Codification
-Section 50
-Paragraph 22
-Publisher FASB
-URI https://asc.fasb.org//1943274/2147482810/280-10-50-22
Reference 5: http://www.xbrl.org/2003/role/disclosureRef
-Topic 470
-SubTopic 10
-Name Accounting Standards Codification
-Section S99
-Paragraph 1A
-Subparagraph (SX 210.13-01(a)(4)(i))
-Publisher FASB
-URI https://asc.fasb.org//1943274/2147480097/470-10-S99-1A
Reference 6: http://www.xbrl.org/2009/role/commonPracticeRef
-Topic 470
-SubTopic 10
-Name Accounting Standards Codification
-Section S99
-Paragraph 1A
-Subparagraph (SX 210.13-01(a)(4)(ii))
-Publisher FASB
-URI https://asc.fasb.org//1943274/2147480097/470-10-S99-1A
Reference 7: http://www.xbrl.org/2003/role/disclosureRef
-Topic 470
-SubTopic 10
-Name Accounting Standards Codification
-Section S99
-Paragraph 1A
-Subparagraph (SX 210.13-01(a)(4)(iii)(A))
-Publisher FASB
-URI https://asc.fasb.org//1943274/2147480097/470-10-S99-1A
Reference 8: http://www.xbrl.org/2003/role/disclosureRef
-Topic 470
-SubTopic 10
-Name Accounting Standards Codification
-Section S99
-Paragraph 1A
-Subparagraph (SX 210.13-01(a)(4)(iv))
-Publisher FASB
-URI https://asc.fasb.org//1943274/2147480097/470-10-S99-1A
Reference 9: http://www.xbrl.org/2003/role/disclosureRef
-Topic 470
-SubTopic 10
-Name Accounting Standards Codification
-Section S99
-Paragraph 1A
-Subparagraph (SX 210.13-01(a)(5))
-Publisher FASB
-URI https://asc.fasb.org//1943274/2147480097/470-10-S99-1A
Reference 10: http://www.xbrl.org/2003/role/disclosureRef
-Topic 470
-SubTopic 10
-Name Accounting Standards Codification
-Section S99
-Paragraph 1B
-Subparagraph (SX 210.13-02(a)(4)(i))
-Publisher FASB
-URI https://asc.fasb.org//1943274/2147480097/470-10-S99-1B
Reference 11: http://www.xbrl.org/2003/role/disclosureRef
-Topic 470
-SubTopic 10
-Name Accounting Standards Codification
-Section S99
-Paragraph 1B
-Subparagraph (SX 210.13-02(a)(4)(iii)(A))
-Publisher FASB
-URI https://asc.fasb.org//1943274/2147480097/470-10-S99-1B
Reference 12: http://www.xbrl.org/2003/role/disclosureRef
-Topic 470
-SubTopic 10
-Name Accounting Standards Codification
-Section S99
-Paragraph 1B
-Subparagraph (SX 210.13-02(a)(4)(iii)(B))
-Publisher FASB
-URI https://asc.fasb.org//1943274/2147480097/470-10-S99-1B
Reference 13: http://www.xbrl.org/2003/role/disclosureRef
-Topic 470
-SubTopic 10
-Name Accounting Standards Codification
-Section S99
-Paragraph 1B
-Subparagraph (SX 210.13-02(a)(4)(iv))
-Publisher FASB
-URI https://asc.fasb.org//1943274/2147480097/470-10-S99-1B
Reference 14: http://www.xbrl.org/2003/role/disclosureRef
-Topic 470
-SubTopic 10
-Name Accounting Standards Codification
-Section S99
-Paragraph 1B
-Subparagraph (SX 210.13-02(a)(5))
-Publisher FASB
-URI https://asc.fasb.org//1943274/2147480097/470-10-S99-1B
Reference 15: http://www.xbrl.org/2003/role/disclosureRef
-Topic 280
-SubTopic 10
-Name Accounting Standards Codification
-Section 50
-Paragraph 30
-Subparagraph (b)
-Publisher FASB
-URI https://asc.fasb.org//1943274/2147482810/280-10-50-30
Reference 16: http://www.xbrl.org/2003/role/disclosureRef
-Topic 280
-SubTopic 10
-Name Accounting Standards Codification
-Section 50
-Paragraph 32
-Subparagraph (f)
-Publisher FASB
-URI https://asc.fasb.org//1943274/2147482810/280-10-50-32
Reference 17: http://www.xbrl.org/2003/role/exampleRef
-Topic 280
-SubTopic 10
-Name Accounting Standards Codification
-Section 50
-Paragraph 31
-Publisher FASB
-URI https://asc.fasb.org//1943274/2147482810/280-10-50-31
Reference 18: http://www.xbrl.org/2003/role/disclosureRef
-Topic 280
-SubTopic 10
-Name Accounting Standards Codification
-Section 50
-Paragraph 32
-Subparagraph (c)
-Publisher FASB
-URI https://asc.fasb.org//1943274/2147482810/280-10-50-32
Reference 19: http://fasb.org/us-gaap/role/ref/legacyRef
-Topic 220
-SubTopic 10
-Name Accounting Standards Codification
-Section S99
-Paragraph 2
-Subparagraph (SX 210.5-03.1,2)
-Publisher FASB
-URI https://asc.fasb.org//1943274/2147483621/220-10-S99-2
| Name: |
us-gaap_GrossProfit |
| Namespace Prefix: |
us-gaap_ |
| Data Type: |
xbrli:monetaryItemType |
| Balance Type: |
credit |
| Period Type: |
duration |
|
| X |
- DefinitionThe net result for the period of deducting operating expenses from operating revenues. Reference 1: http://www.xbrl.org/2003/role/disclosureRef
-Topic 280
-SubTopic 10
-Name Accounting Standards Codification
-Section 50
-Paragraph 22
-Publisher FASB
-URI https://asc.fasb.org//1943274/2147482810/280-10-50-22
Reference 2: http://www.xbrl.org/2003/role/disclosureRef
-Topic 280
-SubTopic 10
-Name Accounting Standards Codification
-Section 50
-Paragraph 30
-Subparagraph (b)
-Publisher FASB
-URI https://asc.fasb.org//1943274/2147482810/280-10-50-30
Reference 3: http://www.xbrl.org/2003/role/disclosureRef
-Topic 280
-SubTopic 10
-Name Accounting Standards Codification
-Section 50
-Paragraph 32
-Subparagraph (f)
-Publisher FASB
-URI https://asc.fasb.org//1943274/2147482810/280-10-50-32
Reference 4: http://www.xbrl.org/2003/role/exampleRef
-Topic 280
-SubTopic 10
-Name Accounting Standards Codification
-Section 50
-Paragraph 31
-Publisher FASB
-URI https://asc.fasb.org//1943274/2147482810/280-10-50-31
Reference 5: http://www.xbrl.org/2003/role/disclosureRef
-Topic 280
-SubTopic 10
-Name Accounting Standards Codification
-Section 50
-Paragraph 32
-Subparagraph (c)
-Publisher FASB
-URI https://asc.fasb.org//1943274/2147482810/280-10-50-32
| Name: |
us-gaap_OperatingIncomeLoss |
| Namespace Prefix: |
us-gaap_ |
| Data Type: |
xbrli:monetaryItemType |
| Balance Type: |
credit |
| Period Type: |
duration |
|
| X |
- DefinitionAmount, excluding tax collected from customer, of revenue from satisfaction of performance obligation by transferring promised good or service to customer. Tax collected from customer is tax assessed by governmental authority that is both imposed on and concurrent with specific revenue-producing transaction, including, but not limited to, sales, use, value added and excise. Reference 1: http://www.xbrl.org/2003/role/disclosureRef
-Topic 924
-SubTopic 10
-Name Accounting Standards Codification
-Section S99
-Paragraph 1
-Subparagraph (SAB Topic 11.L)
-Publisher FASB
-URI https://asc.fasb.org//1943274/2147479941/924-10-S99-1
Reference 2: http://www.xbrl.org/2003/role/disclosureRef
-Topic 606
-SubTopic 10
-Name Accounting Standards Codification
-Section 50
-Paragraph 5
-Publisher FASB
-URI https://asc.fasb.org//1943274/2147479806/606-10-50-5
Reference 3: http://www.xbrl.org/2003/role/disclosureRef
-Topic 280
-SubTopic 10
-Name Accounting Standards Codification
-Section 50
-Paragraph 30
-Subparagraph (a)
-Publisher FASB
-URI https://asc.fasb.org//1943274/2147482810/280-10-50-30
Reference 4: http://www.xbrl.org/2003/role/disclosureRef
-Topic 280
-SubTopic 10
-Name Accounting Standards Codification
-Section 50
-Paragraph 42
-Publisher FASB
-URI https://asc.fasb.org//1943274/2147482810/280-10-50-42
Reference 5: http://www.xbrl.org/2003/role/disclosureRef
-Topic 280
-SubTopic 10
-Name Accounting Standards Codification
-Section 50
-Paragraph 22
-Subparagraph (b)
-Publisher FASB
-URI https://asc.fasb.org//1943274/2147482810/280-10-50-22
Reference 6: http://www.xbrl.org/2003/role/disclosureRef
-Topic 280
-SubTopic 10
-Name Accounting Standards Codification
-Section 50
-Paragraph 32
-Subparagraph (b)
-Publisher FASB
-URI https://asc.fasb.org//1943274/2147482810/280-10-50-32
Reference 7: http://www.xbrl.org/2003/role/disclosureRef
-Topic 280
-SubTopic 10
-Name Accounting Standards Codification
-Section 50
-Paragraph 40
-Publisher FASB
-URI https://asc.fasb.org//1943274/2147482810/280-10-50-40
Reference 8: http://www.xbrl.org/2003/role/disclosureRef
-Topic 280
-SubTopic 10
-Name Accounting Standards Codification
-Section 50
-Paragraph 22
-Subparagraph (a)
-Publisher FASB
-URI https://asc.fasb.org//1943274/2147482810/280-10-50-22
Reference 9: http://www.xbrl.org/2003/role/disclosureRef
-Topic 280
-SubTopic 10
-Name Accounting Standards Codification
-Section 50
-Paragraph 32
-Subparagraph (a)
-Publisher FASB
-URI https://asc.fasb.org//1943274/2147482810/280-10-50-32
Reference 10: http://www.xbrl.org/2003/role/disclosureRef
-Topic 280
-SubTopic 10
-Name Accounting Standards Codification
-Section 50
-Paragraph 41
-Subparagraph (a)
-Publisher FASB
-URI https://asc.fasb.org//1943274/2147482810/280-10-50-41
Reference 11: http://www.xbrl.org/2003/role/disclosureRef
-Topic 606
-SubTopic 10
-Name Accounting Standards Codification
-Section 50
-Paragraph 4
-Subparagraph (a)
-Publisher FASB
-URI https://asc.fasb.org//1943274/2147479806/606-10-50-4
| Name: |
us-gaap_RevenueFromContractWithCustomerExcludingAssessedTax |
| Namespace Prefix: |
us-gaap_ |
| Data Type: |
xbrli:monetaryItemType |
| Balance Type: |
credit |
| Period Type: |
duration |
|
| X |
- DefinitionAmount of expenditure for addition to long-lived assets included in determination of segment assets by chief operating decision maker (CODM) or otherwise regularly provided to CODM. Excludes expenditure for addition to financial instrument, long-term customer relationship of financial institution, mortgage and other servicing rights, deferred policy acquisition cost, and deferred tax assets. Reference 1: http://www.xbrl.org/2003/role/disclosureRef
-Topic 280
-SubTopic 10
-Name Accounting Standards Codification
-Section 50
-Paragraph 25
-Subparagraph (b)
-Publisher FASB
-URI https://asc.fasb.org//1943274/2147482810/280-10-50-25
Reference 2: http://www.xbrl.org/2003/role/exampleRef
-Topic 280
-SubTopic 10
-Name Accounting Standards Codification
-Section 55
-Paragraph 48
-Publisher FASB
-URI https://asc.fasb.org//1943274/2147482785/280-10-55-48
| Name: |
us-gaap_SegmentExpenditureAdditionToLongLivedAssets |
| Namespace Prefix: |
us-gaap_ |
| Data Type: |
xbrli:monetaryItemType |
| Balance Type: |
debit |
| Period Type: |
duration |
|
| X |
- DefinitionThe aggregate total costs related to selling a firm's product and services, as well as all other general and administrative expenses. Direct selling expenses (for example, credit, warranty, and advertising) are expenses that can be directly linked to the sale of specific products. Indirect selling expenses are expenses that cannot be directly linked to the sale of specific products, for example telephone expenses, Internet, and postal charges. General and administrative expenses include salaries of non-sales personnel, rent, utilities, communication, etc. Reference 1: http://fasb.org/us-gaap/role/ref/legacyRef
-Topic 220
-SubTopic 10
-Name Accounting Standards Codification
-Section S99
-Paragraph 2
-Subparagraph (SX 210.5-03.4)
-Publisher FASB
-URI https://asc.fasb.org//1943274/2147483621/220-10-S99-2
| Name: |
us-gaap_SellingGeneralAndAdministrativeExpense |
| Namespace Prefix: |
us-gaap_ |
| Data Type: |
xbrli:monetaryItemType |
| Balance Type: |
debit |
| Period Type: |
duration |
|
| X |
- Details
| Name: |
srt_StatementGeographicalAxis=country_MY |
| Namespace Prefix: |
|
| Data Type: |
na |
| Balance Type: |
|
| Period Type: |
|
|
| X |
- Details
| Name: |
srt_StatementGeographicalAxis=ASFH_NonMalaysiaMember |
| Namespace Prefix: |
|
| Data Type: |
na |
| Balance Type: |
|
| Period Type: |
|
|
AsiaFIN (QB) (USOTC:ASFH)
Historical Stock Chart
From Apr 2024 to May 2024
 Charts.")
AsiaFIN (QB) (USOTC:ASFH)
Historical Stock Chart
From May 2023 to May 2024
 Charts.")