PORTERVILLE, Calif., April 24 /PRNewswire-FirstCall/ -- Sierra
Bancorp (NASDAQ:BSRR), parent of Bank of the Sierra, today
announced its financial results for the quarter ended March 31,
2006. During the first quarter of 2006, gross loan and lease
balances grew by $54 million, or 7%, surpassing the $45 million
growth in loans and leases for the entire year in 2005. Net income
for the first quarter of 2006 increased 36% to $4.5 million, or
$0.43 per diluted share, compared to $3.3 million, or $0.31 per
diluted share, in the same quarter a year ago. Sierra Bancorp
generated a return on average equity of 22.5% in the first quarter
of 2006 compared to 18.3% in the same quarter last year. "We're off
to a spirited start in 2006," remarked James C. Holly, President
and CEO. "Our Bank is really a reflection of the people who work
here," Holly stated, "and we are fortunate to have retained highly
dedicated, talented, and hard-working individuals on staff who have
created the momentum to provide such a strong launch in our 29th
year of operations." Financial Highlights The Company's improved
quarterly operating results were primarily the result of growth in
average earning assets and a higher net interest margin. Average
interest-earning assets were $57 million higher in the first
quarter of 2006 than in the first quarter of 2005, and the
Company's net interest margin was 5.85% for the first quarter of
2006 versus 5.43% in the first quarter of 2005. The following
factors contributed to the net interest margin increase: the
Company's balance sheet is asset-sensitive, and net interest income
tends to increase as short-term interest rates rise; the ratio of
average interest-free demand deposit balances to average earning
assets grew to 29% in the first quarter of 2006 from 27% in the
first quarter of 2005; and non-performing loan balances declined to
$914,000 at March 31, 2006 from $3.9 million at March 31, 2005. For
the quarter, service charges on deposits increased by $218,000, or
17%, relative to the first quarter of 2005. Service charges show
considerable improvement due primarily to the implementation of new
charges for higher-risk accounts. Loan sale and servicing income
was down 98% because of the prior-year sale of $21 million in
mortgage loans at a $527,000 gain. Other non-interest income
increased by $473,000, or 56%, due largely to the $330,000
write-down of our investment in Diversified Holdings, Inc. in the
first quarter of 2005, but year-over-year increases in core
operating income such as debit card interchange fees and leasing
income also contributed. On the expense side, salaries and benefits
were only 3% higher despite the addition of staff for our two
newest branches. The main reason for the lower-than-expected
increase is a $177,000, or 24%, increase in the deferral of salary
costs that are associated with successful loan originations. The
cost of benefits also fell by $127,000, due in large part to a
reduction in workers compensation costs. As with salaries and
benefits, occupancy expense increased by only 3%. Other
non-interest expenses declined by $329,000, or 10%. One of the
principal reasons for the drop is that marketing expenses were
$273,000 lower in 2006 than in 2005, due to a $95,000 reduction in
expenditures for a deposit program that is not being repeated in
2006 and timing differences in the payment of other promotional
expenses. Another factor in the reduction in non-interest expenses
is that OREO properties were written down by $200,000 in the first
quarter of 2005, but only by $133,000 in the first quarter of 2006.
The Company's single remaining OREO property at year-end 2005 was
sold in March, and the balance at the end of the first quarter was
zero. While it is possible that other properties may be foreclosed
upon during the remainder of the year, further OREO write-downs
during 2006 are not anticipated. Major balance sheet changes during
the first quarter of 2006 include a $54 million, or 7%, increase in
gross loans and leases, an $8 million, or 1%, drop in total
deposits, and an increase of $53 million, or 47%, in other borrowed
money. Most of the loan growth for the quarter was centered in
commercial loans, SBA loans, and real estate loans, which grew by
12%, 9%, and 7% respectively. Within real estate loans, the
strongest growth for the quarter was in loans secured by
residential properties (most of which are actually commercial loans
with residential real estate taken as collateral), which increased
by $26 million, or 20%. Commenting further on balance sheet growth,
Holly stated, "while most of the loan growth in the first quarter
was generated by more-established branches, our Reedley branch has
over $5 million in gross loans after its first full quarter of
operation, and our newly-opened office in the Bakersfield
Riverlakes area also appears poised to do well." The new branch in
Bakersfield brings the total number of branches operated by the
Company to twenty, and Holly explained that the Company's branch
expansion strategy, which allows for two to three new branches a
year, should provide a strong foundation for continued steady
growth in the future. Time certificates of deposit fell by $18
million during the quarter, and non-interest demand deposits were
down by about $2 million. On the other hand, NOW, savings, and
money market account deposits increased by a combined $12 million.
It is anticipated that recently-added deposit products targeted at
commercial customers will help reverse the decline in deposits and
provide for more balanced growth between loans and deposits in the
future. "The decline in deposits in the first quarter of 2006 is
similar to cycles the Company has experienced in the past, and
borrowings from the Federal Home Loan Bank were used to make up for
the deposit decrease and to fund loan growth," observed Ken Taylor,
Chief Financial Officer. Taylor noted further, "the Company has
ample liquidity resources in the form of brokered CD's, Federal
Home Loan Bank borrowing lines, and correspondent bank lines of
credit to fund any anticipated loan growth, although if core
deposit growth doesn't materialize as anticipated our net interest
margin could be negatively impacted by increased reliance on these
more costly wholesale sources of funding." About Sierra Bancorp
Sierra Bancorp is the holding company for Bank of the Sierra
(http://www.bankofthesierra.com/), which is in its 29th year of
operations and is the largest independent bank headquartered in the
South San Joaquin Valley. The Company has $1.1 billion in total
assets and currently maintains twenty branch offices, an
agricultural credit center, and an SBA center. In June 2005, Sierra
Bancorp was added to the Russell 2000 index based on relative
growth in market capitalization. In its July 2005 edition, US
Banker magazine ranked Sierra Bancorp as the nation's 8th best
performing publicly-traded community bank based on three-year
average return on equity. The statements contained in this release
that are not historical facts are forward-looking statements based
on management's current expectations and beliefs concerning future
developments and their potential effects on the Company. Readers
are cautioned not to unduly rely on forward-looking statements.
Actual results may differ from those projected. These
forward-looking statements involve risks and uncertainties
including but not limited to the health of the national and
California economies, the Company's ability to attract and retain
skilled employees, customers' service expectations, the Company's
ability to successfully de ploy new technology and gain
efficiencies there from, the success of branch expansion, changes
in interest rates, loan portfolio performance, the Company's
ability to secure buyers for foreclosed properties, and other
factors detailed in the Company's SEC filings. CONSOLIDATED INCOME
STATEMENT 3-Month Period Ended: (in $000's, unaudited) 3/31/2006
3/31/2005 % Change Interest Income $18,019 $14,659 22.9% Interest
Expense 4,540 2,831 60.4% Net Interest Income 13,479 11,828 14.0%
Provision for Loan & Lease Losses 1,050 1,000 5.0% Net Int
after Provision 12,429 10,828 14.8% Service Charges 1,476 1,258
17.3% Loan Sale & Servicing Income 13 560 -97.7% Other
Non-Interest Income 1,314 841 56.2% Gain (Loss) on Investments - -
0.0% Total Non-Interest Income 2,803 2,659 5.4% Salaries &
Benefits 4,191 4,066 3.1% Occupancy Expense 1,548 1,497 3.4% Other
Non-Interest Expenses 2,844 3,173 -10.4% Total Non-Interest Expense
8,583 8,736 -1.8% Income Before Taxes 6,649 4,751 39.9% Provision
for Income Taxes 2,199 1,490 47.6% Net Income $4,450 $3,261 36.5%
TAX DATA Tax-Exempt Muni Income $475 $334 42.2% Tax-Exempt BOLI
Income $185 $253 -26.9% Interest Income - Fully Tax Equiv $18,275
$14,831 23.2% NET CHARGE-OFFS $83 $191 -56.5% PER SHARE DATA
3-Month Period Ended: (unaudited) 3/31/2006 3/31/2005 % Change
Basic Earnings per Share $0.46 $0.34 35.3% Diluted Earnings per
Share $0.43 $0.31 38.7% Common Dividends $0.13 $0.11 18.2% Wtd.
Avg. Shares Outstanding 9,752,996 9,723,454 Wtd. Avg. Diluted
Shares 10,271,246 10,386,027 Book Value per Basic Share (EOP) $8.43
$7.49 12.6% Tangible Book Value per Share (EOP) $7.86 $6.92 13.6%
Common Shares Outstndg. (EOP) 9,769,880 9,775,923 KEY FINANCIAL
RATIOS 3-Month Period Ended: (unaudited) 3/31/2006 3/31/2005 Return
on Average Equity 22.46% 18.32% Return on Average Assets 1.70%
1.32% Net Interest Margin (Tax-Equiv.) 5.85% 5.43% Efficiency Ratio
(Tax-Equiv.) 51.53% 57.78% Net C/O's to Avg Loans (not annualized)
0.01% 0.03% AVERAGE BALANCES 3-Month Period Ended: (in $000's,
unaudited) 3/31/2006 3/31/2005 % Change Average Assets $1,061,229
$998,893 6.2% Average Interest-Earning Assets $953,215 $896,070
6.4% Average Gross Loans & Leases $756,109 $692,782 9.1%
Average Deposits $813,560 $755,044 7.8% Average Equity $80,347
$72,176 11.3% STATEMENT OF CONDITION End of Period: (in $000's,
unaudited) 3/31/2006 12/31/2005 3/31/2005 Annual Chg ASSETS Cash
and Due from Banks $41,627 $50,147 $35,022 18.9% Securities and Fed
Funds Sold 197,495 193,676 218,403 -9.6% Agricultural 8,642 9,898
12,519 -31.0% Commercial & Industrial 124,404 110,683 103,085
20.7% Real Estate 577,102 537,182 488,745 18.1% SBA Loans 26,463
24,190 21,659 22.2% Consumer Loans 50,268 51,006 48,868 2.9%
Consumer Credit Card Balances 8,162 8,401 8,335 -2.1% Gross Loans
& Leases 795,041 741,360 683,211 16.4% Deferred Loan &
Lease Fees (2,933) (2,250) (1,223) 139.8% Loans & Leases Net of
Deferred Fees 792,108 739,110 681,988 16.1% Allowance for Loan
& Lease Losses (10,297) (9,330) (9,651) 6.7% Net Loans &
Leases 781,811 729,780 672,337 16.3% Bank Premises & Equipment
18,128 18,055 17,353 4.5% Other Assets 63,169 61,028 59,576 6.0%
Total Assets $1,102,230 $1,052,686 $1,002,691 9.9% LIABILITIES
& CAPITAL Demand Deposits $280,866 $282,451 $241,603 16.3% NOW
/ Savings Deposits 148,124 140,989 140,400 5.5% Money Market
Deposits 112,008 107,045 115,578 -3.1% Time Certificates of Deposit
267,167 285,186 271,512 -1.6% Total Deposits 808,165 815,671
769,093 5.1% Junior Subordinated Debentures 30,928 30,928 30,928
0.0% Other Interest-Bearing Liabilities 167,228 113,861 118,720
40.9% Total Deposits & Int.- Bearing Liab. 1,006,321 960,460
918,741 9.5% Other Liabilities 13,555 13,463 10,758 26.0% Total
Capital 82,354 78,763 73,192 12.5% Total Liabilities & Capital
$1,102,230 $1,052,686 $1,002,691 9.9% CREDIT QUALITY DATA End of
Period: (in $000's, unaudited) 3/31/2006 12/31/2005 3/31/2005
Annual Chg Non-Accruing Loans $914 $309 $1,631 -44.0% Over 90 Days
PD and Still Accruing - - - 0.0% Other Real Estate Owned - 533
2,234 -100.0% Total Non-Performing Assets $914 $842 $3,865 -76.4%
Non-Perf Loans to Total Loans 0.11% 0.04% 0.24% Non-Perf Assets to
Total Assets 0.08% 0.08% 0.39% Allowance for Ln Losses to Loans
1.30% 1.26% 1.41% OTHER PERIOD-END STATISTICS End of Period:
(unaudited) 3/31/2006 12/31/2005 3/31/2005 Shareholders Equity /
Total Assets 7.5% 7.5% 7.3% Loans / Deposits 98.4% 90.9% 88.8%
Non-Int. Bearing Dep. / Total Dep. 34.8% 34.6% 31.4% DATASOURCE:
Sierra Bancorp CONTACT: Ken Taylor, EVP/CFO, or Hope Attenhofer,
SVP/Marketing Director, both of Sierra Bancorp, +1-559-782-4900 or
888-454-BANK Web site: http://www.bankofthesierra.com/
Copyright
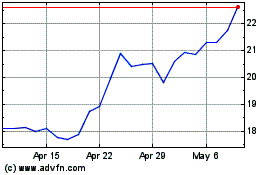
Sierra Bancorp (NASDAQ:BSRR)
Historical Stock Chart
From Aug 2024 to Sep 2024

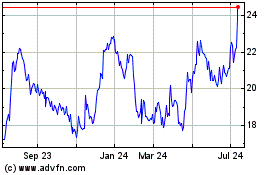
Sierra Bancorp (NASDAQ:BSRR)
Historical Stock Chart
From Sep 2023 to Sep 2024
