Flexsteel Industries, Inc. (NASDAQ:FLXS) today reported net
income for its first fiscal quarter ended September 30, 2010 of
$2.3 million or $0.34 per share compared to a net income of $1.4
million or $0.21 per share in the prior year quarter. The current
year quarter included a pre-tax charge of approximately $1.0
million related to the planned closing of a manufacturing
operation. Excluding this charge, operating income was at an
all-time high for a first fiscal quarter.
The Company reported net sales for the quarter ended September
30, 2010 of $87.2 million compared to the prior year quarter of
$75.9 million, an increase of 15%. Residential net sales were $65.2
million in the current quarter, an increase of 16% from the prior
year quarter residential net sales of $56.2 million. Commercial net
sales were $22.0 million compared to $19.7 million in the prior
year quarter, an increase of 12%.
Gross margin for the quarter ended September 30, 2010 was 22.5%
compared to 21.8% in the prior year quarter. The improvement in
gross margin percentage is primarily due to better coverage of
fixed costs on the higher sales volume.
Selling, general and administrative expenses were $14.9 million
or 17.1% of sales and $14.1 million or 18.6% of sales for the
quarters ended September 30, 2010 and 2009, respectively. The
percentage improvement is due to better absorption of fixed costs
offsetting the $0.8 million increase related to the higher sales
volume.
Working capital (current assets less current liabilities) at
September 30, 2010 was $93.2 million. Net cash used in operating
activities was $3.6 million during the first quarter ended
September 30, 2010. This use of cash was primarily related to
increases in inventories of $5.8 million and receivables of $2.0
million offset by net income of $2.3 million, an increase in
accounts payable of $1.1 million and depreciation of $0.7
million.
Capital expenditures were $0.4 million for the quarter ended
September 30, 2010. Depreciation expense was $0.7 million and $0.8
million for the fiscal quarters ended September 30, 2010 and 2009,
respectively. The Company expects that capital expenditures will be
approximately $3.0 million for the remainder of the 2011 fiscal
year.
All earnings per share amounts are on a diluted basis.
Outlook
Our balance sheet remains strong reflecting working capital in
excess of $93 million and no bank borrowings. We had a sales
increase for the current quarter over the prior year quarter due in
part to a strong backlog going into the quarter. Our incoming order
rate has slowed during the quarter and remains soft as we move into
our second quarter, consistent with the furniture industry in
general.
Residential furniture is a highly deferrable purchase item and
can be adversely impacted by factors, such as, low levels of
consumer confidence, a depressed market for housing, limited
consumer credit and high unemployment. We believe that commercial
product sales are at or near the bottom of the downward cycle and
should level off. We do not anticipate significant improvements in
commercial markets before the second half of fiscal year 2011.
We remain committed to our core strategies, which include a wide
range of quality product offerings and price points to the
residential and commercial markets, combined with a conservative
approach to business. We will maintain our focus on a strong
balance sheet through emphasis on cash flow and improving
profitability. We believe these core strategies are in the best
interest of our shareholders.
Analysts Conference Call
We will host a conference call for analysts on October 20, 2010,
at 10:30 a.m. Central Time. To access the call, please dial
1-866-830-5279 and provide the operator with ID# 98831983. A replay
will be available for two weeks beginning approximately two hours
after the conclusion of the call by dialing 1-800-642-1687 and
entering ID# 98831983.
Forward-Looking Statements
Statements, including those in this release, which are not
historical or current facts, are “forward-looking statements” made
pursuant to the safe harbor provisions of the Private Securities
Litigation Reform Act of 1995. There are certain important factors
that could cause our results to differ materially from those
anticipated by some of the statements made in this press release.
Investors are cautioned that all forward-looking statements involve
risk and uncertainty. Some of the factors that could affect results
are the cyclical nature of the furniture industry, the
effectiveness of new product introductions and distribution
channels, the product mix of sales, pricing pressures, the cost of
raw materials and fuel, foreign currency valuations, actions by
governments including laws, regulations, taxes and tariffs,
inflation, the amount of sales generated and the profit margins
thereon, competition (both foreign and domestic), changes in
interest rates, credit exposure with customers and general economic
conditions. Any forward-looking statement speaks only as of the
date of this press release. We specifically decline to undertake
any obligation to publicly revise any forward-looking statements
that have been made to reflect events or circumstances after the
date of such statements or to reflect the occurrence of anticipated
or unanticipated events.
About Flexsteel
Flexsteel Industries, Inc. is headquartered in Dubuque, Iowa,
and was incorporated in 1929. Flexsteel is a designer,
manufacturer, importer and marketer of quality upholstered and wood
furniture for residential, recreational vehicle, office,
hospitality and healthcare markets. All products are distributed
nationally.
For more information, visit our web site at
http://www.flexsteel.com.
FLEXSTEEL INDUSTRIES, INC. AND
SUBSIDIARIES CONSOLIDATED CONDENSED BALANCE SHEETS (UNAUDITED) (in
thousands) September 30, June 30, 2010 2010
ASSETS
CURRENT ASSETS: Cash and cash equivalents $ 4,257 $ 8,278
Trade receivables, net 37,792 35,748 Inventories 78,391 72,637
Other 5,160 5,126 Total current assets 125,600 121,789
NONCURRENT ASSETS: Property, plant, and equipment, net 21,186
21,614 Other assets 14,699 14,267 TOTAL $ 161,485 $ 157,670
LIABILITIES AND SHAREHOLDERS’ EQUITY
CURRENT LIABILITIES: Accounts payable – trade $ 11,864 $
10,815 Accrued liabilities 20,572 20,174 Total current liabilities
32,436 30,989 LONG-TERM LIABILITIES: Other long-term
liabilities 9,181 9,069 Total liabilities 41,617 40,058
SHAREHOLDERS’ EQUITY 119,868 117,612 TOTAL $ 161,485 $
157,670 FLEXSTEEL INDUSTRIES, INC. AND SUBSIDIARIES
CONSOLIDATED STATEMENTS OF OPERATIONS (UNAUDITED) (in thousands,
except per share data) Three Months Ended September 30, 2010
2009 NET SALES $ 87,230 $ 75,940 COST OF GOODS SOLD
(67,625 ) (59,384 ) GROSS MARGIN 19,605 16,556 SELLING, GENERAL AND
ADMINISTRATIVE (14,898 ) (14,141 ) FACILITY CLOSING COSTS (1,016 )
-- OPERATING INCOME 3,691 2,415
OTHER INCOME (EXPENSE):
Interest and other income 102 32 Interest expense -- (137 )
Total 102 (105 ) INCOME BEFORE INCOME TAXES 3,793 2,310
INCOME TAX PROVISION (1,450 ) (930 ) NET INCOME $ 2,343 $
1,380 AVERAGE NUMBER OF COMMON
SHARES OUTSTANDING:
Basic 6,660 6,576 Diluted 6,839 6,615
EARNINGS PER SHARE OF COMMON STOCK: Basic $ 0.35 $ 0.21
Diluted $ 0.34 $ 0.21
FLEXSTEEL INDUSTRIES, INC. AND SUBSIDIARIES CONSOLIDATED CONDENSED
STATEMENTS OF CASH FLOWS (UNAUDITED) (in thousands) Three Months
Ended September 30, 2010 2009
OPERATING ACTIVITIES:
Net income $ 2,343 $ 1,380 Adjustments to reconcile net income to
net cash (used in) provided by operating activities: Depreciation
722 806 Deferred income taxes (86 ) (596 ) Stock-based compensation
expense 135 -- Provision for losses on accounts receivable 240 490
Loss (gain) on disposition of capital assets 15 (3 ) Changes in
operating assets and liabilities (6,974 ) 964 Net cash (used
in) provided by operating activities (3,605 ) 3,041
INVESTING ACTIVITIES:
Net sales of investments 127 188 Proceeds from sale of capital
assets 18 3 Capital expenditures (384 ) (627 ) Net cash used in
investing activities (239 ) (436 )
FINANCING ACTIVITIES:
Net repayments of borrowings -- (3,000 ) Dividends paid (332 ) (329
) Proceeds from issuance of common stock 155 -- Net
cash used in financing activities (177 ) (3,329 ) Decrease
in cash and cash equivalents (4,021 ) (724 ) Cash and cash
equivalents at beginning of period 8,278 1,714 Cash
and cash equivalents at end of period $ 4,257 $ 990
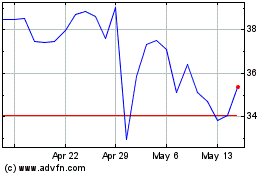
Flexsteel Industries (NASDAQ:FLXS)
Historical Stock Chart
From Jun 2024 to Jul 2024

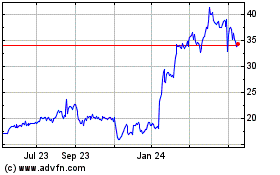
Flexsteel Industries (NASDAQ:FLXS)
Historical Stock Chart
From Jul 2023 to Jul 2024
