- Second quarter operating margin improves to 11.7% compared with
4.8% in the prior year period EAST AURORA, N.Y., Aug. 3
/PRNewswire-FirstCall/ -- Astronics Corporation (NASDAQ:ATRO), a
leading manufacturer of advanced, high-performance lighting,
electronics and electrical power systems for the global aerospace
industry, reported net income increased to $2.0 million for the
second quarter of 2006 compared with $0.2 million in the second
quarter of 2005. On a diluted earnings per share basis, earnings
were $0.25 for the second quarter of 2006 compared with $0.02 in
the same quarter last year. The company reported sales of $29.0
million for the second quarter of 2006, a 54% increase from $18.8
million in the same period in last year. Higher sales were driven
by demand for the Company's cabin electronics products which
provide a power source for in-flight entertainment and in-seat
power systems for the global commercial airline market. Also
contributing to this quarter's growth was sales of the Company's
airframe power products used on the Tactical Tomahawk and Taurus
missile programs which moved to high rates of production last July.
Peter J. Gundermann, President and CEO commented, "While most of
our product lines showed growth over the same period last year,
sales of our cabin electronics products were extremely strong. The
primary driver of growth through the second quarter this year has
been the commercial transport market's demand for cabin
electronics, although the business jet market also remains strong."
Gross margin for the quarter was 23.6%, an improvement from 18.6%
in the second quarter of 2005, primarily as a result of improved
operating leverage on higher sales. Selling, general and
administrative (SG&A) expenses of $3.4 million decreased to
11.9% of sales for the second quarter of 2006 compared with $2.6
million, or 13.7% of sales, in the second quarter of fiscal 2005.
Contributing to the increase in SG&A expenses this year was the
company's recognition of stock based compensation as an expense and
costs incurred related to its Sarbanes Oxley section 404 activity.
Comparing the second quarter of 2006 to the first quarter of 2006,
sales in the second quarter grew 16.5%, while net income increased
66.5%. Gross margin in the second quarter 2006 improved 2.5
percentage points over the first quarter of 2006 reflecting higher
operating leverage. SG&A expenses increased $0.4 million in the
second quarter of 2006 compared with the first quarter of 2006, but
declined slightly as a percent of sales, and was a result increased
costs associated with Sarbanes Oxley section 404 and increased
compensation costs for stock based compensation. Six-Month Period
Sales for the first half of 2006 were $54.0 million, a 56% increase
over last year's first half sales of $34.5 million. Gross margin
for the 2006 six- month period was 22.4%, up 2.7 percentage points
from the same period last year. For the 2006 six-month period,
engineering and development costs were $4.8 million, up from $3.9
million in the prior year. SG&A expenses decreased from 13.9%
of sales in the first half of 2005 to 12.0% of sales for the same
period this year. For the first six months of 2006, net income was
$3.2 million and diluted earnings per share were $0.39 compared
with $0.8 million and $0.10 respectively in the first six months of
2005. Liquidity Cash and cash equivalents declined from $4.5
million at December 31, 2005, to $0.4 million at the end of the
second quarter 2006. Cash was used to support increases in working
capital as well as to pay down $1.0 million on the line of credit
during the first half of the year. As of July 1, 2006, $6.0 million
was outstanding on the company's $15 million line of credit.
Capital expenditures for the second quarter of 2006 were slightly
higher at $1.0 million compared with $0.8 million in the same
period last year. Outlook Bookings grew 26% in the second quarter
of 2006 to $29.7 million compared with $23.6 million in the same
period last year. Backlog at the end of the second quarter was
$94.7 million, a 22% increase from $77.9 million at July 2, 2005,
and up $0.7 million from the end of the first quarter this year.
Mr. Gundermann added, "We are having an excellent year. The success
of the product lines we gained when we acquired AES combined with
the overall strength of the aircraft industry continues to spur
increased sales. We believe our in-seat power system is realizing
so much success because it is the best product available, and many
airlines as they acquire new aircraft, or refurbish existing
aircraft, are choosing our system. We also sell our power system to
manufacturers of in-flight entertainment systems. They integrate
our in-seat power system into their product and sell the complete
package to airlines. As long as the global airline market is
fairing well, we should continue to see growth from this product.
However, we do not have much visibility as to how demand for the
in-seat power system could fluctuate." "The business jet market is
also strong with growing production rates. As a result, given what
we have realized in the first half of the year and the robustness
of the current market, we are raising our full year revenue
estimate to $105 million to $110 million," he concluded. Second
Quarter Webcast and Conference Call The release of the financial
results on August 3, 2006, will be followed by a company-hosted
teleconference at 11:00 a.m. ET. During the teleconference, Peter
J. Gundermann, President and CEO, and David C. Burney, Vice
President and CFO, will review the financial and operating results
for the period and discuss Astronics' corporate strategy and
outlook. A question- and-answer session will follow. The Astronics
conference call can be accessed the following ways: -- The live
webcast can be found at http://www.astronics.com/. Participants
should go to the website 10 - 15 minutes prior to the scheduled
conference in order to register and download any necessary audio
software. -- The teleconference can be accessed by dialing (913)
312-1267 approximately 5 - 10 minutes prior to the call. To listen
to the archived call: -- The archived webcast will be at
http://www.astronics.com/. A transcript will also be posted once
available. -- A replay can also be heard by calling (719) 457-0820,
and entering passcode 7731947. The telephonic replay will be
available through Thursday, August 10, 2006 at 11:59 p.m. ET. ABOUT
ASTRONICS CORPORATION Astronics Corporation is a leading
manufacturer of advanced, high- performance lighting and electrical
power distribution systems for the global aerospace industry. Its
strategy is to expand the value and content it provides to various
aircraft platforms through product development and acquisition.
Astronics Corporation, and its wholly-owned subsidiaries Astronics
Advanced Electronic Systems Corp. and Luminescent Systems Inc.,
have a reputation for high quality designs, exceptional
responsiveness, strong brand recognition and best-in-class
manufacturing practices. For more information on Astronics and its
products, visit its website at http://www.astronics.com/. Safe
Harbor Statement This press release contains forward-looking
statements as defined by the Securities Exchange Act of 1934. One
can identify these forward-looking statements by the use of the
words "expect," "anticipate," "plan," "may," "will," "estimate" or
other similar expression. Because such statements apply to future
events, they are subject to risks and uncertainties that could
cause the actual results to differ materially from those
contemplated by the statements. Important factors that could cause
actual results to differ materially include the state of the
aerospace industry, the market acceptance of newly developed
products, the ability to cross sell products and expand markets,
internal production capabilities, the timing of orders received,
the status of customer certification processes, the demand for and
market acceptance of new or existing aircraft which contain the
Company's products, such as the Airbus A380; the Eclipse 500; the
Air Canada's CRJ705, A320, and several configurations of B767;
Cessna single engine aircraft; Cessna Mustang; Hawker Horizon; the
V22 Osprey; Lockheed Martin F-35 JSF; China Eastern Airlines Corp.
Limited's upgrade of 15 Airbus A330-300's and five Airbus A330-
200's; Air China Limited's upgrades of 20 Airbus A330-200's; and
F-22 Raptor; customer preferences, and other factors which are
described in filings by Astronics with the Securities and Exchange
Commission. The Company assumes no obligation to update
forward-looking information in this press release whether to
reflect changed assumptions, the occurrence of unanticipated events
or changes in future operating results, financial conditions or
prospects, or otherwise. ASTRONICS CORPORATION CONSOLIDATED INCOME
STATEMENT DATA (unaudited) (in thousands except per share data)
Three months ended Six months ended 7/1/2006 7/2/2005 7/1/2006
7/2/2005 Sales $29,039 $18,839 $53,965 $34,495 Cost of products
sold 22,195 15,344 41,872 27,707 Gross margin 23.6% 18.6% 22.4%
19.7% Selling general and administrative 3,443 2,582 6,462 4,793
Income from operations 3,401 913 5,631 1,995 Operating margin 11.7%
4.8% 10.4% 5.8% Interest expense, net 219 191 418 317 Other
(income) expense (22) - (34) (4) Income (loss) before tax 3,204 722
5,247 1,682 Income taxes 1,189 525 2,022 876 Net Income $2,015 $197
$3,225 $806 Basic earnings per share: $0.25 $0.02 $0.41 $0.10
Diluted earnings per share: $0.25 $0.02 $0.39 $0.10 Weighted
average diluted shares outstanding 8,223 8,023 8,183 7,962 Capital
Expenditures $962 $782 $1,607 $1,333 Depreciation and Amortization
$636 $706 $1,259 $1,322 ASTRONICS CORPORATION CONSOLIDATED BALANCE
SHEET DATA (unaudited) (in thousands) 7/1/2006 12/31/2005 ASSETS:
Cash and cash equivalents $425 $4,473 Accounts receivable 17,784
12,635 Inventories 23,223 19,013 Other current assets 1,895 1,401
Property, plant and equipment, net 21,085 20,461 Other assets 7,757
7,874 Total Assets $72,169 $65,857 LIABILITIES AND SHAREHOLDERS'
EQUITY: Current maturities of long term debt $919 $914 Note payable
6,000 7,000 Accounts payable and accrued expenses 19,396 15,843
Long-term debt 9,868 10,304 Other liabilities 6,126 5,962
Shareholders' equity 29,860 25,834 Total liabilities and
shareholders' equity $72,169 $65,857 ASTRONICS CORPORATION NET
SALES BY MARKET ($, in thousands) Three Months Ended 7/1/2006
7/2/2005 % change Military $6,448 $6,077 6.10% Commercial Transport
16,881 8,428 100.30% Business Jet 5,447 4,098 32.92% Other 263 236
11.44% Total $29,039 $18,839 54.14% Six Months Ended 7/1/2006
7/2/2005 % change 2006 YTD % Military $13,589 $11,172 21.63% 25.18%
Commercial Transport 29,325 14,590 100.99% 54.34% Business Jet
10,328 8,102 27.47% 19.14% Other 723 631 14.58% 1.34% Total $53,965
$34,495 56.44% 100.00% ASTRONICS CORPORATION NET SALES BY PRODUCT
($, in thousands) Three Months Ended 7/1/2006 7/2/2005 % change
Cockpit Lighting $7,209 $6,996 3.04% Cabin Electronics 12,666 5,092
148.74% Airframe Power 4,396 2,087 110.64% External Lighting 2,229
2,728 -18.29% Cabin Lighting 2,276 1,700 33.88% Other 263 236
11.44% Total $29,039 $18,839 54.14% Six Months Ended 7/1/2006
7/2/2005 % change 2006 YTD % Cockpit Lighting $15,282 $13,716
11.42% 28.32% Cabin Electronics 20,958 8,084 159.25% 38.84%
Airframe Power 8,562 3,927 118.03% 15.87% External Lighting 3,979
4,700 -15.34% 7.37% Cabin Lighting 4,461 3,437 29.79% 8.27% Other
723 631 14.58% 1.34% Total $53,965 $34,495 56.44% 100.00% ASTRONICS
CORPORATION ORDER AND BACKLOG TREND ($, in thousands) 2005 Q1 2005
Q2 2005 Q3 2005 Q4 2005 Twelve Months 4/2/05 7/2/05 10/1/05
12/31/05 12/31/05 Bookings $14,868 $23,564 $20,176 $37,946 $96,554
Backlog $72,292 $77,856 $77,611 $95,121 $95,121 Book:Bill 0.95 1.25
0.99 1.86 1.28 ($, in thousands) 2006 Q1 2006 Q2 2006 Six Months
4/1/06 7/1/06 7/1/06 Bookings $23,850 $29,729 $53,579 Backlog
$94,045 $94,735 $94,735 Book:Bill 0.96 1.02 0.99 DATASOURCE:
Astronics Corporation CONTACT: David C. Burney, Chief Financial
Officer of Astronics Corporation, +1-716-805-1599, ext. 159, Fax,
+1-716-805-1286, Web site: http://www.astronics.com/
Copyright
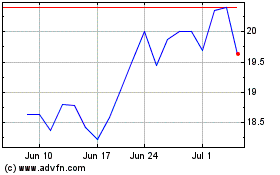
Astronics (NASDAQ:ATRO)
Historical Stock Chart
From Apr 2024 to May 2024

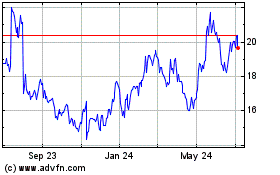
Astronics (NASDAQ:ATRO)
Historical Stock Chart
From May 2023 to May 2024
