First quarter Net Revenue increased by 19% year
over year to $277 million
Net Loss improved by $5 million year over year
to ($1) million
Adjusted EBITDA increased by 10% year over year
to $48 million
Yelp Inc. (NYSE: YELP), the company that connects people with
great local businesses, today posted its financial results for the
first quarter ended March 31, 2022 in the Q1 2022 Shareholder
Letter available on its Investor Relations website at
www.yelp-ir.com.
“Our strong start to the year was driven by the continued
execution of our long-term strategy and the strong demand for
Yelp’s advertising products,” said Jeremy Stoppelman, Yelp
co-founder and chief executive officer. “Our first quarter results
reflect the value we’re delivering to our advertisers, with
year-over year growth in both the number of business locations that
advertised on Yelp and the average amount each location chose to
spend on our platform. We believe that the strength of our
broad-based advertising model positions us well to deliver on our
plan for the year and drive shareholder value over the long
term.”
“Led by growth in our most efficient channels, self-serve and
multi-location, first-quarter net revenue reached a new quarterly
high, increasing by 19% year over year,” said David Schwarzbach,
Yelp’s chief financial officer. “We’re pleased by these strong
results and currently expect Net revenue to come in towards the
high end of our business outlook range for the full year. We plan
to continue prioritizing investments in areas that we believe will
drive profitable growth, including product development and
marketing.”
Quarterly Conference Call
Yelp will host a live Q&A session today at 2:00 p.m. Pacific
Time to discuss the first quarter financial results and outlook for
the second quarter and full year of 2022. The webcast of the
Q&A can be accessed on the Yelp Investor Relations website at
www.yelp-ir.com. A replay of the webcast will be available at the
same website.
About Yelp
Yelp Inc. (www.yelp.com) connects people with great local
businesses. With trusted local business information, photos, and
review content, Yelp provides a one-stop local platform for
consumers to discover, connect, and transact with local businesses
of all sizes by making it easy to request a quote, join a waitlist,
and make a reservation, appointment, or purchase. Yelp was founded
in San Francisco in July 2004.
Yelp intends to make future announcements of material financial
and other information through its Investor Relations website. Yelp
will also, from time to time, disclose this information through
press releases, filings with the Securities and Exchange
Commission, conference calls, or webcasts, as required by
applicable law.
Forward-Looking Statements
This press release contains forward-looking statements relating
to, among other things, Yelp’s future performance, its investment
plans, and its ability to deliver on its plan for the year and
shareholder value over the long term, that are based on its current
expectations, forecasts, and assumptions that involve risks and
uncertainties.
Yelp’s actual results could differ materially from those
predicted or implied and reported results should not be considered
as an indication of future performance. Factors that could cause or
contribute to such differences include, but are not limited to:
- fluctuations in the number of COVID-19 cases and the spread of
COVID-19 variants, the vaccination rate in the United States, and
any reimposition of COVID-19-related public health
restrictions;
- the pace of economic recovery in local economies and the United
States generally;
- Yelp’s ability to maintain and expand its base of advertisers,
particularly as many businesses continue to face macroeconomic
challenges, including labor and supply chain difficulties;
- Yelp’s ability to continue to operate effectively with a
primarily remote work force and attract and retain key talent;
- Yelp’s limited operating history in an evolving industry;
and
- Yelp’s ability to generate and maintain sufficient high-quality
content from its users.
Factors that could cause or contribute to such differences also
include, but are not limited to, those factors that could affect
Yelp’s business, operating results and stock price included under
the captions “Risk Factors” and “Management’s Discussion and
Analysis of Financial Condition and Results of Operations” in
Yelp’s most recent Annual Report on Form 10-K or Quarterly Report
on Form 10-Q at www.yelp-ir.com or the SEC’s website at
www.sec.gov.
YELP INC.
CONDENSED CONSOLIDATED BALANCE
SHEETS
(In thousands)
(Unaudited)
March 31, 2022
December 31,
2021
Assets
Current assets:
Cash and cash equivalents
$
465,121
$
479,783
Accounts receivable, net
111,762
107,358
Prepaid expenses and other current
assets
60,458
57,536
Total current assets
637,341
644,677
Property, equipment and software, net
83,138
83,857
Operating lease right-of-use assets
132,029
140,785
Goodwill
104,317
105,128
Intangibles, net
10,020
10,673
Restricted cash
794
858
Other non-current assets
77,267
64,550
Total assets
$
1,044,906
$
1,050,528
Liabilities and Stockholders'
Equity
Current liabilities:
Accounts payable and accrued
liabilities
$
146,283
$
119,620
Operating lease liabilities — current
41,130
40,237
Deferred revenue
8,218
4,156
Total current liabilities
195,631
164,013
Operating lease liabilities —
long-term
117,398
127,979
Other long-term liabilities
7,528
7,218
Total liabilities
320,557
299,210
Stockholders' equity:
Common stock
—
—
Additional paid-in capital
1,547,337
1,522,572
Treasury stock
(2,886
)
—
Accumulated other comprehensive loss
(11,903
)
(11,090
)
Accumulated deficit
(808,199
)
(760,164
)
Total stockholders' equity
724,349
751,318
Total liabilities and stockholders'
equity
$
1,044,906
$
1,050,528
YELP INC.
CONDENSED CONSOLIDATED
STATEMENTS OF OPERATIONS
(In thousands, except per
share data)
(Unaudited)
Three Months Ended
March 31,
2022
2021
Net revenue
$
276,628
$
232,096
Costs and expenses:
Cost of revenue (1)
23,429
14,874
Sales and marketing (1)
126,097
112,909
Product development (1)
80,685
67,992
General and administrative (1)
39,383
31,861
Depreciation and amortization
11,490
13,083
Restructuring
—
20
Total costs and expenses
281,084
240,739
Loss from operations
(4,456
)
(8,643
)
Other income, net
929
705
Loss before income taxes
(3,527
)
(7,938
)
Benefit from income taxes
(2,612
)
(2,142
)
Net loss attributable to common
stockholders
$
(915
)
$
(5,796
)
Net loss per share attributable to common
stockholders
Basic
$
(0.01
)
$
(0.08
)
Diluted
$
(0.01
)
$
(0.08
)
Weighted-average shares used to compute
net loss per share attributable to common stockholders
Basic
71,639
75,245
Diluted
71,639
75,245
(1) Includes stock-based compensation
expense as follows:
Three Months Ended
March 31,
2022
2021
Cost of revenue
$
1,305
$
1,108
Sales and marketing
8,655
8,397
Product development
23,125
20,753
General and administrative
7,975
8,987
Total stock-based compensation
$
41,060
$
39,245
YELP INC.
CONDENSED CONSOLIDATED
STATEMENTS OF CASH FLOWS
(In thousands)
(Unaudited)
Three Months Ended
March 31,
2022
2021
Operating Activities
Net loss
$
(915
)
$
(5,796
)
Adjustments to reconcile net loss to net
cash provided by operating activities:
Depreciation and amortization
11,490
13,083
Provision for doubtful accounts
7,562
3,289
Stock-based compensation
41,060
39,245
Noncash lease cost
8,453
10,779
Deferred income taxes
(11,074
)
(2,406
)
Amortization of deferred cost
4,039
3,401
Other adjustments, net
248
14
Changes in operating assets and
liabilities:
Accounts receivable
(11,968
)
(3,639
)
Prepaid expenses and other assets
(7,494
)
491
Operating lease liabilities
(9,492
)
(6,871
)
Accounts payable, accrued liabilities and
other liabilities
27,994
7,341
Net cash provided by operating
activities
59,903
58,931
Investing Activities
Purchases of property, equipment and
software
(6,636
)
(6,005
)
Other investing activities
61
29
Net cash used in investing activities
(6,575
)
(5,976
)
Financing Activities
Proceeds from issuance of common stock for
employee stock-based plans
540
6,049
Taxes paid related to the net share
settlement of equity awards
(18,487
)
(16,803
)
Repurchases of common stock
(50,006
)
(49,528
)
Net cash used in financing activities
(67,953
)
(60,282
)
Effect of exchange rate changes on cash,
cash equivalents and restricted cash
(101
)
68
Change in cash, cash equivalents and
restricted cash
(14,726
)
(7,259
)
Cash, cash equivalents and restricted cash
— Beginning of period
480,641
596,540
Cash, cash equivalents and restricted cash
— End of period
$
465,915
$
589,281
Non-GAAP Financial Measures
This press release and statements made during the above
referenced webcast may include information relating to Adjusted
EBITDA and Adjusted EBITDA margin, each of which the Securities and
Exchange Commission has defined as a "non-GAAP financial
measure."
We define Adjusted EBITDA as net income (loss), adjusted to
exclude: provision for (benefit from) income taxes; other income,
net; depreciation and amortization; stock-based compensation
expense; and, in certain periods, certain other income and expense
items, such as restructuring costs. We define Adjusted EBITDA
margin as Adjusted EBITDA divided by net revenue.
Adjusted EBITDA, which is not prepared under any comprehensive
set of accounting rules or principles, has limitations as an
analytical tool and you should not consider it in isolation or as a
substitute for analysis of Yelp’s financial results as reported in
accordance with generally accepted accounting principles in the
United States (“GAAP”). In particular, Adjusted EBITDA should not
be viewed as a substitute for, or superior to, net income (loss)
prepared in accordance with GAAP as a measure of profitability or
liquidity. Some of these limitations are:
- although depreciation and amortization are non-cash charges,
the assets being depreciated and amortized may have to be replaced
in the future, and Adjusted EBITDA does not reflect all cash
capital expenditure requirements for such replacements or for new
capital expenditure requirements;
- Adjusted EBITDA does not reflect changes in, or cash
requirements for, Yelp's working capital needs;
- Adjusted EBITDA does not reflect the impact of the recording or
release of valuation allowances or tax payments that may represent
a reduction in cash available to Yelp;
- Adjusted EBITDA does not consider the potentially dilutive
impact of equity-based compensation;
- Adjusted EBITDA does not take into account any income or costs
that management determines are not indicative of ongoing operating
performance, such as restructuring costs; and
- other companies, including those in Yelp’s industry, may
calculate Adjusted EBITDA differently, which reduces its usefulness
as a comparative measure.
Because of these limitations, you should consider Adjusted
EBITDA and Adjusted EBITDA margin alongside other financial
performance measures, net income (loss) and Yelp’s other GAAP
results.
The following is a reconciliation of net loss to Adjusted
EBITDA, as well as the calculation of net loss margin and Adjusted
EBITDA margin, for each of the periods indicated (in thousands,
except percentages; unaudited):
Three Months Ended
March 31,
2022
2021
Reconciliation of Net Loss to Adjusted
EBITDA:
Net loss
$
(915
)
$
(5,796
)
Benefit from income taxes
(2,612
)
(2,142
)
Other income, net
(929
)
(705
)
Depreciation and amortization
11,490
13,083
Stock-based compensation
41,060
39,245
Restructuring
—
20
Adjusted EBITDA
$
48,094
$
43,705
Net revenue
$
276,628
$
232,096
Net loss margin
—
%
(2
)%
Adjusted EBITDA margin
17
%
19
%
View source
version on businesswire.com: https://www.businesswire.com/news/home/20220505005826/en/
Investor Relations Contact: Kate Krieger ir@yelp.com
Press Contact: Amber Albrecht press@yelp.com
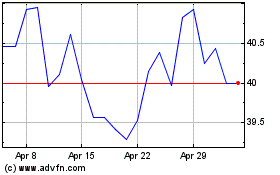
Yelp (NYSE:YELP)
Historical Stock Chart
From Mar 2024 to Apr 2024

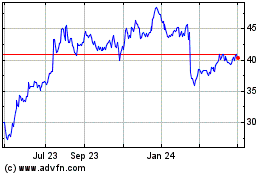
Yelp (NYSE:YELP)
Historical Stock Chart
From Apr 2023 to Apr 2024
