Energy Stocks Diverge From Oil Prices--Update
June 25 2019 - 5:40PM
Dow Jones News
By Jessica Menton
Energy shares are sliding this week despite oil's climb -- a
divergence some analysts say could linger if geopolitical tensions
in the Middle East continue to escalate.
The relationship between oil prices and shares of oil-producing
companies has weakened recently after Iran shot down a U.S.
military drone last week. Shares of energy companies in the S&P
500 fell 0.8% Tuesday and are down 1.7% so far this week. The
sector has shed 5.5% this quarter, on pace for its worst quarterly
percentage drop since the broader-market selloff in the final three
months of 2018.
Energy stocks in the S&P 500 have shed 15% over the past 12
months amid fears of oversupply and worries about slowing demand in
a weakening global economy.
The most recent declines come as U.S. crude prices have rallied
roughly 9% over the past week amid rising friction between
Washington and Tehran, though oil prices pulled back from multiweek
highs Tuesday.
"Investors are looking through the recent strength in oil prices
because they don't buy that the recent geopolitical tensions will
shoot oil materially higher, or the idea that demand for crude will
remain at steadfast levels," said Mike Tran, managing director and
global energy strategist at RBC Capital Markets.
Declines in shares of oil conglomerates Exxon Mobil Corp. and
Chevron Corp. weighed on the energy sector Tuesday, falling 0.9%
and 1%, respectively. Each have lost more than 1% this week.
Meanwhile, oil-field services companies have also been among the
hardest hit this week within the S&P 500's energy sector, a
corner of the energy market that has been vulnerable as crude
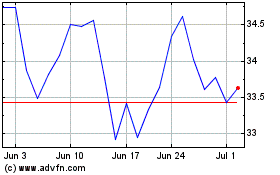
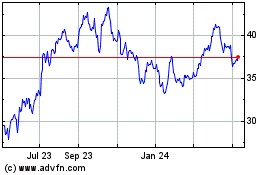
production has slowed, some analysts said. Shares of Baker Hughes
and Halliburton Co. have shed at least 1.5% this week and were
mildly lower Tuesday.
The slide may not last, however, if the U.S. and Iran don't
reach a detente soon.
"As geopolitical tensions escalate and there's risk that gets
priced back into oil prices, it'll be something that equity
investors just simply can't ignore," Mr. Tran said.
Write to Jessica Menton at Jessica.Menton@wsj.com
(END) Dow Jones Newswires
June 25, 2019 17:25 ET (21:25 GMT)
Copyright (c) 2019 Dow Jones & Company, Inc.
Halliburton (NYSE:HAL)
Historical Stock Chart
From Mar 2024 to Apr 2024

Halliburton (NYSE:HAL)
Historical Stock Chart
From Apr 2023 to Apr 2024
