FedEx On Pace for Record Percent Increase After 4Q Earnings Report -- Data Talk
July 01 2020 - 10:58AM
Dow Jones News
FedEx Corporation (FDX) is currently at $162.23, up $22.01 or
15.7%
-- Would be highest close since Feb. 21, 2020, when it closed at
$163.25
-- Would be largest percent increase on record (Based on
available data back to April 12, 1978)
-- On Tuesday, FedEx reported a fourth-quarter loss of $334
million, or $1.28 a share. FedEx's loss a year ago was $1.97
billion, or $7.56 a share. The latest results included costs
related to adjustments to its retirement plan and goodwill
impairment charges. The company said adjusted earnings were $2.53 a
share. FactSet said analysts expected $1.58 a share in adjusted
earnings for the quarter
-- Earlier Wednesday, JP Morgan upgraded FedEx to overweight
from neutral and raised its price target to $188.00/share from
$145.00/share, Benzinga reported. Three other firms also raised
their price target on FedEx, Benzinga reported
-- Currently up four of the past five days
-- Currently up three consecutive days; up 24.72% over this
period
-- Best three day stretch since the three days ending Nov. 2,
1978, when it rose 27.03%
-- Up 7.29% year-to-date
-- Down 40.86% from its all-time closing high of $274.32 on Jan.
19, 2018
-- Up 0.5% from 52 weeks ago (July 3, 2019), when it closed at
$161.42
-- Down 7.83% from its 52 week closing high of $176.01 on July
24, 2019
-- Up 79.28% from its 52 week closing low of $90.49 on March 16,
2020
-- Traded as high as $163.65; highest intraday level since Feb.
21, 2020, when it hit $164.14
-- Up 16.71% at today's intraday high; largest intraday percent
increase since Dec. 7, 1998, when it rose as much as 18.22%
-- Best performer in the S&P 500 today
All data as of 10:18:31 AM
Source: Dow Jones Market Data, FactSet
(END) Dow Jones Newswires
July 01, 2020 10:43 ET (14:43 GMT)
Copyright (c) 2020 Dow Jones & Company, Inc.
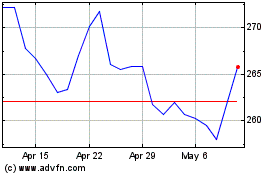
FedEx (NYSE:FDX)
Historical Stock Chart
From Mar 2024 to Apr 2024

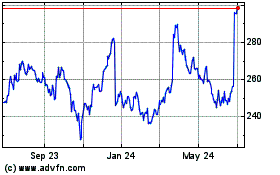
FedEx (NYSE:FDX)
Historical Stock Chart
From Apr 2023 to Apr 2024
