Increased affordability expected for used car
prices in the month of May
SANTA
MONICA, Calif, May 25, 2022
/PRNewswire/ -- TrueCar, Inc. (NASDAQ: TRUE), the easiest, most
efficient and transparent online destination for buying and selling
new and used vehicles, expects total new vehicle industry sales to
reach 1,221,790 units in May 2022, down 17% from a year
ago and up 10% from April 2022, when
adjusted for the same number of selling days. This month's
seasonally adjusted annualized rate (SAAR) for total light vehicle
industry sales is an estimated 14 million, down 17% from
May 2021. Excluding fleet
sales, TrueCar expects U.S. retail deliveries of new cars
and light trucks to be 1,062,452 units, down 18% from a year ago
and up 7% from April 2022.
"This month we're continuing to see a struggle for supply among
the industry however we're also now starting to see signs of demand
adjusting. Higher interest rates combined with higher fuel prices
present a headwind to demand cooling off, which may explain why
average used list prices are decreasing, down 1.6% in May versus
April 2022," said Nick Woolard, Lead Industry Analyst at TrueCar.
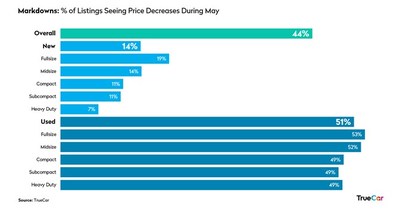
"In terms of price adjustments, compared to the beginning of the
month we are seeing more vehicles being marked down than for the
same period last year. This is truer for used where we are seeing
over half of our used listings getting a downward price adjustment
since the beginning of the month. This trend is led by the used
full-size vehicle segment."
"This month we're not expecting fleet inventory to be down as
much as retail, partly due to deferred fleet demand and the
domestic OEM brands generally being in a better inventory situation
than imported brands," said Valeri
Tompkins, Senior Vice President of OEM Solutions at
TrueCar.
Additional Industry Insights (from TrueCar):
- Total sales for May 2022 are
expected to be down 17% from a year ago and up 10% from
April 2022 when adjusted for the same
number of selling days.
- Fleet sales for May 2022 are
expected to be down 6% from a year ago and up 34% from April 2022 when adjusted for the same number of
selling days.
- Incentive spend is down 59% from last year.
- Average transaction price is projected to be up 14% from a year
ago and comparable to April
2022.
- Total SAAR is expected to be down 17% from a year ago at 14
million units.
- Used vehicle sales for May 2022
are expected to reach 3.1 million, down 19% from a year ago and
down 8% from April 2022.
- The average interest rate on new vehicles is 5.1% compared to
April 2022 at 4.8% and the average
interest rate on used vehicles is 8%.
- The average loan term on a new vehicle for May 2022 is about 71 months and the average loan
term on a used vehicle is also about 71 months.
|
Total Unit
Sales
|
|
|
|
Manufacturer
|
May 2022
Forecast
|
May 2021
Actual
|
Apr 2022
Actual
|
YoY %
Change
|
YoY % Change
(Daily Selling Rate)
|
MoM %
Change
|
MoM %
Change (Daily Selling
Rate)
|
|
BMW
|
29,590
|
39,204
|
28,678
|
-24.5%
|
-18.2%
|
3.2%
|
16.1%
|
|
Daimler
|
32,497
|
29,145
|
31,065
|
11.5%
|
20.8%
|
4.6%
|
17.7%
|
|
Ford
|
171,910
|
160,520
|
175,942
|
7.1%
|
16.0%
|
-2.3%
|
9.9%
|
|
GM
|
196,463
|
240,095
|
200,972
|
-18.2%
|
-11.4%
|
-2.2%
|
10.0%
|
|
Honda
|
84,399
|
176,815
|
93,250
|
-52.3%
|
-48.3%
|
-9.5%
|
1.8%
|
|
Hyundai
|
63,145
|
93,745
|
66,707
|
-32.6%
|
-27.0%
|
-5.3%
|
6.5%
|
|
Kia
|
54,806
|
80,298
|
59,063
|
-31.7%
|
-26.1%
|
-7.2%
|
4.4%
|
|
Nissan
|
64,910
|
110,374
|
74,668
|
-41.2%
|
-36.3%
|
-13.1%
|
-2.2%
|
|
Stellantis
|
139,300
|
182,966
|
143,078
|
-23.9%
|
-17.5%
|
-2.6%
|
9.5%
|
|
Subaru
|
47,475
|
56,558
|
45,748
|
-16.1%
|
-9.1%
|
3.8%
|
16.7%
|
|
Tesla
|
47,852
|
28,790
|
48,432
|
66.2%
|
80.1%
|
-1.2%
|
11.2%
|
|
Toyota
|
188,637
|
241,003
|
186,510
|
-21.7%
|
-15.2%
|
1.1%
|
13.8%
|
|
Volkswagen
Group
|
51,907
|
72,527
|
45,949
|
-28.4%
|
-22.5%
|
13.0%
|
27.1%
|
|
Industry
|
1,221,790
|
1,586,748
|
1,254,597
|
-23.0%
|
-16.6%
|
-2.6%
|
9.6%
|
|
Retail Unit
Sales
|
|
|
|
Manufacturer
|
May 2022
Forecast
|
May 2021
Actual
|
Apr 2022
Actual
|
YoY %
Change
|
YoY % Change
(Daily Selling Rate)
|
MoM %
Change
|
MoM %
Change (Daily Selling
Rate)
|
|
BMW
|
29,025
|
37,474
|
28,168
|
-22.5%
|
-16.1%
|
3.0%
|
15.9%
|
|
Daimler
|
31,451
|
27,938
|
30,430
|
12.6%
|
22.0%
|
3.4%
|
16.3%
|
|
Ford
|
127,065
|
124,561
|
143,183
|
2.0%
|
10.5%
|
-11.3%
|
-0.2%
|
|
GM
|
156,341
|
208,133
|
174,521
|
-24.9%
|
-18.6%
|
-10.4%
|
0.8%
|
|
Honda
|
83,371
|
170,217
|
92,860
|
-51.0%
|
-46.9%
|
-10.2%
|
1.0%
|
|
Hyundai
|
63,040
|
86,835
|
66,001
|
-27.4%
|
-21.4%
|
-4.5%
|
7.5%
|
|
Kia
|
50,714
|
72,881
|
56,866
|
-30.4%
|
-24.6%
|
-10.8%
|
0.3%
|
|
Nissan
|
53,846
|
87,667
|
61,645
|
-38.6%
|
-33.5%
|
-12.7%
|
-1.7%
|
|
Stellantis
|
111,246
|
162,041
|
118,354
|
-31.3%
|
-25.6%
|
-6.0%
|
5.7%
|
|
Subaru
|
46,221
|
55,170
|
44,042
|
-16.2%
|
-9.2%
|
4.9%
|
18.1%
|
|
Tesla
|
47,312
|
28,790
|
48,415
|
64.3%
|
78.0%
|
-2.3%
|
9.9%
|
|
Toyota
|
170,085
|
204,785
|
164,585
|
-16.9%
|
-10.0%
|
3.3%
|
16.3%
|
|
Volkswagen
Group
|
51,118
|
67,738
|
45,293
|
-24.5%
|
-18.2%
|
12.9%
|
27.0%
|
|
Industry
|
1,062,452
|
1,402,283
|
1,120,603
|
-24.2%
|
-17.9%
|
-5.2%
|
6.7%
|
|
Fleet Unit
Sales
|
|
|
|
Manufacturer
|
May 2022
Forecast
|
May 2021
Actual
|
Apr 2022
Actual
|
YoY %
Change
|
YoY % Change
(Daily Selling Rate)
|
MoM %
Change
|
MoM %
Change (Daily Selling
Rate)
|
|
BMW
|
565
|
1,730
|
510
|
-67.3%
|
-64.6%
|
10.7%
|
24.6%
|
|
Daimler
|
1,046
|
1,207
|
635
|
-13.3%
|
-6.1%
|
64.6%
|
85.2%
|
|
Ford
|
44,845
|
35,959
|
32,759
|
24.7%
|
35.1%
|
36.9%
|
54.0%
|
|
GM
|
40,122
|
31,962
|
26,451
|
25.5%
|
36.0%
|
51.7%
|
70.6%
|
|
Honda
|
1,028
|
6,598
|
390
|
-84.4%
|
-83.1%
|
163.6%
|
196.5%
|
|
Hyundai
|
105
|
6,910
|
706
|
-98.5%
|
-98.4%
|
-85.1%
|
-83.3%
|
|
Kia
|
4,092
|
7,417
|
2,197
|
-44.8%
|
-40.2%
|
86.2%
|
109.5%
|
|
Nissan
|
11,064
|
22,707
|
13,023
|
-51.3%
|
-47.2%
|
-15.0%
|
-4.4%
|
|
Stellantis
|
28,054
|
20,925
|
24,724
|
34.1%
|
45.2%
|
13.5%
|
27.7%
|
|
Subaru
|
1,254
|
1,388
|
1,706
|
-9.6%
|
-2.1%
|
-26.5%
|
-17.3%
|
|
Tesla
|
540
|
-
|
17
|
|
|
3170.3%
|
3579.1%
|
|
Toyota
|
18,552
|
36,218
|
21,925
|
-48.8%
|
-44.5%
|
-15.4%
|
-4.8%
|
|
Volkswagen
Group
|
789
|
4,789
|
656
|
-83.5%
|
-82.2%
|
20.2%
|
35.2%
|
|
Industry
|
159,338
|
184,465
|
133,994
|
-13.6%
|
-6.4%
|
18.9%
|
33.8%
|
|
Fleet
Penetration
|
|
Manufacturer
|
May 2022
Forecast
|
May 2021
Actual
|
Apr 2022
Actual
|
YoY %
Change
|
MoM %
Change
|
|
BMW
|
1.9%
|
4.4%
|
1.8%
|
-56.7%
|
7.3%
|
|
Daimler
|
3.2%
|
4.1%
|
2.0%
|
-22.3%
|
57.4%
|
|
Ford
|
26.1%
|
22.4%
|
18.6%
|
16.4%
|
40.1%
|
|
GM
|
20.4%
|
13.3%
|
13.2%
|
53.4%
|
55.2%
|
|
Honda
|
1.2%
|
3.7%
|
0.4%
|
-67.4%
|
191.2%
|
|
Hyundai
|
0.2%
|
7.4%
|
1.1%
|
-97.7%
|
-84.3%
|
|
Kia
|
7.5%
|
9.2%
|
3.7%
|
-19.2%
|
100.7%
|
|
Nissan
|
17.0%
|
20.6%
|
17.4%
|
-17.1%
|
-2.3%
|
|
Stellantis
|
20.1%
|
11.4%
|
17.3%
|
76.1%
|
16.5%
|
|
Subaru
|
2.6%
|
2.5%
|
3.7%
|
7.6%
|
-29.1%
|
|
Tesla
|
1.1%
|
0.0%
|
0.0%
|
|
3209.9%
|
|
Toyota
|
9.8%
|
15.0%
|
11.8%
|
-34.6%
|
-16.3%
|
|
Volkswagen
Group
|
1.5%
|
6.6%
|
1.4%
|
-77.0%
|
6.4%
|
|
Industry
|
13.0%
|
11.6%
|
10.7%
|
12.2%
|
22.1%
|
|
Total Market
Share
|
|
Manufacturer
|
May 2022
Forecast
|
May 2021
Actual
|
Apr 2022
Actual
|
|
BMW
|
2.4%
|
2.5%
|
2.3%
|
|
Daimler
|
2.7%
|
1.8%
|
2.5%
|
|
Ford
|
14.1%
|
10.1%
|
14.0%
|
|
GM
|
16.1%
|
15.1%
|
16.0%
|
|
Honda
|
6.9%
|
11.1%
|
7.4%
|
|
Hyundai
|
5.2%
|
5.9%
|
5.3%
|
|
Kia
|
4.5%
|
5.1%
|
4.7%
|
|
Nissan
|
5.3%
|
7.0%
|
6.0%
|
|
Stellantis
|
11.4%
|
11.5%
|
11.4%
|
|
Subaru
|
3.9%
|
3.6%
|
3.6%
|
|
Tesla
|
3.9%
|
1.8%
|
3.9%
|
|
Toyota
|
15.4%
|
15.2%
|
14.9%
|
|
Volkswagen
Group
|
4.2%
|
4.6%
|
3.7%
|
|
96.0%
|
95.3%
|
95.7%
|
|
Retail Market
Share
|
|
Manufacturer
|
May 2022
Forecast
|
May 2021
Actual
|
Apr 2022
Actual
|
|
BMW
|
2.7%
|
2.7%
|
2.5%
|
|
Daimler
|
3.0%
|
2.0%
|
2.7%
|
|
Ford
|
12.0%
|
8.9%
|
12.8%
|
|
GM
|
14.7%
|
14.8%
|
15.6%
|
|
Honda
|
7.8%
|
12.1%
|
8.3%
|
|
Hyundai
|
5.9%
|
6.2%
|
5.9%
|
|
Kia
|
4.8%
|
5.2%
|
5.1%
|
|
Nissan
|
5.1%
|
6.3%
|
5.5%
|
|
Stellantis
|
10.5%
|
11.6%
|
10.6%
|
|
Subaru
|
4.4%
|
3.9%
|
3.9%
|
|
Tesla
|
4.5%
|
2.1%
|
4.3%
|
|
Toyota
|
16.0%
|
14.6%
|
14.7%
|
|
Volkswagen
Group
|
4.8%
|
4.8%
|
4.0%
|
|
96.1%
|
95.1%
|
95.9%
|
|
ATP
|
|
|
|
Manufacturer
|
May 2022
Forecast
|
May 2021
Actual
|
Apr 2022
Actual
|
YOY
|
MOM
|
|
BMW
|
$67,092
|
$60,621
|
$68,146
|
10.7%
|
-1.5%
|
|
Daimler
|
$65,924
|
$61,985
|
$68,337
|
6.4%
|
-3.5%
|
|
Ford
|
$51,037
|
$43,388
|
$49,070
|
17.6%
|
4.0%
|
|
GM
|
$50,566
|
$46,352
|
$50,420
|
9.1%
|
0.3%
|
|
Honda
|
$37,352
|
$32,145
|
$36,550
|
16.2%
|
2.2%
|
|
Hyundai
|
$36,958
|
$31,800
|
$37,190
|
16.2%
|
-0.6%
|
|
Kia
|
$35,091
|
$30,179
|
$34,719
|
16.3%
|
1.1%
|
|
Nissan
|
$36,156
|
$31,031
|
$35,810
|
16.5%
|
1.0%
|
|
Stellantis
|
$53,370
|
$46,593
|
$53,466
|
14.5%
|
-0.2%
|
|
Subaru
|
$35,583
|
$32,307
|
$34,908
|
10.1%
|
1.9%
|
|
Toyota
|
$39,073
|
$36,641
|
$39,957
|
6.6%
|
-2.2%
|
|
Volkswagen
Group
|
$46,455
|
$43,928
|
$47,011
|
5.8%
|
-1.2%
|
|
Industry
|
$44,254
|
$38,694
|
$44,043
|
14.4%
|
0.5%
|
|
$5,560
|
|
$211
|
|
|
|
Incentives
|
|
|
|
Manufacturer
|
May 2022
Forecast
|
May 2021
Actual
|
Apr 2022
Actual
|
YOY
|
MOM
|
|
BMW
|
$1,117
|
$4,814
|
$1,309
|
-76.8%
|
-14.6%
|
|
Daimler
|
$1,452
|
$3,650
|
$1,354
|
-60.2%
|
7.2%
|
|
Ford
|
$1,435
|
$2,352
|
$1,458
|
-39.0%
|
-1.6%
|
|
GM
|
$1,677
|
$4,535
|
$1,926
|
-63.0%
|
-12.9%
|
|
Honda
|
$905
|
$2,133
|
$960
|
-57.6%
|
-5.7%
|
|
Hyundai
|
$704
|
$2,019
|
$775
|
-65.1%
|
-9.2%
|
|
Kia
|
$619
|
$2,483
|
$669
|
-75.1%
|
-7.5%
|
|
Nissan
|
$1,381
|
$3,698
|
$1,595
|
-62.7%
|
-13.5%
|
|
Stellantis
|
$1,892
|
$3,892
|
$1,925
|
-51.4%
|
-1.7%
|
|
Subaru
|
$737
|
$1,299
|
$719
|
-43.2%
|
2.5%
|
|
Toyota
|
$818
|
$2,246
|
$844
|
-63.6%
|
-3.0%
|
|
Volkswagen
Group
|
$1,155
|
$3,846
|
$1,252
|
-70.0%
|
-7.8%
|
|
Industry
|
$1,251
|
$3,055
|
$1,327
|
-59.1%
|
-5.8%
|
|
-$1,804
|
|
-$77
|
|
|
|
Incentives as % of
ATP
|
|
|
|
Manufacturer
|
May 2022
Forecast
|
May 2021
Actual
|
Apr 2022
Actual
|
YOY
|
MOM
|
|
BMW
|
1.7%
|
7.9%
|
1.9%
|
-79.0%
|
-13.3%
|
|
Daimler
|
2.2%
|
5.9%
|
2.0%
|
-62.6%
|
11.2%
|
|
Ford
|
2.8%
|
5.4%
|
3.0%
|
-48.1%
|
-5.4%
|
|
GM
|
3.3%
|
9.8%
|
3.8%
|
-66.1%
|
-13.2%
|
|
Honda
|
2.4%
|
6.6%
|
2.6%
|
-63.5%
|
-7.7%
|
|
Hyundai
|
1.9%
|
6.3%
|
2.1%
|
-70.0%
|
-8.6%
|
|
Kia
|
1.8%
|
8.2%
|
1.9%
|
-78.6%
|
-8.5%
|
|
Nissan
|
3.8%
|
11.9%
|
4.5%
|
-68.0%
|
-14.3%
|
|
Stellantis
|
3.5%
|
8.4%
|
3.6%
|
-57.5%
|
-1.5%
|
|
Subaru
|
2.1%
|
4.0%
|
2.1%
|
-48.5%
|
0.6%
|
|
Toyota
|
2.1%
|
6.1%
|
2.1%
|
-65.8%
|
-0.8%
|
|
Volkswagen
Group
|
2.5%
|
8.8%
|
2.7%
|
-71.6%
|
-6.6%
|
|
Industry
|
2.8%
|
7.9%
|
3.0%
|
-64.2%
|
-6.2%
|
|
Revenue
|
|
|
|
Manufacturer
|
May 2022
Forecast
|
May 2021
Actual
|
Apr 2022
Actual
|
YOY
|
MOM
|
|
Industry
|
$54,068,972,589
|
$61,398,057,586
|
$55,256,423,309
|
-11.9%
|
-2.1%
|
(Note: This industry insight is based solely on TrueCar,
Inc.'s analysis of domestic industry sales trends and conditions
and is not a projection of TrueCar, Inc.'s operations.)
About TrueCar
TrueCar is a leading automotive digital
marketplace that lets auto buyers and sellers connect to our
nationwide network of Certified Dealers. With access to an
expansive inventory provided by our Certified Dealers, we are
building the industry's most personalized and efficient auto
shopping experience as we seek to bring more of the process online.
Consumers who visit our marketplace will find a suite of vehicle
discovery tools, price ratings and market context on new, used and
Certified Pre-Owned vehicles. When they are ready, shoppers in
TrueCar's marketplace can connect with a Certified Dealer in our
network, who shares our belief that truth, transparency and
fairness are the foundation of a great auto shopping experience. As
part of our marketplace, TrueCar powers auto-buying programs for
over 250 leading brands, including AARP, Sam's Club, Navy Federal
Credit Union and American Express.
For more information, please visit www.truecar.com, and
follow us on Facebook or Twitter.
 View original content to download
multimedia:https://www.prnewswire.com/news-releases/truecar-releases-analysis-of-may-industry-sales-301555251.html
View original content to download
multimedia:https://www.prnewswire.com/news-releases/truecar-releases-analysis-of-may-industry-sales-301555251.html
SOURCE TrueCar.com