Apple Down Over 12%, on Pace for Largest Percent Decrease Since September 2008 -- Data Talk Update
March 16 2020 - 10:49AM
Dow Jones News
Apple Inc. (AAPL) is currently at $243.34, down $34.63 or
12.46%
-- Would be lowest close since Oct. 30, 2019, when it closed at
$243.26
-- On pace for largest percent decrease since Sept. 29, 2008,
when it fell 17.92%
-- The French Competition Authority said Monday that it has
imposed a fine of 1.1 billion euros ($1.22 billion) on Apple Inc.
for anticompetitive practices in its distribution network and the
"abuse of economic dependence" of its independent resellers. Apple
said it strongly disagreed with the fine and planned to appeal
-- On Saturday, Apple Inc. said all of its stores outside
Greater China would be closed until March 27 in light of the
worsening spread of the virus. Apple stores in China were open
Saturday, a sign of how the threat of the epidemic has shifted.
Apple said a retail employee at its Santa Monica, Calif., store
tested positive for the virus
-- Currently down three of the past four days
-- Down 10.98% month-to-date
-- Down 17.13% year-to-date
-- Down 25.63% from its all-time closing high of $327.20 on Feb.
12, 2020
-- Up 29.42% from 52 weeks ago (March 18, 2019), when it closed
at $188.02
-- Down 25.63% from its 52 week closing high of $327.20 on Feb.
12, 2020
-- Up 40.42% from its 52 week closing low of $173.30 on June 3,
2019
-- Traded as low as $241.31; lowest intraday level since Oct.
31, 2019, when it hit $237.26
-- Down 13.19% at today's intraday low; largest intraday percent
decrease since May 6, 2010, when it fell as much as 22.16%
-- Most active stock in the S&P 500 today
-- Most active stock in the Nasdaq 100 today
-- Subtracted 234.81 points from the DJIA so far today
All data as of 10:00:35 AM
Source: Dow Jones Market Data, FactSet
(END) Dow Jones Newswires
March 16, 2020 10:34 ET (14:34 GMT)
Copyright (c) 2020 Dow Jones & Company, Inc.
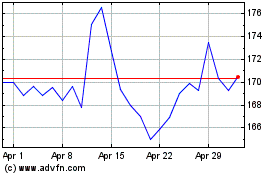
Apple (NASDAQ:AAPL)
Historical Stock Chart
From Mar 2024 to Apr 2024

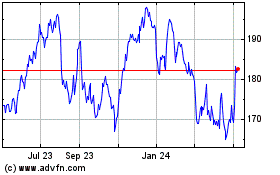
Apple (NASDAQ:AAPL)
Historical Stock Chart
From Apr 2023 to Apr 2024
