Hong Kong Leads Global Markets Higher -- Update
June 01 2020 - 4:09AM
Dow Jones News
By Xie Yu and Anna Isaac
European stocks opened higher Monday, following gains in Asia.
The pan-continental Stoxx Europe 600 rose 1%, joined in positive
territory by other region indexes including the FTSE 100 and the
France CAC 40.
U.S. stock futures tied to the S&P 500 climbed 0.3%. The
yield on the 10-year U.S. Treasury note fell to 0.671% from 0.703%
Friday.
This came as the worst civil unrest in decades took place in
cities across the U.S. at the weekend. Demonstrations were sparked
by anger at the death of George Floyd, a black man in Minneapolis
police custody. Protesters torched vehicles, smashed windows and
defaced buildings.
Hong Kong's benchmark stock index led international markets
higher, signaling investors' relief that President Trump has
refrained from definitive steps targeting the city or mainland
China.
In afternoon trading in Hong Kong, the city's Hang Seng Index
surged 3.4%. In mainland China, the benchmark Shanghai Composite
added 2.2%. In South Korea, the Kospi rose 1.8%, while Japan's
Nikkei 225 rose 0.8%.
Market moves indicated a Friday statement by Mr. Trump on Hong
Kong wasn't perceived as overly negative, likely because it didn't
contain concrete measures on the phase-one China-U.S. trade deal or
on Hong Kong sanctions, said Martin Hennecke, Asia investment
director with St. James's Place Wealth Management.
Mr. Trump said Friday the decision to stop treating Hong Kong as
semiautonomous from Beijing would affect issues such as extradition
arrangements, trade in certain high-technology products, and advice
to U.S. travelers, but he stopped short of announcing specific
actions.
Mr. Hennecke said Hong Kong was to some extent benefiting from
U.S.-China tensions, which had helped create strong demand for
secondary listings from Chinese companies that are already listed
in the U.S.
Alex Au, managing director at Alphalex Capital Management, a
hedge fund based in Hong Kong, said markets were boosted by relief
that the U.S. hadn't taken tougher measures, which could
potentially have devastated the Hong Kong economy and had wider
regional effects.
"The short-term overhang is removed," he said.
Indexes in mainland China rose, even after weekend data
suggested recent factory activity was weaker than expected.
The official manufacturing purchasing managers index eased to
50.6 in May from 50.8 in April. That was still above the 50-point
mark that separates expansion from contraction, but undershot the
51.5 consensus forecast of economists polled by The Wall Street
Journal.
The Chinese yuan was little changed in both onshore and offshore
markets, strengthening slightly offshore to trade at 7.1320 a
dollar. The offshore yuan briefly weakened beyond 7.19 last week --
nearing record lows -- before regaining some ground.
Last week, Chinese authorities signaled their tolerance for a
weaker currency by setting daily reference points for onshore
trading of the yuan against the dollar at levels last seen in 2008.
On Monday, the People's Bank of China set the midprice for the
onshore yuan at 7.1315, little changed from Friday's fixing at
7.1316.
Monday's start-of-month rallies helped some markets in the
Asia-Pacific region build on their robust recent performance, as
they reversed some of the first quarter's steep losses.
Over April and May, Japan's Nikkei 225, South Korea's Kospi
Composite and Australia's S&P/ASX 200 enjoyed their best
two-month percentage gains since 1995, 2009 and 1994, respectively,
according to Dow Jones Market Data. The Hang Seng has lagged
recently, however, falling 6.8% in May.
Likewise, the S&P 500 edged up Friday to close out its best
two-month performance since 2009, as investors were encouraged by
states and businesses around the U.S. reopening.
Write to Xie Yu at Yu.Xie@wsj.com and Anna Isaac at
anna.isaac@wsj.com
(END) Dow Jones Newswires
June 01, 2020 03:54 ET (07:54 GMT)
Copyright (c) 2020 Dow Jones & Company, Inc.
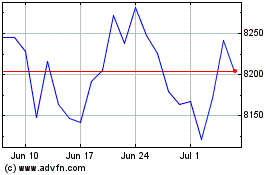
FTSE 100
Index Chart
From Mar 2024 to Apr 2024

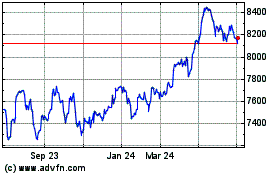
FTSE 100
Index Chart
From Apr 2023 to Apr 2024
