Ripple Price Analysis: Break Above 100 SMA Could Push XRP Higher
December 12 2018 - 12:00AM
NEWSBTC
Key Highlights Ripple price declined recently and traded towards
the $0.2910 level against the US dollar. This week’s followed major
bearish trend line is in place with resistance at $0.2975 on the
hourly chart of the XRP/USD pair (data source from Kraken). The
pair must break the $0.3000 resistance and the 100 hourly simple
moving...
The post
Ripple Price Analysis: Break Above 100 SMA Could Push XRP
Higher appeared first on NewsBTC.
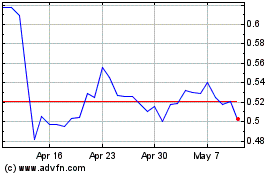
Ripple (COIN:XRPUSD)
Historical Stock Chart
From Mar 2024 to Apr 2024

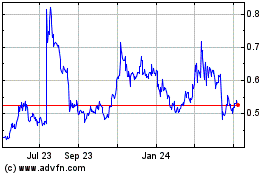
Ripple (COIN:XRPUSD)
Historical Stock Chart
From Apr 2023 to Apr 2024
