Ethereum on the Cusp of Capitulation as Top Traders Eye a Move to Key Support
March 25 2020 - 6:00PM
NEWSBTC
Ethereum has been closely tracking Bitcoin’s price action over the
past day, which has led it to once again enter a consolidatory
phase within the mid-$130 region. This bout of sideways trading
closely follows the crypto’s recent rally that sent it surging
towards its key resistance at $140. In the near-term, analysts are
noting that...
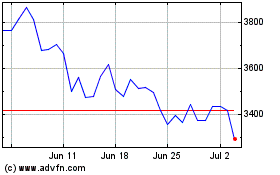
Ethereum (COIN:ETHUSD)
Historical Stock Chart
From Mar 2024 to Apr 2024

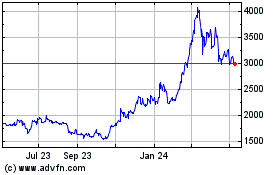
Ethereum (COIN:ETHUSD)
Historical Stock Chart
From Apr 2023 to Apr 2024
