Press Release: Strong 2021 sales and business EPS growth
enabling increased investment in R&D
Strong 2021 sales and business
EPS(1) growth enabling increased
investment in R&D
Paris, February 4, 2022
Q4 2021 sales growth of 4.1% and business
EPS(1) growth of 9.8%
at CER
- Specialty Care advanced to the largest business unit by sales
(€ 3,487 million, +21.3%), driven by Dupixent®
(+53.1%)
- Vaccines -6.5% despite strong Europe sales, reflecting low 2021
U.S. influenza vaccination rates and record shipments in Q3
- General Medicines core assets up 2.1%, while GBU sales
decreased (-3.8%) mainly due to prioritization and
divestitures
- CHC continued growth momentum (+5.6%), driven by Cough and
Cold, Pain care and Digestive Wellness categories
Full-year 2021 delivered 7.1% sales growth and 15.5%
business EPS at CER
- Sales grew to €37,761 million driven by Dupixent®
(€5,249 million, +52.7%) and Vaccines (€6,323 million, +6.8%)
- BOI margin reached 28.4% up 1.3 ppts reflecting improvement in
gross margin and continued SG&A expense management
- Sanofi generated cost savings of €2.410 billion over the period
2020 and 2021, mainly reinvested to drive growth
- Business EPS(1) of €6.56, up 11.9% on a reported
basis and 15.5% at CER
- IFRS EPS of €4.97 (down 49.3%), reflecting capital gain from
sales of Regeneron in 2020.
- Free Cash Flow(2) reached €8,096 million, doubled
over the last three years and exceeding guidance for 2022
- Board held on February 3, proposes annual dividend of €3.33, an
increase of 4.1%
Progress on Corporate Social Responsibility
strategy
- Sanofi Health unit and Medtronic Labs to collaborate to expand
access to healthcare in low to middle income countries
- Strong set of accomplishments across CSR priorities in our 4
Play to Win pillars including the creation of Sanofi Global Health
and 2 pre-clinical studies started on assets for pediatric
cancers
Key milestone and regulatory achievements on R&D
transformation
- Dupixent® approved in the U.S. for the treatment of
moderate-to-severe asthma for children aged 6 to 11 years
- Dupixent® reported positive pivotal trial results in
prurigo nodularis and eosinophilic esophagitis
- COVID-19 recombinant booster candidate showed consistently
strong immune responses regardless of primary vaccine received
- Early stage pipeline significantly strengthened with seven
projects entering phase 1 and seven added to phase 2
- Agreement to acquire Amunix, an immuno-oncology company, adding
pipeline with conditionally activated biologics
- Acquisition of Origimm, a biotechnology company specialized in
research of skin diseases
2022 financial outlook
- Sanofi expects 2022 business EPS(1) to grow low
double-digit(3) at CER, barring unforeseen major adverse
events. Applying average January 2022 exchange rates, the positive
currency impact on 2022 business EPS is estimated to be between +2%
to +3%.
Sanofi Chief Executive Officer, Paul Hudson,
commented:
“Sanofi has closed 2021 with a strong
performance in the fourth quarter driven by high double-digit sales
growth of Dupixent®, which continues
to set impressive record sales quarter after quarter. This quarter
marks the first time Specialty Care has led our GBUs by sales,
highlighting a significant milestone in our transformation. At the
same time, Vaccines delivered another year of record influenza
sales and is on a clear growth path as demonstrated at our recent
Vaccines Day. In R&D, we continue to be relentless in our
commitment to expand our innovative pipeline. Last quarter, Sanofi
achieved a new milestone, a first in recent years, by moving seven
molecules into Phase 1 and seven pipeline programs into Phase 2
trials, showcasing our success in rapidly advancing potentially
transformative medicines. We further strengthened our R&D
capabilities with a series of value creating M&A transactions
in 2021. Our excellent financial performance validates our ability
to increase profitability through improved product mix, supported
by expense management and the reinvestment of savings behind our
growth drivers, all of which puts us on a trajectory to achieving
our 2022 financial targets.“
| |
Q4 2021 |
Change |
Change
at CER |
2021 |
Change |
Change
at CER |
| IFRS net sales
reported |
€9,994m |
+6.5% |
+4.1% |
€37,761m |
+4.8% |
+7.1% |
| IFRS net income
reported(4) |
€1,131m |
+6.0% |
_ |
€6,223m |
-49.4% |
— |
|
IFRS EPS reported |
€0.90 |
+5.9% |
_ |
€4.97 |
-49.3% |
— |
|
Free cash flow(2) |
€2,541m |
+66.1% |
_ |
€8,096m |
+16.0% |
— |
| Business
operating income |
€2,256m |
+9.9% |
+6.9% |
€10,714m |
+9.8% |
+13.3% |
| Business net
income(1) |
€1,730m |
+13.3% |
+10.2% |
€8,213m |
+11.8% |
+15.5% |
|
Business EPS(1) |
€1.38 |
+13.1% |
+9.8% |
€6.56 |
+11.9% |
+15.5% |
Changes in net sales are expressed at constant exchange
rates (CER) unless otherwise indicated (definition in Appendix
9)
(1) In order to facilitate an understanding
of operational performance, Sanofi comments on the business net
income statement. Business net income is a non-GAAP financial
measure (definition in Appendix 9). The consolidated income
statement for Q4 2021 is provided in Appendix 3 and a
reconciliation of reported IFRS net income to business net income
is set forth in Appendix 4; (2) Free cash flow is a non-GAAP
financial measure (definition in Appendix 9); (3) 2021 business EPS
was €6.56; (4) 2020 IFRS net income reported reflected capital gain
from sales of Regeneron shares in Q2 2020)
2021 fourth-quarter and full-year Sanofi sales
----------------------------
Unless otherwise indicated, all percentage changes in sales in
this press release are stated at
CER1
----------------------------
In the fourth quarter of 2021, Sanofi sales were
€9,994 million, up 6.5% on a reported basis. Exchange rate
movements had a positive effect of 2.4 percentage points, mainly
due to the U.S. dollar. At CER, company sales were up 4.1%.
In 2021 Sanofi sales reached €37,761 million, up 4.8% on a reported
basis. Exchange rate movements had a negative effect of 2.3
percentage points. At CER, company sales were up 7.1%.
Global Business Units
Fourth-quarter 2021 net sales by Global
Business Unit (variation at CER; € million; % of total
sales)

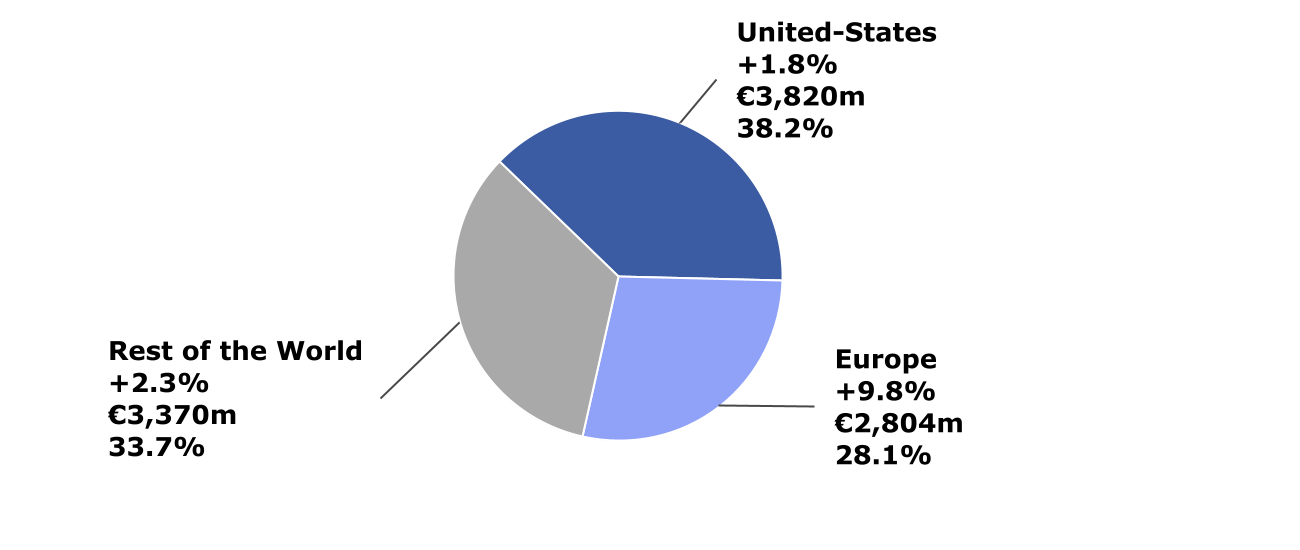
Fourth-quarter 2021 net sales by
geographic region (variation at CER; € million; % of total
sales)
Fourth-quarter 2021 operating
income
Fourth-quarter business operating
income (BOI) increased 9.9% to €2,256 million. At CER, BOI
increased 6.9%. The ratio of BOI to net sales increased 0.7
percentage points to 22.6% (22.5% at CER). In 2021, BOI increased
9.8% to €10,714 million. At CER, BOI increased 13.3%. The ratio of
business operating income to net sales increased 1.3 percentage
points to 28.4% (28.6% at CER).
Pharmaceuticals
Fourth-quarter 2021 Pharmaceutical sales
increased 7.4% to €6,919 million, mainly driven by the Specialty
Care portfolio (up 21.3%) with continued strong performance of
Dupixent® while sales in General Medicines decreased
3.8%. In 2021, Pharmaceuticals sales increased 7.6% to €26,970
million reflecting the strong performance of Specialty Care and
General Medicines core assets.
Specialty Care
Dupixent
|
Net sales (€ million) |
Q4 2021 |
Change
at CER |
2021 |
Change
at CER |
|
Total Dupixent® |
1,549 |
+53.1% |
5,249 |
+52.7% |
In the fourth quarter,
Dupixent® (collaboration with
Regeneron) sales increased 53.1% to €1,549 million. In the U.S.,
Dupixent® sales of €1,170 million (up 45.8%) were driven
by continued strong demand in atopic dermatitis (AD) in adults,
adolescents, and children aged 6 to 11 years, and continued uptake
in asthma and chronic rhinosinusitis with nasal polyposis (CRSwNP).
Dupixent® total prescriptions (TRx) increased 44%
(year-over-year) and new-to-brand prescriptions (NBRx)
grew 32% despite fewer in-person patient visits to HCP offices,
which remain slightly below the pre-COVID level. In Europe,
fourth-quarter Dupixent® sales grew 60.9% to €187
million reflecting continued growth in AD and additional launches
in younger population in AD, asthma and CRSwNP. In Japan, part of
the Rest of the world region, sales were €85 million (up
53.4%).
In 2021, Dupixent® sales reached
€5,249 million, (up 52.7%), of which €3.971 million were generated
in the U.S. (up 46.2%). Each of the two regions Europe and the Rest
of the World generated approximately 50% of the non-U.S. sales in
the period.
Neurology and Immunology
| Net sales
(€ million) |
Q4 2021 |
Change
at CER |
2021 |
Change
at CER |
|
Aubagio® |
478 |
-1.9% |
1,955 |
-1.8% |
|
Lemtrada® |
19 |
-14.3% |
82 |
-24.8% |
|
Kevzara® |
91 |
+48.3% |
287 |
+23.7% |
|
Total Neurology and Immunology |
588 |
+3.1% |
2,324 |
-0.3% |
In the fourth quarter, Neurology and
Immunology sales grew 3.1% to €588 million, reflecting
strong Kevzara® sales which were partially offset by
lower Aubagio® sales. In 2021, overall Neurology and
Immunology sales remained stable.
Aubagio® sales
decreased 1.9% in the fourth quarter to €478 million due to lower
sales in the U.S. reflecting increased competition partially offset
by higher sales in Europe.
Fourth-quarter
Kevzara® (collaboration with Regeneron)
sales increased 48.3% to €91 million due to an increase in global
demand for IL-6 receptor blockers and the temporary tocilizumab
shortage.
Rare Disease
| Net sales
(€ million) |
Q4 2021 |
Change
at CER |
2021 |
Change
at CER |
| Myozyme®
/ Lumizyme® |
254 |
+5.5% |
1,003 |
+7.7% |
|
Nexviazyme® |
15 |
ns |
17 |
ns |
|
Fabrazyme® |
223 |
+9.0% |
844 |
+6.5% |
|
Cerezyme® |
181 |
+13.1% |
683 |
+3.9% |
|
Aldurazyme® |
63 |
+7.0% |
243 |
+7.3% |
|
Cerdelga® |
67 |
+11.9% |
254 |
+11.1% |
|
Others Rare Disease |
15 |
-34.8% |
82 |
-3.4% |
|
Total Rare Disease |
818 |
+9.5% |
3,126 |
+7.0% |
In the fourth quarter, Rare
Disease sales increased 9.5% to €818 million driven by
Pompe, Gaucher and Fabry franchises performance. In 2021, sales of
Rare Disease increased 7.0% reflecting increased patient demand
across the portfolio across all three geographic regions. The Pompe
franchise reached more than €1 billion of sales in 2021.
Fourth-quarter sales of the Pompe
franchise (Myozyme/Lumizyme® +
Nexviazyme®) increased 11.9% to €269 million primarily
by new patient accruals across geographic regions.
Myozyme®/Lumizyme®
sales increase at 5.5% to €254 million. Sales of
Nexviazyme® (which was
launched in the US and Japan) were €15 million in the fourth
quarter (€17 million in 2021).
Sales of the Gaucher franchise
(Cerezyme® + Cerdelga®) increased 12.8% (to
€248 million) in the fourth quarter. Over the period,
Cerezyme® sales increased 13.1% to €181
million, reflecting strong growth in the Rest of the World region.
In Europe and the U.S., Cerezyme® sales were down 1.6%
and 2.3%, respectively while Cerdelga®
sales were up 11.9% globally driven by switches and new patient
accruals in Europe and the U.S.
Fourth-quarter
Fabrazyme® sales increased 9.0% to €223
million driven by higher demand in Europe and the Rest of the World
region and higher inventory in Europe.
Oncology
| Net sales
(€ million) |
Q4 2021 |
Change
at CER |
2021 |
Change
at CER |
|
Jevtana® |
110 |
-16.8% |
455 |
-12.3% |
|
Sarclisa® |
54 |
+112.0% |
176 |
+318.6% |
|
Fasturtec® |
41 |
+2.6% |
152 |
+2.0% |
|
Libtayo® |
35 |
+78.9% |
129 |
+91.0% |
|
Total Oncology |
240 |
+10.3% |
912 |
+16.9% |
Fourth-quarter and full-year 2021 sales of
Oncology increased 10.3% (to €240 million) and
16.9%, respectively, driven by the Sarclisa® and
Libtayo® launches which more than offset the impact of
Jevtana® generic competition in Europe.
Fourth-quarter
Jevtana® sales decreased 16.8% to €110
million following the entry of generic competition in certain
European markets (down 66.0%) at the end of March 2021. In the
U.S., sales were up 13.3%, where the Jevtana®
composition of matter patent has expired in September 2021.
However, Sanofi has filed patent infringement suits against generic
filers on Jevtana® under Hatch-Waxman in the U.S.
District Court for the District of Delaware asserting three method
of use patents, two of which (US 10,583,110 and US 10, 716,777)
expire in October 2030 and the other one (US 8,927,592) expires in
April 2031 including 6-month pediatric exclusivities. Sanofi has
reached settlement agreements with some of the defendants and the
suit against the remaining defendants is ongoing. No trial dates
have been scheduled and the remaining defendants have agreed not to
launch any generic cabazitaxel product until the earlier of a
district court decision in favor of the defendants or four months
after the completion of the post-trial briefing. Separately,
Jevtana® has been granted a data
exclusivity on the CARD clinical study results which expires in
December 2023.
Fourth-quarter
Sarclisa® sales were €54 million
(versus €25 million in the fourth quarter of 2020) driven by
continued launch execution in Europe (€20 million), sales growth in
the U.S. (€21 million) and in the Rest of the World region (€13
million) where sales performance was driven by the uptake in
Japan.
Libtayo®
(collaboration with Regeneron) sales were €35 million (up 78.9%) in
the fourth quarter driven by increased demand in metastatic
cutaneous squamous cell carcinoma (CSCC) as well as additional
country launches. Libtayo® sales in the U.S. are
reported by Regeneron.
Rare Blood Disorders
| Net
sales (€ million) |
Q4 2021 |
Change
at CER |
2021 |
Change
at CER |
|
Eloctate® |
141 |
-12.2% |
563 |
-8.5% |
|
Alprolix® |
113 |
-16.0% |
414 |
-7.9% |
|
Cablivi® |
38 |
+23.3% |
164 |
+47.8% |
|
Total Rare Blood Disorders |
292 |
-10.4% |
1,141 |
-3.0% |
In the fourth quarter, Rare Blood
Disorders franchise sales decreased 10.4% (€292 million).
Excluding industrial sales to Sobi, fourth-quarter sales were up
2.7% mainly driven by Cablivi® and Alprolix®.
Industrial sales (of Eloctate® and Alprolix®)
to Sobi were significantly lower in 2021 than in 2020 due to a
change in the supply agreement which resulted in unusually high
industrial sales to Sobi in 2020. In 2021 sales of Rare Blood
Disorders decreased 3.0% and were up 8.0.% when excluding
industrial sales to Sobi.
Eloctate® sales were
€141 million in the fourth quarter, down 12.2%. Excluding
industrial sales to Sobi, Eloctate sales were down 4.4% due to
lower U.S. sales (-3.9%) mainly reflecting inventory fluctuation.
Sales in the Rest of the World region were down 28.3% reflecting
lower industrial sales to Sobi (which are recorded in this
region).
Fourth-quarter
Alprolix® sales were down 16.0% to €113
million. Excluding industrial sales to Sobi, Alprolix®
sales were up 6.3%. In the U.S. sales were up 5.1%. Sales in the
Rest of the World were down 48.1% reflecting lower industrial sales
to Sobi (which are recorded in this region).
Cablivi® sales
increased by 23.3% to €38 million in the fourth quarter driven by
launches in Europe (up 50.0% to €19 million). In the U.S., sales of
the product were stable at €19 million, with the COVID-19
environment impacting treatment initiations at the hospital
level.
General Medicines
Fourth quarter General Medicines sales decreased
3.8% to €3,432 million and 2.3% excluding portfolio streamlining
and Praluent® U.S. sales. The growth of core
assets2 (up 2.1% to €1,429 million and up 3.9% excluding
Praluent® U.S. sales) was driven by Multaq®,
Plavix® and RezurockTM (consolidated from
November 9). The non-core assets sales decreased 7.6% (to €1,783
million) mainly reflecting lower Generics sales and portfolio
streamlining (-1.4 ppt impact).
In 2021, General Medicines sales were down 1.4%
to €14,218 million and up 0.4% excluding portfolio streamlining and
Praluent® U.S. sales. In 2021, sales of the core assets
were €5,768 million up 5.6% (and up 7.6% excluding
Praluent® U.S. sales), driven by double-digit growth of
Lovenox®, Mozobil® and
Thymoglobulin® as well as Toujeo®
performance. Non-core assets sales were €7,642 million, down 6.2%
reflecting portfolio streamlining (-1.8 ppt), as well as lower
Lantus®, Aprovel®/Avapro® and
Generics sales.
Diabetes
| Net sales
(€ million) |
Q4 2021 |
Change
at CER |
2021 |
Change
at CER |
|
Lantus® |
583 |
-2.9% |
2,494 |
-3.8% |
|
Toujeo® |
230 |
+1.8% |
969 |
+6.4% |
| Total
glargine |
813 |
-1.6% |
3,463 |
-1.2% |
|
Soliqua® |
54 |
+13.0% |
195 |
+24.2% |
|
Other diabetes |
224 |
-3.9% |
877 |
-3.7% |
|
Total Diabetes |
1,091 |
-1.5% |
4,535 |
-0.8% |
In the fourth quarter, global
Diabetes sales decreased 1.5% to €1,091 million,
reflected lower sales in Europe (down 4.0%) and the Rest of the
World (down 8.8%), partially offset by growth in the U.S. (up
10.4%). In 2021, Diabetes sales were down 0.8% mainly as a result
of lower Lantus® sales partially offset by growth from
Toujeo® and Soliqua®.
Fourth-quarter
Toujeo® sales increased 1.8% to €230
million due to growth in the U.S. and Europe, partially offset by
lower sales in the Rest of the World reflecting price and inventory
adjustment in anticipation of the Volume Based Procurement (VBP)
for insulins in China which will be implemented in the first half
of 2022.
Sanofi has participated in the VBP tender for
basal insulin analogues in China in November and was among the
bidding winners in the group A with
Lantus®/Toujeo® and then has secured a
significant volumes of its long-acting insulins at the hospital
level. In 2022, Sanofi expects that its glargine sales to decrease
by around 30% in China, benefiting from high volumes at
significantly lower prices. Toujeo®/Lantus®
sales were €459 million in China in 2021.
Lantus® sales were
€583 million, down 2.9% in the fourth quarter, due to lower sales
in Europe and China partially offset by growth in the U.S. In
China, sales reflected price and inventory adjustment in
anticipation of the insulin VBP.
Fourth-quarter
Soliqua® sales increased 13.0% to €54
million driven by growth in all three geographic regions. In the
Rest of World region, Soliqua® sales grew 30.0%
supported by new launches.
Cardiovascular and Established Rx Products
| Net
sales (€ million) |
Q4 2021 |
Change
at CER |
2021 |
Change
at CER |
|
Lovenox®* |
335 |
-7.9% |
1,486 |
+12.0% |
|
Plavix®* |
222 |
+7.5% |
929 |
+2.4% |
|
Aprovel®/Avapro® |
112 |
-6.1% |
419 |
-24.5% |
|
Thymoglobulin® |
87 |
+5.0% |
350 |
+13.3% |
|
Multaq® |
99 |
+20.3% |
329 |
+8.3% |
|
Praluent® |
55 |
-15.9% |
218 |
-15.8% |
|
Mozobil® |
63 |
+3.4% |
233 |
+10.7% |
| Generics |
133 |
-30.9% |
699 |
-7.7% |
|
Other |
1,015 |
-2.9% |
4,212 |
-4.5% |
|
Total Cardiovascular and Established Rx
Products |
2,121 |
-4.5% |
8,875 |
-1.8% |
*Excluding Auto generics
In the fourth quarter, Cardiovascular
and Established Rx Products sales
decreased 4.5% to €2,121 million. The performance of certain core
assets, including Plavix®, Praluent® and
Multaq® and the addition of Rezurock® was
more than offset by lower sales of Lovenox® and Generics
as well as the impact of the divestments of non-core products. In
2021, Cardiovascular and Established Rx Products sales were down
1.8% (down 0.7% excluding Praluent® U.S. sales) impacted
by lower Aprovel®/Avapro® and generics sales
as well as the impact of the divestments which offset strong growth
of several core assets.
Fourth-quarter
Lovenox® sales decreased 7.9% to €335
million, reflected high base of comparison in the fourth quarter of
2020 when WHO guidelines recommending the use of low molecular
weight heparins in hospitalized COVID-19 patients came into effect.
In addition, supply limitations and biosimilar competition in
Europe (down 11.1%) affected the performance.
Plavix® sales were
up 7.5% in the fourth quarter to €222 million due to higher sales
in the Rest of the World region (up 11.4%) driven by China (up
28.1% to €88 million) largely offsetting lower sales in Japan and
Europe.
Fourth-quarter
Aprovel®/Avapro®
sales were down 6.1% to €112 million.
Fourth-quarter
Praluent® sales decreased 15.9% to €55
million, reflecting the restructuring of the collaboration with
Regeneron effective April 1, 2020. Sanofi has sole responsibility
for Praluent® outside the U.S. while Regeneron has sole
responsibility for Praluent® in the U.S. Excluding U.S.
sales in the comparable quarter last year, higher
Praluent® sales (up 35.9%) were driven by strong
performance in Europe. In China, Praluent® is listed on
the NDRL (National Reimbursement Drug List) as of January 2022.
Multaq® fourth
quarter sales grew 20.3% to €99 million, reflecting strong U.S.
sales growth.
Sales of RezurockTM,
a recently FDA-approved, first-in-class treatment for chronic
graft-versus-host disease (cGVHD) for adult and pediatric patients
12 years and older who have failed at least two prior lines of
systemic therapy, were consolidated as of November 9 (through the
Kadmon acquisition) and generated €20 million since that date.
Pharmaceuticals business operating
income
In the fourth quarter, business
operating income (BOI) of Pharmaceuticals increased 16.4%
to €2,091 million (up 12.5% at CER). The ratio of BOI to net sales
increased by 1.7 percentage points to 30.2% (29.9% at CER),
reflecting an improvement of the gross margin ratio. In 2021,
business operating income of Pharmaceuticals increased 2.2% to
€9,409 million (up 4.9% at CER). The ratio of BOI to net sales
decreased by 1.0 percentage points to 34.9% (35.0% at CER)
reflecting strong investments behind Dupixent® partly
offset by an improvement in overall gross margin ratio.
Vaccines
| Net
sales (€ million) |
Q4 2021 |
Change
at CER |
2021 |
Change
at CER |
Polio/Pertussis/Hib vaccines
(incl. Hexaxim® /
Hexyon®,
Pentacel®,
Pentaxim® and
Imovax®) |
543 |
+7.7% |
2,159 |
+4.2% |
Influenza
vaccines
(incl. Fluzone® HD/
Efluelda®,
Fluzone®,
Flublok®,
Vaxigrip®) |
1,093 |
-12.4% |
2,628 |
+5.9% |
Meningitis/Pneumo vaccines
(incl. Menactra®,
MenQuadfi®) |
91 |
-31.2% |
658 |
+21.1% |
| Booster vaccines
(incl. Adacel ®) |
124 |
-1.6% |
488 |
+6.0% |
| Travel and
endemic vaccines |
91 |
+17.1% |
306 |
+3.3% |
|
Other vaccines |
22 |
+57.1% |
84 |
+26,5% |
|
Total Vaccines |
1,964 |
-6.5% |
6,323 |
+6.8% |
.
Fourth-quarter Vaccines sales
decreased 6.5% to €1,964 million, mainly reflecting lower U.S
influenza vaccines sales partially offset by successful
Efluelda® expansion in Europe and Polio/Pertussis/Hib in
the Rest of the World region. In 2021, Vaccines sales increased
6.8% supported by Meningitis, Influenza and PPH vaccines.
In the fourth quarter,
Polio/Pertussis/Hib (PPH) vaccines sales increased
7.7% to €543 million driven by
Pentaxim® in China and
Hexaxim® in Europe. In the U.S.,
Pentacel® sales decreased due to
inventory fluctuation and progressive
Vaxelis® ramp-up.
Vaxelis® was launched in the U.S. in
June 2021, in-market sales are not consolidated and the profits are
shared equally between Sanofi and Merck.
Influenza vaccines sales
decreased 12.4% in the fourth quarter, reaching €1,093 million. In
the U.S. fourth-quarter sales were down 48.3% reflecting lower
influenza vaccination rates when compared to last year, which
resulted from the prioritization of COVID-19 booster vaccinations
at the pharmacy level, as well as record shipments in the third
quarter of 2021. In the U.S, Fluzone®HD
gained 3.5 points share despite market contracted by 17% in volume
(Sources: IQVIA Claims Medical (as of 1/1/22); IQVIA Claims
Retail (as of 1/2/22)). In Europe, Influenza vaccines sales
increased 51.1% driven by the adoption of a preferential
recommendation for Efluelda® for people
above 60 years old in Germany. In the Rest of the World region,
influenza sales increased 22.7%. On a full-year basis, 2021 marked
another record year with Influenza vaccines sales up 5.9% to €2,628
million.
Fourth-quarter Meningitis sales
decreased 31.2% to €91 million, reflecting a high base of
comparison in the U.S. in the fourth quarter of 2020, when sales
benefited from catch-up vaccinations.
Booster vaccines sales
decreased 1.6% in the fourth quarter to €124 million, due to lower
sales in the Rest of the World region partially offset by growth in
Europe. Vaccination rates in this segment have not yet returned to
pre-COVID levels.
Fourth-quarter Travel and endemic
vaccines sales increased 17.1%, reflecting a low base of
comparison in the fourth quarter of 2020 due to the pandemic
environment.
Vaccines business operating income
In the fourth quarter, business
operating income (BOI) decreased 22.3% (down 23.9% at CER)
to €653 million compared to the same period of last year. This
reflects lower U.S. influenza vaccines sales and higher R&D
expenses related to Translate Bio and the mRNA center of
excellence. In the fourth quarter, BOI to net sales ratio was 33.2%
(versus 40.8% in the fourth quarter of 2020). In 2021, BOI
increased 11.7% (up 12.5% at CER) to €2,609 million benefiting from
sales performance and efficiency gain as well as the payment from
Daiichi Sankyo in the first quarter of 2021. BOI to net sales ratio
increased 2.2 percentage points to 41.3% (41.2% at CER). Excluding
the payment from Daiichi Sankyo, BOI to net sales ratio was 39.4%
in 2021.
Consumer Healthcare
| Net sales
(€ million) |
Q4 2021 |
Change
at CER |
2021 |
Change
at CER |
| Allergy |
127 |
+6.1% |
612 |
+2.9% |
| Cough &
Cold |
116 |
+43.8% |
320 |
-15.2% |
| Pain Care |
275 |
+7.1% |
1,093 |
+7.2% |
| Digestive
Wellness |
276 |
+5.5% |
1,131 |
+17.6% |
| Physical
Wellness |
79 |
-3.8% |
323 |
-5.2% |
| Mental
Wellness |
51 |
—% |
211 |
+12.5% |
| Personal Care |
132 |
+5.8% |
519 |
+3.5% |
|
Non-Core / Others |
55 |
-26.7% |
259 |
-11.0% |
|
Total Consumer Healthcare |
1,111 |
+5.6% |
4,468 |
+4.6% |
In the fourth quarter, Consumer
Healthcare (CHC) sales increased 5.6% to €1,111 million
driven by growth in the U.S. and Europe. This performance was
driven by the Cough and Cold franchise, as well as the Pain Care
category which benefited from COVID-19 vaccinations. In 2021 CHC
sales increased 4.6% mainly due to the growing sales in Digestive
Wellness, Pain Care and Mental Wellness categories which more than
offset a weak cough and cold season last winter and the divestments
of non-core products (-0.8 ppt impact).
In the U.S., fourth-quarter CHC
sales increased 12.6% to €280 million driven by double-digit growth
of Allergy, Pain Care, Personal Care and Digestive Wellness
categories.
In Europe, fourth-quarter CHC
sales increased 7.5% to €345 million mainly reflecting growth of
the Cough and Cold and Pain Care franchises which also benefited
from COVID-19 vaccinations.
In Rest of World,
fourth-quarter CHC sales increased 0.8% to €486 million, supported
by Cough and Cold and Digestive Wellness categories, partially
offset by lower sales of Allergy, Pain Care and Physical Wellness
categories.
CHC business operating
income
In the fourth quarter, business
operating income (BOI) of CHC decreased 2.0.% (-5.3% at
CER) to €298 million. The ratio of BOI to net sales decreased 2.7
percentage point to 26.8% versus the prior year which included a
capital gain related to divestments of non-strategic assets. In
2021, BOI of CHC increased 5.9% (up 10.2% at CER) to €1,493 million
due to higher sales, a strict control of operational expenses and
higher capital gains related to divestments of non-strategic
assets. The ratio of BOI to net sales increased 1.3 percentage
points to 33.4% (33.8% at CER).
Company sales by geographic region
| Sanofi
sales (€ million) |
Q4 2021 |
Change
at CER |
2021 |
Change
at CER |
| United
States |
3,820 |
+1.8% |
14,385 |
+10.3% |
|
Europe |
2,804 |
+9.8% |
9,759 |
+6.6% |
| Rest of the
World |
3,370 |
+2.3% |
13,617 |
+4.4% |
| of which
China |
558 |
+5.7% |
2,720 |
+7.9% |
| of which
Japan |
404 |
+0.5% |
1,657 |
+1.7% |
| of which
Brazil |
164 |
-21.3% |
815 |
+7.3% |
|
of which Russia |
136 |
-8.8% |
575 |
-4.8% |
|
Total Sanofi sales |
9,994 |
+4.1% |
37,761 |
+7.1% |
Fourth-quarter sales in the
U.S. increased 1.8% to €3,820 million supported by
the strong performance of Dupixent® and double-digit
growth of CHC, Diabetes and Oncology. In 2021, U.S. sales grew
10.3%, mainly reflecting Dupixent® and double-digit
growth of CHC.
In Europe sales increased 9.8%
in the fourth quarter to €2,804 million mainly driven by
Dupixent® performance as well as strong Vaccines growth.
In 2021, European sales increased 6.6% due to the growth of
Specialty Care products driven by Dupixent® as well as
the strong performance of Vaccines.
In Rest of World sales
increased 2.3% to €3,370 million in the fourth quarter, reflecting
the performance of Dupixent® and Vaccines which more
than offset lower sales of General medicines. Sales in
China increased 5.7% to €558 million mainly as a
result of the growth of Dupixent®, Plavix®
and Vaccines. In Japan, fourth-quarter sales
increased 0.5% to €404 million driven by Dupixent® and
Sarclisa® which more than offset lower sales of
Established products. In Rest of World 2021 sales increased 4.4%
mainly supported by growth of Specialty Care products driven by
Dupixent® as well as Vaccines and CHC.
R&D update at the end of the fourth quarter
2021
Regulatory update
- The U.S. Food and Drug Administration (FDA)
approved
Dupixent® as an add-on
maintenance treatment of children aged 6 to 11 years with
moderate-to-severe asthma characterized by an
eosinophilic phenotype or with oral corticosteroid-dependent
asthma.
- The FDA accepted for Priority Review the
Biologics License Application (BLA) for olipudase
alfa for the proposed indication as an enzyme
replacement therapy for long-term treatment of non–central nervous
system (CNS) manifestations of acid sphingomyelinase
deficiency (ASMD) in pediatric and adult patients. The
target action date (PDUFA) for the FDA decision is July 3, 2022.
Historically known as Niemann-Pick disease (NPD) type A and type B,
ASMD is an ultra-rare disorder that affects both children and
adults. The estimated prevalence of ASMD is approximately 2,000
patients in the U.S., Europe (EU5 countries) and Japan. Due to the
rarity of the disease, many patients go undiagnosed or experience
delays before receiving an accurate diagnosis, often while the
health complications of ASMD continue to progress. Olipudase alfa
has received special designations from regulatory agencies
worldwide, recognizing the innovation potential of this
investigational therapy. Regulatory submissions for olipudase alfa
are currently under review in Japan and the European Union. If
approved, it will become the first and only therapy available for
the treatment of ASMD.
- The FDA accepted for review
the supplemental Biologics License Application (sBLA) for
Libtayo® in
combination with chemotherapy, for the first line
treatment of patients with advanced non-small cell lung cancer
(NSCLC). The target action date (PDUFA) for the FDA
decision is September 19, 2022.
- The European Medicines Agency's (EMA) Committee for Medicinal
Products for Human Use (CHMP) reaffirmed its
opinion that avalglucosidase alfa does not qualify
as a new active substance (NAS). Sanofi does not agree with the
CHMP’s conclusion on NAS status and is evaluating potential options
for avalglucosidase alfa in the European Union.
Portfolio update
Phase 3:
- A pivotal trial evaluating
Dupixent® for the
treatment of adults with uncontrolled prurigo
nodularis, met its primary and all key secondary
endpoints showing that Dupixent significantly reduced itch
and skin lesions compared to placebo in this investigational
setting. The impact of uncontrolled prurigo nodularis on quality of
life is one of the highest among inflammatory skin diseases with
intense and chronic itch.
- Results from a second phase 3 trial assessing the
investigational use of
Dupixent® in patients
12 years and older with eosinophilic esophagitis
(EoE) demonstrated that the trial met its
co-primary endpoints in patients taking Dupixent 300 mg
weekly, showing significant improvements in clinical and histologic
disease measures compared to placebo.
- The study conducted by the German-Speaking Myeloma Multicenter
Group (GMMG) in patients with newly diagnosed multiple myeloma (MM)
and treated with
Sarclisa® in
combination with lenalidomide, bortezomib and dexamethasone (RVd),
met the primary endpoint, the rate of minimal residual
disease (MRD) negativity after induction therapy and
before transplant. This trial is the first Phase 3 study to meet
primary endpoint of minimal residual disease negativity in
transplant-eligible patients with newly diagnosed multiple myeloma.
The trial is ongoing, following the second randomization to
evaluate progression free survival (PFS) for Sarclisa and
lenalidomide combination as maintenance therapy.
- Positive data from two Phase 3 studies
(ATLAS-A/B and ATLAS-INH) evaluating the efficacy and safety of
fitusiran, an investigational small interference
RNA (siRNA) therapy for the prophylactic treatment of
adults and adolescents with hemophilia A or B, with or
without inhibitors, were presented at the American Society of
Hematology (ASH) Annual Meeting. Across both clinical studies,
prophylactic treatment with fitusiran reduced annualized bleeding
rates by >89% compared to the control arms, showing a
statistically significant and clinically meaningful improvement in
bleeds when compared to on-demand treatments, and also showing
significant improvement in quality of life. The Phase 3 clinical
program is ongoing evaluating the efficacy and safety of fitusiran
under an amended protocol which includes lower doses and an
extended dosing regimen in all ongoing adult and adolescent
studies.
- Tolebrutinib, the investigational
brain-penetrant oral Bruton’s tyrosine kinase (BTK) inhibitor,
demonstrated favorable one-year tolerability,
after 48 weeks of treatment, in a phase 2b long-term extension
study in patients with relapsing forms of multiple
sclerosis (RMS). Data were presented at the 37th Congress
of the European Committee for Treatment and Research in Multiple
Sclerosis (ECTRIMS).
- A new pivotal study evaluating the efficacy and safety of
tolebrutinib, for the treatment of
Myasthenia Gravis (MG), enrolled its first
patient. The multicenter, randomized, double blind,
placebo-controlled, Phase 3 study evaluates tolebrutinib compared
with placebo in 154 adult participants aged 18 to 85 years old with
moderate-to-severe MG. The primary endpoint is change in the
Myasthenia Gravis-Activities of Daily Living Profile (MG-ADL)
score, an eight-item patient-reported scale developed to assess MG
symptoms and their effects on daily activities.
- Preliminary results from a clinical trial investigating the
safety and immunogenicity of a single booster dose of Sanofi and
GSK recombinant adjuvanted COVID-19 vaccine
candidate showed consistently strong immune
responses regardless of the primary vaccine received.
Phase 3 trial continues to accrue number of events needed for
analysis: results are expected in Q1, 2022.
- New nirsevimab MEDLEY Phase 2/3 data and an
encore MELODY Phase 3 presentation were presented at ReSViNET 2021,
reinforcing the potential of an investigational single-dose
preventative immunization to help protect all infants entering
their first respiratory syncytial virus (RSV)
season.
Phase 2:
- The study assessing tusamitamab ravtansine, an
anti-CEACAM5 antibody drug conjugate (ADC), in combination with
ramucirumab in patients previously treated for gastric
cancer, recruited its first patient.
- Three phase 2 non-randomized, open-label, multi-cohort,
multi-center studies evaluating SAR444245, a
non-alpha IL-2 (formerly known as THOR707) enrolled their first
patients. In these studies, SAR444245 is evaluated in combination
with other anti-cancer therapies for the treatment of patients with
NSCLC or mesothelioma, or with head and
neck squamous cell carcinoma and is evaluated with or
without other anti-cancer therapies in patients with
relapsed or refractory B cell lymphoma. Sanofi
plans to recruit more than 500 patients across those three
trials.
- The study evaluating SAR442720, a SHP2
inhibitor also known as RMC-4630, in combination with sotorasib, a
KRAS inhibitor, for the second line or later
treatment of patients with KRASG12C mutant
NSCLC, enrolled its first patient. The primary
endpoint of this open-label study with 46 participants is overall
response rate (ORR). It is conducted in collaboration with
Revolution Medicines and Amgen.
- The double-blind, 2-arm Phase 2 study monitoring
rilzabrutinib, a BTK inhibitor, for the treatment
of adults with moderate-to-severe atopic
dermatitis, enrolled its first patient. The primary
endpoint of this study is percent change in Eczema Area and
Severity Index (EASI) score. Seventy participants with
moderate-to-severe atopic dermatitis who are inadequate responders
or intolerant to topical corticosteroids are planned to be
included.
- The study evaluating SAR441344, an anti-CD40L
monoclonal antibody developed in collaboration with Immunext, for
the treatment of patients with active systematic lupus
erythematosus, enrolled its first patient.
- Development of
Sarclisa® in
patients awaiting kidney transplantation has been
discontinued
- Development of SAR445088, a complement C1s
inhibitor, in immune thrombocytopenia (ITP) has
been discontinued. A Phase 2 study in adults with
chronic inflammatory demyelinating polyneuropathy
(CIDP) and a safety and tolerability study in adults with
cold agglutinin disease (CAD) continue.
Phase 1:
- An anti PD-L1 / IL-15 fusion protein,
SAR445710, (formerly known as KD033), entered in
the Sanofi Phase 1 pipeline for the treatment of solid tumors,
following the closing of the acquisition of Kadmon.
- A first in human study to evaluate the safety,
pharmacokinetics, pharmacodynamics and anti-leukemic activity in
various hematological malignancies of
SAR443579, an anti-NKp46/CD123 bispecific
monoclonal antibody developed in collaboration with Innate Pharma,
enrolled its first patient.
- Studies for the following new molecular entities in development
for the treatment of immuno-inflammatory
indications enrolled their first
patients: SAR442970, an
anti-TNF/OX40L Nanobody® VHH,
SAR444336, a pegylated IL-2,
SAR443765, an anti-IL-13/TSLP
Nanobody® VHH and
SAR442999 an anti-TNFa/IL-23A
Nanobody® VHH.
- The study with SAR443809, an anti-Factor Bb
monoclonal antibody for the treatment of rare renal
diseases, recruited its first patient.
- Sanofi will be transitioning its rights and obligations related
to SAR445136, a zinc finger nuclease gene-edited
cell therapy candidate in development by Sangamo and Sanofi for the
treatment of sickle cell disease (SCD),
back to Sangamo over the first half of 2022.
- Development of SAR439459, an anti-TGFb
monoclonal antibody for the treatment of advanced solid
tumors, has been discontinued.
- Development of SAR442085, an anti-CD38
monoclonal antibody Fc engineered, for the treatment of
multiple myeloma, has been
discontinued.
Acquisitions and major
collaborations
- On November 9, Sanofi announced the completion of its
acquisition of Kadmon Holdings,
Inc., further strengthening growth and
expansion of the General Medicines portfolio.
- On November 18, Sanofi announced an equity investment of $180
million and a new strategic collaboration with
Owkin, an artificial intelligence and
precision medicine company, willing to optimize clinical
trial design and detect predictive biomarkers for diseases and
treatment outcomes in core areas such as lung cancer, breast cancer
and multiple myeloma.
- On December 1, Sanofi announced the
acquisition of Origimm Biotechnology
GmbH, a biotechnology company specialized in the discovery
of virulent skin microbiome components and antigens from bacteria
causing skin disease.
- On December 21st, Sanofi announced that it has
entered into an agreement to acquire
Amunix Pharmaceuticals, Inc., an immuno-oncology
company, leveraging its proprietary, clinically validated XTEN® and
innovative universal protease-releasable masking technology
platform, Pro-XTENTM, to discover and develop
transformative T-cell engagers (TCE) and cytokine therapies for
patients with cancer. Amunix’s pipeline, which includes lead
candidate AMX-818, a masked HER2-directed TCE,
offers a strong strategic fit with Sanofi’s focus on developing
potentially transformative cancer therapies in
immuno-oncology.
An update of the R&D pipeline at as of
December 31, 2021, is available on our website:
https://www.sanofi.com/en/science-and-innovation/research-and-development
Progress on implementation of the Corporate Social
Responsibility strategy that is fully integrated in our Play to Win
strategy
Sanofi Global Health and Medtronic Labs to collaborate
to expand access to healthcare in Low to Middle Income
Countries
Globally, Non-Communicable Diseases (NCDs) are
responsible for 41 million yearly deaths, equivalent to 71% of all
deaths. Of these, 37% are premature deaths affecting those between
the ages of 30 and 69. NCDs disproportionately affect people in
low- and middle-income countries, where more than 75% of global NCD
deaths, and 85% of premature deaths, occur.
Against this backdrop, Sanofi Global Health is
launching a multi-country, multi-year partnership with Medtronic
Labs to expand access to healthcare for underserved patients living
with diabetes and hypertension. This partnership will leverage
digital health and a community-based approach to improve disease
awareness, diagnosis, and management of diabetes and hypertension.
The first phase will focus on Tanzania and Sierra Leone where it
aims to reach more than 75,000 beneficiaries in strong
collaboration with health system partners. This partnership aims to
build a replicable and sustainable approach to community-focused
chronic disease management while contributing to strengthening
health systems as they build towards Universal Health Coverage
(UHC) and the Sustainable Development Goals (SDGs). Sanofi Global
Health has teamed up with Medtronic Labs to address the pressing
challenge of non-communicable diseases in LMICs3.
Status on our renewed CSR ambition
In 2020, in the context of defining our renewed
CSR ambitions we reviewed and updated our portfolio of initiatives.
Numbers shown for 2021 below serve as the baseline to highlight our
ongoing progress in the implementation of Sanofi’s CSR
strategy.
Affordable access
Sanofi Global Health, a nonprofit unit formed
within the company in April 2021, aims to provide 30 of Sanofi's
medicines across a wide range of therapeutic areas to patients in
40 of the lowest income countries. Beyond the products provided,
Sanofi Global Health will also focus on integrated programs that
ensure optimal care management over time for patients.
Sanofi is also committed to helping 1,000
patients living with rare diseases who have no access to treatments
and will donate 100,000 vials of medicine for their treatments each
year. This continues Sanofi’s 30-year commitment to patients
suffering from rare diseases, such as Fabry, Gaucher or Pompe
diseases, for which access to treatment is often limited.
Our third initiative on access is to develop a
global access plan for all new products, making them available in
selected relevant markets within two years of launch.
|
Dashboard for affordable access |
FY 2021 |
|
Sanofi Global Health |
|
Malaria |
- 9,276,504 patients
treated
- 23 countries
|
|
Tuberculosis |
- 146,356 patients
treated
- 28 countries
|
|
NCD |
- 40,439 patients
treated
- 16 countries
|
|
Vials donation |
|
# Patients treated |
1,083 |
|
#Vials donated |
109,677 |
|
Global access Plan |
|
# of access plan |
Pilot phase in progress |
R&D for unmet needs
Sanofi continues its efforts to fight polio and
sleeping sickness, two of its legacy programs that address global
health issues.
Sanofi has been involved in the fight against
polio from the beginning and continues to play a critical role in
the delivery of polio vaccines. It has also committed itself
alongside the WHO to eliminate sleeping sickness in humans by
2030.
Part of Sanofi’s R&D ambition is to develop
innovative medicines to eliminate cancer deaths in children.
|
Dashboard for R&D for unmet |
FY 2021 |
|
Eradicate Polio |
|
# IPV doses supplied |
50.5 million IPV doses supplied to UNICEF for GAVI
countries
|
Eliminate sleeping sickness
(As of 2020, data 2021 available in April 2022) |
|
# Patients tested |
1.6 million |
|
# Patients treated |
663 |
|
Develop innovative medicines to eliminate cancer deaths in
children |
|
# of assets identified |
2; preclinical studies started |
Efficiency & sustainability
To contribute to better resource conservation,
Sanofi plans to remove all pre-formed plastic packaging (blister
packs) for its vaccines by 2027. In addition, the company is
committed to eco-designing all its new products by 2025. To reduce
its greenhouse gas emissions by 55% by 2030, all Sanofi sites will
use 100% electricity from renewable sources and the company has set
a target of a carbon-neutral car fleet, both by 2030.
|
Dashboard for efficiency & sustainability |
FY 2021 |
|
Blister free vaccines |
|
% blister free vaccines |
29% of blister free vaccines produced
|
|
Eco design |
|
# of Life Cycle Analysis (LCA) |
4 LCAs conducted
|
Renewable electricity
(As of third quarter 2021) |
|
% electricity consumption from renewable sources |
50% (electricity from renewable sources) |
|
# Sites certified RE100 |
57 sites
|
Eco car fleet
(As of third quarter 2021) |
|
% eco car fleet on total car fleet |
26.2% eco-fleet |
People
As a global company, Sanofi is committed to
ensuring that its leaders reflect the communities and patients it
serves. The company is committed to continue fostering an
organization where all employees have equal opportunities to reach
positions of responsibility within the company. Our ambition is to
have 40% of women in top executive roles and 50% of women in senior
leaders roles by 2025. Sanofi is continuing its social and economic
engagement in the communities it operates in. Finally, Sanofi is
embedding its commitment to society in its leaders’ career
development paths to strengthen the social impact of their
decisions.
|
Dashboard for people |
FY 2021 |
|
Diverse Senior Leadership |
|
% of women |
34.2% of our top executives
40.1% of our senior leaders |
Strengthen social & economic engagement in all
communities where we operate
(in the following countries: France US, India and
Switzerland) |
|
# volunteers |
2,623 volunteers |
|
# hours |
17,461 hours |
|
From Leaders to Citizens |
|
KPI |
Roll out planned in 2022 |
ESG ratings
In recognition of Sanofi’ continued CSR strategy implementation,
a few of Sanofi’s ESG rankings have been positively updated:
- MSCI: A (previously
BBB)
- Sustainalytics: 22,9
(previously 24,7) as of 10/01/2022
- DJSI: 86/100
(previously 84/100)
Covid Update
Sanofi also keeps its commitment to making a
strong contribution to current global public health priorities,
with the supply of up to half a billion doses of authorized
vaccines. Sanofi is the only company leveraging its worldwide
manufacturing capacity and expertise for the supply of three
different authorized COVID-19 vaccines from BioNTech / Pfizer,
Moderna, and Johnson & Johnson. Manufacturing teams on three
industrial sites of the company in France, Germany and the U.S. are
mobilized, with 100 million doses released by end December
2021.
At the same time, Sanofi continues its efforts
in the fight against the COVID-19 pandemic with its adjuvanted
recombinant protein candidate vaccine, developed in partnership
with GSK. Positive preliminary booster data have shown that
neutralizing antibodies increased across all primary vaccines
received (mRNA or adenovirus) for all age groups tested, with a
good safety and tolerability profile. Phase 3 trial continues to
accrue number of events needed for analysis as populations around
the world are increasingly exposed to COVID-19 variants; results
are expected in Q1 2022. Sanofi intends to file booster data with
regulatory authorities following the Phase 3 results.
Fourth-quarter and full-year 2021 financial results
Business Net
Income4
In the fourth quarter of 2021, Sanofi generated
net sales of €9,994 million, an increase of 6.5%
(up 4.1% at CER). In 2021, net sales were €37,761 million up 4.8%
(up 7.1% at CER).
Fourth-quarter other revenues
increased 18.9% (up 15.5% at CER) to €421 million, including
decreased VaxServe sales of non-Sanofi products of €288 million
(down -10.4 % at CER). In 2021, other revenues increased 6.5% (up
10.1% at CER) to €1,414 million, including VaxServe sales of
non-Sanofi products of €1,078 million (down -2.2 % at CER).
Fourth-quarter Gross Profit
increased 10.3% (up 7.5% at CER) to €6,944 million. The gross
margin ratio increased 2.4 percentage points to 69.5% versus the
fourth quarter of 2020, reflecting strong improvement of the
Pharmaceuticals gross margin ratio (which increased from 70.9% to
75.4%) driven by favorable impact of growing weight of Specialty
Care and efficiency gains in Industrial Affairs. The Vaccines gross
margin ratio decreased to 56.0% from 60.7%, reflecting lower sales
of U.S. influenza vaccines and inventory destruction associated to
this lower demand. CHC gross margin ratio was 62.5%, down 1.5
percentage points. In 2021, the gross margin ratio increased 1.2
percentage point to 71.3% (71.4% at CER) driven by Specialty Care
and efficiency gains in industrial affairs.
Research and Development
(R&D) expenses increased 4.6% (up 2.8% at CER) to €1,585
million in the fourth quarter, reflecting increase in priority
assets development as well as recent acquisitions partly offset by
efficiencies. In 2021, R&D expenses increased 2.9% to €5,692
million and were up 4.3% at CER driven by increased investment
behind key assets and additional R&D expenses from recent
acquisitions which were partly offset by efficiency and the
benefits of terminating diabetes and cardiovascular related
projects recorded in 2020.
Fourth-quarter selling general and
administrative expenses (SG&A) increased 6.0% to
€2,758 million. At CER, SG&A expenses were up 3.9%, reflecting
increased commercial investments in Specialty Care growth drivers
which were partially offset by continued streamlining of General
and Administrative expenses (G&A). In the fourth quarter, the
ratio of SG&A to sales decreased 0.1 percentage point to 27.6%
compared to the prior year. In 2021, SG&A expenses increased
1.7% to €9,555 million (up 3.7% at CER). In 2021, ratio of SG&A
to sales was 0.8 percentage point lower at 25.3% compared to
2020.
Fourth-quarter operating
expenses were €4,343 million, an increase of 5.5% and 3.5%
at CER. In 2021 operating expenses were €15,247 million, an
increase of 2.2% and an increase of 3.9% at CER.
Fourth-quarter other current operating
income net of expenses was -€356 million versus -€123
million in the fourth quarter of 2020. Other current operating
income net of expenses included an expense of €444 million (versus
an expense of €290 million in the fourth quarter of 2020)
corresponding to the share of profit to Regeneron of the monoclonal
antibodies Alliance, reimbursement of development costs by
Regeneron and the reimbursement of commercialization-related
expenses incurred by Regeneron. In the fourth quarter, this line
also included €61 million of net capital gains related to General
medicines and CHC portfolio streamlining compared to €72 million in
the same period of 2020. In 2021, other current operating income
net of expenses was -€946 million versus -€561 million in 2020 and
included €318 million of net capital gains related to portfolio
streamlining compared to €211 million in 2020. The full-year 2021
expense associated with the monoclonal antibodies Alliance with
Regeneron was €1,429 million, which compared with an expense of
€1,001 million in 2020 (see appendix 7 for further details).
The share of profit from
associates was €18 million versus €4 million in Q4 2020
and included the share of U.S profit related to
VaxelisTM.
Fourth-quarter business operating
income4 (BOI) increased 9.9% to €2,256 million.
At CER, BOI increased 6.9%. The ratio of BOI to net sales increased
0.7 percentage points to 22.6% mainly reflecting gross margin ratio
improvement. In 2021, business operating income was €10,714
million, up 9.8% (up 13.3% at CER). In 2021, €730 million of
savings were generated and fully reinvested in growth drivers and
key programs in R&D. In 2021 the ratio of business operating
income to net sales increased 1.3 percentage points to 28.4% (28.6%
at CER).
Net financial expenses were €83
million and €328 million in the fourth quarter and full-year 2021
(versus €93 million and 335 million in the same periods of
2020).
Fourth-quarter and full-year 2021
effective tax rate was 20.5% and 20.9% versus 22%
in the prior year. Sanofi expects its effective tax rate to be
around 19% in 2022.
Fourth-quarter business net
income4 increased 13.3% to €1,730 million and
increased 10.2% at CER. The ratio of business net income to net
sales increased 1.0 percentage points to 17.3% versus the fourth
quarter of 2020. In 2021, business net income increased 11.8% to
€8,213 million and increased 15.5% at CER. The ratio of business
net income to net sales increased 1.3 percentage points to 21.7%
versus 2020.
In the fourth quarter of 2021, business
earnings per share4 (EPS) was
€1.38, up 13.1% on a reported basis (up 9.8% at CER). The average
number of shares outstanding was 1,254.9 million versus 1,255.1
million in fourth quarter 2020. In 2021, business earnings per
share8 was €6.56, up 11.9% on a reported basis and up
15.5% at CER. The average number of shares outstanding was 1,252.5
million in 2021 versus 1,253.6 million in 2020.
Reconciliation of IFRS net income reported to business
net income (see Appendix 4)
In 2021, the IFRS net income was €6,223 million.
The main items excluded from the business net income were:
- An amortization
charge of €1,580 million related to fair value remeasurement on
intangible assets of acquired companies (primarily Genzyme: €509
million, Bioverativ: €320 million, Boehringer Ingelheim CHC
business: €195 million and Ablynx: €168 million) and to acquired
intangible assets (licenses/products: €96 million). These items
have no cash impact on the Company.
- An impairment of
intangible assets of €192 million mainly related to sutimlimab
(termination of ITP) and discontinuation of some vaccines R&D
projects.
- Restructuring costs
and similar items of €820 million related to streamlining
initiatives.
- A €614 million tax
effect arising from the items listed above, mainly comprising €415
million of deferred taxes generated by amortization and impairments
of intangible assets and €200 million associated with restructuring
costs and similar items (see Appendix 4).
Capital Allocation
In 2021, free cash flow before restructuring,
acquisitions and disposals increased by 32.6% to €9,977 million,
after net changes in working capital (+€1,475 million) and capital
expenditures (-€1,400 million). After acquisitions5
(-€1,488 million of which Kiadis -€326 million, Tidal Therapeutics
-€135 million, Owkin -€160 million), proceeds from
disposals5 (+€667 million) and payments related to
restructuring and similar items (-€1,060 million), free cash
flow6 increased 16.0% to €8,096 million. After the
acquisition of Translate Bio (-€ 2,397 million), Kymab (-€932
million) and Kadmon (-€1,904 million), the dividend paid by Sanofi
(-€4,008 million), net debt increased from €8,790 million at
December 31, 2020 to €9,983 million at December 31, 2021 (amount
net of €10,098 million cash and cash equivalents
-----------
Financial statements are not audited. The audit
procedures by the Statutory Auditors are underway.
-----------
Forward-Looking
Statements
This press release contains forward-looking statements as
defined in the Private Securities Litigation Reform Act of 1995, as
amended. Forward-looking statements are statements that are not
historical facts. These statements include projections and
estimates and their underlying assumptions, statements regarding
plans, objectives, intentions and expectations with respect to
future financial results, events, operations, services, product
development and potential, and statements regarding future
performance. Forward-looking statements are generally identified by
the words “expects”, “anticipates”, “believes”, “intends”,
“estimates”, “plans” and similar expressions. Although Sanofi’s
management believes that the expectations reflected in such
forward-looking statements are reasonable, investors are cautioned
that forward-looking information and statements are subject to
various risks and uncertainties, many of which are difficult to
predict and generally beyond the control of Sanofi, that could
cause actual results and developments to differ materially from
those expressed in, or implied or projected by, the forward-looking
information and statements. These risks and uncertainties include
among other things, risks related to Sanofi’s ability to complete
the proposed transaction with Kadmon Holdings, Inc. on the proposed
terms or on the proposed timeline, including the receipt of
required regulatory approvals, the possibility that competing
offers will be made, other risks associated with executing business
combination transactions, as well as other risks related to
Sanofi’s business, including the ability to grow sales and revenues
from existing products and to develop, commercialize or market new
products, competition, the uncertainties inherent in research and
development, future clinical data and analysis, including post
marketing, decisions by regulatory authorities, such as the FDA or
the EMA, regarding whether and when to approve any drug, device or
biological application that may be filed for any such product
candidates as well as their decisions regarding labelling and other
matters that could affect the availability or commercial potential
of such product candidates, the fact that product candidates if
approved may not be commercially successful, the future approval
and commercial success of therapeutic alternatives, Sanofi’s
ability to benefit from external growth opportunities, to complete
related transactions and/or obtain regulatory clearances, risks
associated with intellectual property and any related pending or
future litigation and the ultimate outcome of such litigation,
trends in exchange rates and prevailing interest rates, volatile
economic and market conditions, cost containment initiatives and
subsequent changes thereto, and the impact that COVID-19 will have
on us, our customers, suppliers, vendors, and other business
partners, and the financial condition of any one of them, as well
as on our employees and on the global economy as a whole. Any
material effect of COVID-19 on any of the foregoing could also
adversely impact us. This situation is changing rapidly and
additional impacts may arise of which we are not currently aware
and may exacerbate other previously identified risks. The risks and
uncertainties also include the uncertainties discussed or
identified in the public filings with the SEC and the AMF made by
Sanofi, including those listed under “Risk Factors” and “Cautionary
Statement Regarding Forward-Looking Statements” in Sanofi’s annual
report on Form 20-F for the year ended December 31, 2020. Other
than as required by applicable law, Sanofi does not undertake any
obligation to update or revise any forward-looking information or
statements.
Appendices
|
Appendix 1: |
Fourth-quarter and
full-year 2021 sales by GBU, franchise, geographic region and
product |
| Appendix 2: |
Fourth-quarter and
full-year 2021 business net income statement |
| Appendix 3: |
Fourth-quarter and
full-year 2021 consolidated income statement |
| Appendix 4: |
Reconciliation of
IFRS net income reported to business net income |
|
Appendix 5: |
Change in net debt |
| Appendix 6 |
Simplified
consolidated balance sheet |
| Appendix 7 |
Other current
operating income net of expenses – Regeneron Alliances |
| Appendix 8: |
Currency
sensitivity |
| Appendix 9: |
Definitions of
non-GAAP financial indicators |
Media Relations
Sandrine Guendoul | + 33 6 25 09 14 25 | sandrine.guendoul@sanofi.com
Sally Bain | + 1 617 834 6026 | sally.bain@sanofi.com
Nicolas Obrist | + 33 6 77 21 27 55 | nicolas.obrist@sanofi.com
Victor Rouault | + 33 6 70 93 71 40 | victor.rouault@sanofi.com
Investor Relations
Eva Schaefer-Jansen | + 33 7 86 80 56 39 |
eva.schaefer-jansen@sanofi.com
Arnaud Delépine | + 33 6 73 69 36 93 | arnaud.delepine@sanofi.com
Corentine Driancourt | + 33 6 40 56 92 21 |
corentine.driancourt@sanofi.com
Felix Lauscher | + 1 908 612 7239 | felix.lauscher@sanofi.com
Priya Nanduri | +1 908 981 5560 | priya.nanduri@sanofi.com
Nathalie Pham | + 33 7 85 93 30
17 | nathalie.pham@sanofi.com
Appendix 1: 2021 fourth-quarter net sales by GBU, franchise,
geographic region and product
| Q4 2021
(€ million) |
Total Sales |
% CER |
% reported |
|
United States |
% CER |
|
Europe |
% CER |
|
Rest of the world |
% CER |
|
Dupixent |
1,549 |
53.1
% |
57.7
% |
|
1,170 |
45.8
% |
|
187 |
60.9
% |
|
192 |
103.2
% |
|
Aubagio |
478 |
-1.9 % |
1.3 % |
|
318 |
-3.8 % |
|
126 |
2.5 % |
|
34 |
0.0 % |
|
Lemtrada |
19 |
-14.3 % |
-9.5 % |
|
6 |
-45.5 % |
|
6 |
40.0 % |
|
7 |
0.0 % |
|
Kevzara |
91 |
48.3 % |
51.7 % |
|
36 |
9.7 % |
|
37 |
80.0 % |
|
18 |
111.1 % |
|
Neurology & Immunology |
588 |
3.1
% |
6.3
% |
|
360 |
-3.9
% |
|
169 |
14.3
% |
|
59 |
21.7
% |
|
Cerezyme |
181 |
13.1 % |
13.1 % |
|
45 |
-2.3 % |
|
61 |
-1.6 % |
|
75 |
42.6 % |
|
Cerdelga |
67 |
11.9 % |
13.6 % |
|
35 |
6.5 % |
|
28 |
16.7 % |
|
4 |
25.0 % |
|
Myozyme |
254 |
5.5 % |
8.1 % |
|
90 |
-2.2 % |
|
105 |
7.1 % |
|
59 |
17.0 % |
|
Fabrazyme |
223 |
9.0 % |
11.5 % |
|
104 |
2.0 % |
|
59 |
13.7 % |
|
60 |
17.6 % |
|
Aldurazyme |
63 |
7.0 % |
10.5 % |
|
15 |
0.0 % |
|
21 |
0.0 % |
|
27 |
17.4 % |
|
Rare Disease |
818 |
9.5
% |
11.4
% |
|
303 |
5.1
% |
|
275 |
7.0
% |
|
240 |
18.8
% |
|
Jevtana |
110 |
-16.8 % |
-16.0 % |
|
71 |
13.3 % |
|
17 |
-66.0 % |
|
22 |
4.2 % |
|
Fasturtec |
41 |
2.6 % |
7.9 % |
|
25 |
0.0 % |
|
12 |
9.1 % |
|
4 |
0.0 % |
|
Libtayo |
35 |
78.9 % |
84.2 % |
|
— |
0.0 % |
|
29 |
61.1 % |
|
6 |
400.0 % |
|
Sarclisa |
54 |
112.0 % |
116.0 % |
|
21 |
66.7 % |
|
20 |
171.4 % |
|
13 |
133.3 % |
|
Oncology |
240 |
10.3
% |
12.7
% |
|
117 |
16.8
% |
|
78 |
-8.4
% |
|
45 |
37.1
% |
|
Alprolix |
113 |
-16.0 % |
-13.7 % |
|
87 |
5.1 % |
|
— |
0.0 % |
|
26 |
-48.1 % |
|
Eloctate |
141 |
-12.2 % |
-9.6 % |
|
102 |
-3.9 % |
|
— |
0.0 % |
|
39 |
-28.3 % |
|
Cablivi |
38 |
23.3 % |
26.7 % |
|
19 |
0.0 % |
|
19 |
50.0 % |
|
— |
0.0 % |
|
Rare Blood Disorder |
292 |
-10.4
% |
-7.9
% |
|
208 |
0.0
% |
|
19 |
50.0
% |
|
65 |
-37.1
% |
|
Specialty Care |
3,487 |
21.3 % |
24.6 % |
|
2,158 |
21.7 % |
|
728 |
17.6 % |
|
601 |
24.7 % |
| |
|
|
|
|
|
|
|
|
|
|
|
|
|
Lantus |
583 |
-2.9 % |
-0.7 % |
|
233 |
10.9 % |
|
115 |
-12.3 % |
|
235 |
-9.0 % |
|
Toujeo |
230 |
1.8 % |
4.1 % |
|
67 |
10.3 % |
|
103 |
6.3 % |
|
60 |
-11.9 % |
|
Soliqua/iGlarLixi |
54 |
13.0 % |
17.4 % |
|
32 |
6.9 % |
|
8 |
14.3 % |
|
14 |
30.0 % |
|
0thers Diabetes |
224 |
-3.9 % |
-2.2 % |
|
57 |
10.2 % |
|
66 |
-4.4 % |
|
101 |
-9.8 % |
|
Diabetes |
1,091 |
-1.5
% |
0.7
% |
|
389 |
10.4 % |
|
292 |
-4.0
% |
|
410 |
-8.8
% |
|
Lovenox |
335 |
-7.9 % |
-5.9 % |
|
5 |
-25.0 % |
|
169 |
-11.1 % |
|
161 |
-3.1 % |
|
Plavix |
222 |
7.5 % |
11.0 % |
|
2 |
0.0 % |
|
27 |
-12.9 % |
|
193 |
11.4 % |
|
Multaq |
99 |
20.3 % |
25.3 % |
|
90 |
24.6 % |
|
5 |
-16.7 % |
|
4 |
0.0 % |
|
Praluent |
55 |
-15.9 % |
-12.7 % |
|
— |
-100.0 % |
|
45 |
33.3 % |
|
10 |
50.0 % |
|
Aprovel |
112 |
-6.1 % |
-2.6 % |
|
3 |
0.0 % |
|
21 |
-16.7 % |
|
88 |
-3.4 % |
|
Mozobil |
63 |
3.4 % |
6.8 % |
|
36 |
6.1 % |
|
15 |
6.7 % |
|
12 |
-9.1 % |
|
Thymoglobulin |
87 |
5.0 % |
8.8 % |
|
54 |
2.0 % |
|
9 |
28.6 % |
|
24 |
4.5 % |
|
Generics |
133 |
-30.9 % |
-31.4 % |
|
21 |
-52.3 % |
|
— |
-66.7 % |
|
112 |
-23.8 % |
|
Others |
1,015 |
-2.9 % |
-1.3 % |
|
126 |
61.6 % |
|
339 |
-7.4 % |
|
550 |
-8.1 % |
|
Cardiovascular & Established Rx Products |
2,121 |
-4.5
% |
-2.4
% |
|
337 |
5.2
% |
|
630 |
-6.7 % |
|
1,154 |
-5.8
% |
|
Industrial Sales |
220 |
-8.4
% |
-7.2
% |
|
8 |
-46.7
% |
|
202 |
-0.5 % |
|
10 |
-60.0
% |
|
General Medicines |
3,432 |
-3.8 % |
-1.8 % |
|
734 |
6.7 % |
|
1,124 |
-4.9 % |
|
1,574 |
-7.2 % |
| |
|
|
|
|
|
|
|
|
|
|
|
|
|
Pharmaceuticals |
6,919 |
7.4 % |
9.9 % |
|
2,892 |
17.5 % |
|
1,852 |
2.8 % |
|
2,175 |
0.0 % |
| |
|
|
|
|
|
|
|
|
|
|
|
|
|
Polio / Pertussis / Hib |
543 |
7.7 % |
9.9 % |
|
105 |
-10.7 % |
|
82 |
1.3 % |
|
356 |
16.2 % |
|
Booster Vaccines |
124 |
-1.6 % |
0.8 % |
|
61 |
0.0 % |
|
44 |
16.2 % |
|
19 |
-29.6 % |
|
Meningitis |
91 |
-31.2 % |
-27.2 % |
|
62 |
-25.9 % |
|
— |
0.0 % |
|
29 |
-40.9 % |
|
Influenza Vaccines |
1,093 |
-12.4 % |
-11.0 % |
|
384 |
-48.3 % |
|
464 |
51.1 % |
|
245 |
22.7 % |
|
Travel and Endemic Vaccines |
91 |
17.1 % |
19.7 % |
|
16 |
7.7 % |
|
17 |
240.0 % |
|
58 |
0.0 % |
|
Vaccines |
1,964 |
-6.5 % |
-4.7
% |
|
648 |
-37.7
% |
|
607 |
40.8
% |
|
709 |
11.4
% |
| |
|
|
|
|
|
|
|
|
|
|
|
|
|
Allergy |
127 |
6.1 % |
10.4 % |
|
79 |
15.2 % |
|
7 |
16.7 % |
|
41 |
-9.3 % |
|
Cough and Cold |
116 |
43.8 % |
45.0 % |
|
— |
0.0 % |
|
65 |
54.8 % |
|
51 |
31.6 % |
|
Pain Care |
275 |
7.1 % |
7.8 % |
|
52 |
25.0 % |
|
138 |
14.0 % |
|
85 |
-9.6 % |
|
Digestive Wellness |
276 |
5.5 % |
8.7 % |
|
34 |
37.5 % |
|
92 |
0.0 % |
|
150 |
3.6 % |
|
Physical Wellness |
79 |
-3.8 % |
-1.3 % |
|
— |
0.0 % |
|
9 |
12.5 % |
|
70 |
-5.6 % |
|
Mental Wellness |
51 |
0.0 % |
4.1 % |
|
12 |
22.2 % |
|
22 |
0.0 % |
|
17 |
-10.5 % |
|
Personal Care |
132 |
5.8 % |
9.1 % |
|
102 |
11.4 % |
|
1 |
0.0 % |
|
29 |
-9.4 % |
|
Non-Core / Others |
55 |
-26.7 % |
-26.7 % |
|
1 |
-100.0 % |
|
11 |
-62.1 % |
|
43 |
25.7 % |
|
Consumer Healthcare |
1,111 |
5.6
% |
8.0
% |
|
280 |
12.6
% |
|
345 |
7.5
% |
|
486 |
0.8
% |
| |
|
|
|
|
|
|
|
|
|
|
|
|
|
Company |
9,994 |
4.1 % |
6.5 % |
|
3,820 |
1.8 % |
|
2,804 |
9.8 % |
|
3,370 |
2.3 % |
Appendix 1: Full-year 2021 net sales by GBU,
franchise, geographic region and product
| Full
Year 2021 (€ million) |
Total Sales |
% CER |
% reported |
|
United States |
% CER |
|
Europe |
% CER |
|
Rest of the world |
% CER |
|
Dupixent |
5,249 |
52.7
% |
48.5
% |
|
3,971 |
46.2
% |
|
649 |
67.4
% |
|
629 |
90.0
% |
|
Aubagio |
1,955 |
-1.8 % |
-4.4 % |
|
1,312 |
-5.7 % |
|
512 |
8.0 % |
|
131 |
6.5 % |
|
Lemtrada |
82 |
-24.8 % |
-27.4 % |
|
35 |
-38.3 % |
|
24 |
-20.0 % |
|
23 |
4.3 % |
|
Kevzara |
287 |
23.7 % |
21.6 % |
|
135 |
12.2 % |
|
102 |
34.7 % |
|
50 |
39.5 % |
|
Neurology & Immunology |
2,324 |
-0.3
% |
-2.9
% |
|
1,482 |
-5.5
% |
|
638 |
10.0
% |
|
204 |
13.0
% |
|
Cerezyme |
683 |
3.9 % |
-1.0 % |
|
173 |
1.1 % |
|
244 |
-2.0 % |
|
266 |
11.4 % |
|
Cerdelga |
254 |
11.1 % |
8.5 % |
|
132 |
7.0 % |
|
105 |
14.1 % |
|
17 |
28.6 % |
|
Myozyme |
1,003 |
7.7 % |
5.8 % |
|
373 |
8.1 % |
|
410 |
5.1 % |
|
220 |
12.0 % |
|
Fabrazyme |
844 |
6.5 % |
3.3 % |
|
395 |
1.0 % |
|
223 |
11.0 % |
|
226 |
12.8 % |
|
Aldurazyme |
243 |
7.3 % |
3.8 % |
|
54 |
5.8 % |
|
84 |
5.0 % |
|
105 |
9.8 % |
|
Rare Disease |
3,126 |
7.0
% |
3.8
% |
|
1,142 |
5.4
% |
|
1,069 |
5.6
% |
|
915 |
10.5
% |
|
Jevtana |
455 |
-12.3 % |
-15.1 % |
|
253 |
6.5 % |
|
112 |
-40.6 % |
|
90 |
-5.8 % |
|
Fasturtec |
152 |
2.0 % |
0.0 % |
|
90 |
-3.1 % |
|
46 |
9.5 % |
|
16 |
14.3 % |
|
Libtayo |
129 |
91.0 % |
92.5 % |
|
— |
0.0 % |
|
105 |
72.1 % |
|
24 |
283.3 % |
|
Sarclisa |
176 |
318.6 % |
309.3 % |
|
67 |
165.4 % |
|
64 |
600.0 % |
|
45 |
500.0 % |
|
Oncology |
912 |
16.9
% |
14.3
% |
|
410 |
15.2
% |
|
327 |
8.7
% |
|
175 |
40.5
% |
|
Alprolix |
414 |
-7.9 % |
-11.2 % |
|
332 |
7.5 % |
|
— |
0.0 % |
|
82 |
-41.8 % |
|
Eloctate |
563 |
-8.5 % |
-11.8 % |
|
429 |
0.4 % |
|
— |
0.0 % |
|
134 |
-29.0 % |
|
Cablivi |
164 |
47.8 % |
45.1 % |
|
81 |
16.7 % |
|
81 |
95.1 % |
|
2 |
0.0 % |
|
Rare Blood Disorder |
1,141 |
-3.0
% |
-6.2
% |
|
842 |
4.5
% |
|
81 |
95.1
% |
|
218 |
-33.6
% |
|
Specialty Care |
12,752 |
19.7
% |
16.4
% |
|
7,847 |
20.1
% |
|
2,764 |
19.0
% |
|
2,141 |
19.3
% |
| |
|
|
|
|
|
|
|
|
|
|
|
|
|
Lantus |
2,494 |
-3.8 % |
-6.3 % |
|
861 |
-3.8 % |
|
474 |
-11.9 % |
|
1,159 |
-0.3 % |
|
Toujeo |
969 |
6.4 % |
3.9 % |
|
259 |
0.4 % |
|
394 |
5.1 % |
|
316 |
13.7 % |
|
Soliqua/iGlarLixi |
195 |
24.2 % |
21.1 % |
|
115 |
19.0 % |
|
29 |
20.8 % |
|
51 |
40.5 % |
|
0thers Diabetes |
877 |
-3.7 % |
-6.3 % |
|
183 |
-6.0 % |
|
257 |
-3.7 % |
|
437 |
-2.8 % |
|
Diabetes |
4,535 |
-0.8
% |
-3.3
% |
|
1,418 |
-1.8
% |
|
1,154 |
-4.2
% |
|
1,963 |
2.0
% |
|
Lovenox |
1,486 |
12.0 % |
10.0 % |
|
29 |
3.3 % |
|
703 |
7.5 % |
|
754 |
16.8 % |
|
Plavix |
929 |
2.4 % |
1.8 % |
|
9 |
0.0 % |
|
115 |
-8.7 % |
|
805 |
4.2 % |
|
Multaq |
329 |
8.3 % |
5.4 % |
|
292 |
9.9 % |
|
22 |
-8.3 % |
|
15 |
7.1 % |
|
Praluent |
218 |
-15.8 % |
-15.8 % |
|
5 |
-94.3 % |
|
161 |
34.5 % |
|
52 |
52.9 % |
|
Aprovel |
419 |
-24.5 % |
-24.4 % |
|
10 |
-54.5 % |
|
87 |
-13.0 % |
|
322 |
-25.7 % |
|
Mozobil |
233 |
10.7 % |
8.9 % |
|
129 |
8.1 % |
|
60 |
9.1 % |
|
44 |
22.2 % |
|
Thymoglobulin |
350 |
13.3 % |
10.8 % |
|
207 |
12.6 % |
|
34 |
17.2 % |
|
109 |
13.5 % |
|
Generics |
699 |
-7.7 % |
-13.5 % |
|
117 |
-23.6 % |
|
7 |
-20.0 % |
|
575 |
-3.5 % |
|
Others |
4,212 |
-4.5 % |
-6.2 % |
|
380 |
0.3 % |
|
1,371 |
-10.3 % |
|
2,461 |
-1.8 % |
|
Cardiovascular & Established Rx Products |
8,875 |
-1.8
% |
-3.7
% |
|
1,178 |
-6.7
% |
|
2,560 |
-3.2
% |
|
5,137 |
0.1
% |
|
Industrial Sales |
808 |
0.5
% |
-0.6
% |
|
41 |
-35.8
% |
|
723 |
10.8
% |
|
44 |
-48.9
% |
|
General Medicines |
14,218 |
-1.4
% |
-3.4
% |
|
2,637 |
-4.8
% |
|
4,437 |
-1.4
% |
|
7,144 |
0.0
% |
| |
|
|
|
|
|
|
|
|
|
|
|
|
|
Pharmaceuticals |
26,970 |
7.6
% |
5.0
% |
|
10,484 |
12.7
% |
|
7,201 |
5.5
% |
|
9,285 |
3.9
% |
| |
|
|
|
|
|
|
|
|
|
|
|
|
|
Polio / Pertussis / Hib |
2,159 |
4.2 % |
2.5 % |
|
470 |
18.4 % |
|
306 |
-7.6 % |
|
1,383 |
2.7 % |
|
Booster Vaccines |
488 |
6.0 % |
4.5 % |
|
279 |
16.2 % |
|
146 |
-3.3 % |
|
63 |
-10.0 % |
|
Meningitis |
658 |
21.1 % |
17.7 % |
|
487 |
28.8 % |
|
1 |
0.0 % |
|
170 |
3.0 % |
|
Influenza Vaccines |
2,628 |
5.9 % |
6.3 % |
|
1,366 |
-13.6 % |
|
729 |
64.4 % |
|
533 |
16.4 % |
|
Travel and Endemic Vaccines |
306 |
3.3 % |
1.7 % |
|
86 |
20.5 % |
|
42 |
-10.6 % |
|
178 |
0.0 % |
|
Vaccines |
6,323 |
6.8
% |
5.9
% |
|
2,762 |
1.6
% |
|
1,225 |
25.6
% |
|
2,336 |
5.0
% |
| |
|
|
|
|
|
|
|
|
|
|
|
|
|
Allergy |
612 |
2.9 % |
-0.8 % |
|
371 |
7.5 % |
|
49 |
-3.9 % |
|
192 |
-3.4 % |
|
Cough and Cold |
320 |
-15.2 % |
-16.0 % |
|
— |
0.0 % |
|
156 |
-22.0 % |
|
164 |
-7.7 % |
|
Pain Care |
1,093 |
7.2 % |
4.0 % |
|
196 |
12.2 % |
|
515 |
7.5 % |
|
382 |
4.6 % |
|
Digestive Wellness |
1,131 |
17.6 % |
14.5 % |
|
124 |
51.8 % |
|
389 |
4.9 % |
|
618 |
21.1 % |
|
Physical Wellness |
323 |
-5.2 % |
-6.4 % |
|
— |
0.0 % |
|
29 |
7.4 % |
|
294 |
-6.3 % |
|
Mental Wellness |
211 |
12.5 % |
9.9 % |
|
46 |
9.3 % |
|
100 |
12.2 % |
|
65 |
15.3 % |
|
Personal Care |
519 |
3.5 % |
-0.2 % |
|
394 |
5.1 % |
|
4 |
33.3 % |
|
121 |
-2.3 % |
|
Non-Core / Others |
259 |
-11.0 % |
-13.7 % |
|
8 |
-33.3 % |
|
91 |
-33.8 % |
|
160 |
11.2 % |
|
Consumer Healthcare |
4,468 |
4.6
% |
1.7
% |
|
1,139 |
10.6
% |
|
1,333 |
-1.8
% |
|
1,996 |
5.7
% |
| |
|
|
|
|
|
|
|
|
|
|
|
|
|
Company |
37,761 |
7.1
% |
4.8
% |
|
14,385 |
10.3
% |
|
9,759 |
6.6
% |
|
13,617 |
4.4
% |
Appendix 2: Business net income statement
| Fourth Quarter 2021 |
Pharmaceuticals |
Vaccines |
Consumer Healthcare |
Other(1) |
Total Group |
| € million |
Q4 2021 |
Q4 2020(2) |
Change |
Q4 2021 |
Q4 2020(2) |
Change |
Q4 2021 |
Q4 2020(2) |
Change |
Q4 2021 |
Q4 2020(2) |
Change |
Q4 2021 |
Q4 2020(2) |
Change |
| Net sales |
6,919 |
6,293 |
9.9% |
1,964 |
2,060 |
-4.7% |
1,111 |
1,029 |
8.0% |
— |
— |
—% |
9,994 |
9,382 |
6.5% |
| Other revenues |
112 |
30 |
273.3% |
295 |
308 |
-4.2% |
14 |
16 |
-12.5% |
— |
— |
—% |
421 |
354 |
18.9% |
| Cost of Sales |
(1,817) |
(1,860) |
-2.3% |
(1,159) |
(1,118) |
3.7% |
(431) |
(386) |
11.7% |
(64) |
(75) |
-14.7% |
(3,471) |
(3,439) |
0.9% |
| As % of net sales |
(26.3)% |
(29.6)% |
|
(59.0)% |
(54.3)% |
|
(38.8)% |
(37.5)% |
|
|
|
|
(34.7)% |
(36.7)% |
|
| Gross Profit |
5,214 |
4,463 |
16.8% |
1,100 |
1,250 |
-12.0% |
694 |
659 |
5.3% |
(64) |
(75) |
-14.7% |
6,944 |
6,297 |
10.3% |
| As % of net
sales |
75.4% |
70.9% |
|
56.0% |
60.7% |
|
62.5% |
64.0% |
|
|
|
|
69.5% |
67.1% |
|
| Research and development expenses |
(1,185) |
(1,125) |
5.3% |
(210) |
(185) |
13.5% |
(49) |
(47) |
4.3% |
(141) |
(159) |
-11.3% |
(1,585) |
(1,516) |
4.6% |
| As % of net sales |
(17.1)% |
(17.9)% |
|
(10.7)% |
(9.0)% |
|
(4.4)% |
(4.6)% |
|
|
|
|
(15.9)% |
(16.2)% |
|
| Selling and general expenses |
(1,565) |
(1,388) |
12.8% |
(248) |
(227) |
9.3% |
(361) |
(345) |
4.6% |
(584) |
(642) |
-9.0% |
(2,758) |
(2,602) |
6.0% |
| As % of net sales |
(22.6)% |
(22.1)% |
|
(12.6)% |
(11.0)% |
|
(32.5)% |
(33.5)% |
|
|
|
|
(27.6)% |
(27.7)% |
|
| Other current operating
income/expenses |
(376) |
(148) |
|
5 |
2 |
|
11 |
35 |
|
4 |
(12) |
|
(356) |
(123) |
|
| Share of profit/loss of associates* and
joint ventures |
9 |
2 |
|
6 |
— |
|
3 |
2 |
|
— |
— |
|
18 |
4 |
|
| Net income attributable to non
controlling interests |
(6) |
(8) |
|
— |
— |
|
— |
— |
|
(1) |
— |
|
(7) |
(8) |
|
| Business operating
income |
2,091 |
1,796 |
16.4% |
653 |
840 |
-22.3% |
298 |
304 |
-2.0% |
(786) |
(888) |
-11.5% |
2,256 |
2,052 |
9.9% |
| As % of net
sales |
30.2% |
28.5% |
|
33.2% |
40.8% |
|
26.8% |
29.5% |
|
|
|
|
22.6% |
21.9% |
|
| |
|
|
|
|
|
|
|
|
|
|
|
|
|
|
|
| |
|
|
|
Financial income and
expenses |
(83) |
(93) |
|
| |
|
|
|
Income tax expenses |
|
|
|
|
(443) |
(432) |
|
| |
|
|
|
Tax rate** |
|
|
|
|
20.5% |
22.0% |
|
| |
|
|
|
Business net
income |
|
|
|
|
1,730 |
1,527 |
13.3% |
| |
|
|
|
As % of net
sales |
|
|
|
|
17.3% |
16.3% |
|
| |
|
|
|
|
|
|
|
|
|
|
|
| |
|
|
|
Business earnings /
share(in euros)*** |
1.38 |
1.22 |
13.1% |
* Net of tax.
** Determined on the basis of Business income before tax,
associates, and non-controlling interests.
*** Based on an average number of shares outstanding of 1,254.9
million in the fourth quarter of 2021 and 1,255.1 million in the
fourth quarter of
2020.
(1) Other includes the cost of
global support functions (Finance, Human Resources, Information
Solution & Technologies, Sanofi Business Services,
etc…).
(2) The 2020 items have been
represented in order to take into account the reallocation of
certain expenses, in particular the IT costs related to the new
Digital organization, which were previously allocated to the
Pharmaceuticals, Vaccines and Consumer Health Care segments and are
now accounted for under "Other". It includes also the impacts of
the IFRIC final agenda decision of April 2021 on the attribution of
benefits to periods of service.
| Full year
2021 |
Pharmaceuticals |
Vaccines |
Consumer Healthcare |
Other(1) |
Total Group |
| €
million |
FY 2021 |
FY 2020(2) |
Change |
FY 2021 |
FY 2020(2) |
Change |
FY 2021 |
FY 2020(2) |
Change |
FY 2021 |
FY 2020(2) |
Change |
FY 2021 |
FY 2020(2) |
Change |
| Net
sales |
26,970 |
25,674 |
5.0% |
6,323 |
5,973 |
5.9% |
4,468 |
4,394 |
1.7% |
— |
— |
—% |
37,761 |
36,041 |
4.8% |
| Other
revenues |
264 |
128 |
106.3% |
1,095 |
1,141 |
-4.0% |
55 |
59 |
-6.8% |
— |
— |
—% |
1,414 |
1,328 |
6.5% |
| Cost of
Sales |
(6,965) |
(6,982) |
-0.2% |
(3,430) |
(3,312) |
3.6% |
(1,606) |
(1,528) |
5.1% |
(250) |
(284) |
-12.0% |
(12,251) |
(12,106) |
1.2% |
| As % of net
sales |
(25.8)% |
(27.2)% |
|
(54.2)% |
(55.4)% |
|
(35.9)% |
(34.8)% |
|
|
|
|
(32.4)% |
(33.6)% |
|
| Gross
Profit |
20,269 |
18,820 |
7.7% |
3,988 |
3,802 |
4.9% |
2,917 |
2,925 |
-0.3% |
(250) |
(284) |
-12.0% |
26,924 |
25,263 |
6.6% |
| As %
of net sales |
75.2% |
73.3% |
|
63.1% |
63.7% |
|
65.3% |
66.6% |
|
|
|
|
71.3% |
70.1% |
|
| Research and
development expenses |
(4,330) |
(4,171) |
3.8% |
(712) |
(682) |
4.4% |
(153) |
(153) |
—% |
(497) |
(524) |
-5.2% |
(5,692) |
(5,530) |
2.9% |
| As % of net
sales |
(16.1)% |
(16.2)% |
|
(11.3)% |
(11.4)% |
|
(3.4)% |
(3.5)% |
|
|
|
|
(15.1)% |
(15.3)% |
|
| Selling and
general expenses |
(5,326) |
(4,927) |
8.1% |
(805) |
(789) |
2.0% |
(1,388) |
(1,419) |
-2.2% |
(2,036) |
(2,256) |
-9.8% |
(9,555) |
(9,391) |
1.7% |
| As % of net
sales |
(19.7)% |
(19.2)% |
|
(12.7)% |
(13.2)% |
|
(31.1)% |
(32.3)% |
|
|
|
|
(25.3)% |
(26.1)% |
|
| Other current
operating income/expenses |
(1,172) |
(487) |
|
128 |
3 |
|
111 |
53 |
|
(13) |
(130) |
|
(946) |
(561) |
|
| Share of
profit/loss of associates* and joint ventures |
17 |
5 |
|
11 |
2 |
|
11 |
9 |
|
— |
— |
|
39 |
16 |
|
| Net income
attributable to non controlling interests |
(49) |
(33) |
|
(1) |
— |
|
(5) |
(5) |
|
(1) |
— |
|
(56) |
(38) |
|
| Business
operating income |
9,409 |
9,207 |
2.2% |
2,609 |
2,336 |
11.7% |
1,493 |
1,410 |
5.9% |
(2,797) |
(3,194) |
-12.4% |
10,714 |
9,759 |
9.8% |
| As %
of net sales |
34.9% |
35.9% |
|
41.3% |
39.1% |
|
33.4% |
32.1% |
|
|
|
|
28.4% |
27.1% |
|
| |
|
|
|
|
|
|
|
|
|
|
|
|
|
|
|
| |
|
|
|
|
|
|
Financial income and expenses |
(328) |
(335) |
|
| |
|
|
|
|
|
|
Income tax expenses |
|
(2,173) |
(2,078) |
|
| |
|
|
|
|
|
|
Tax rate** |
|
20.9% |
22.0% |
|
| |
|
|
|
|
|
|
Business net income |
|
8,213 |
7,346 |
11.8% |
| |
|
|
|
|
|
|
As % of net sales |
|
21.7% |
20.4% |
|
| |
|
|
|
|
|
|
|
|
|
|
|
| |
|
|
|
|
|
|
Business earnings / share(in euros)*** |
6.56 |
5.86 |
11.9% |
* Net of
tax.
** Determined on the basis of Business income before tax,
associates, and non-controlling interests.
*** Based on an average number of shares outstanding of 1,252.5
million in the full year of 2021 and 1,253.6 million in the full
year of 2020.
(1) Other includes the cost of
global support functions (Finance, Human Resources, Information
Solution & Technologies, Sanofi Business Services,
etc…).
(2) The 2020 items have been
represented in order to take into account the reallocation of
certain expenses, in particular the IT costs related to the new
Digital organization, which were previously allocated to the
Pharmaceuticals, Vaccines and Consumer Health Care segments and are
now accounted for under "Other". It includes also the impacts of
the IFRIC final agenda decision of April 2021 on the attribution of
benefits to periods of service.
Appendix 3: Consolidated income statements
| €
million |
Q4 2021 |
Q4 2020 (1) |
FY 2021 |
FY 2020 (1) |
| Net
sales |
9,994 |
9,382 |
37,761 |
36,041 |
|
Other revenues |
421 |
354 |
1,414 |
1,328 |
|
Cost of sales |
(3,475) |
(3,439) |
(12,255) |
(12,159) |
| Gross
profit |
6,940 |
6,297 |
26,920 |
25,210 |
|
Research and development expenses |
(1,585) |
(1,516) |
(5,692) |
(5,530) |
|
Selling and general expenses |
(2,758) |
(2,602) |
(9,555) |
(9,391) |
|
Other operating income |
192 |
174 |
859 |
697 |
|
Other operating expenses |
(548) |
(297) |
(1,805) |
(1,415) |
|
Amortization of intangible assets |
(420) |
(394) |
(1,580) |
(1,681) |
|
Impairment of intangible assets (2) |
(15) |
(5) |
(192) |
(330) |
|
Fair value remeasurement of contingent consideration |
(5) |
48 |
(4) |
124 |
|
Restructuring costs and similar items |
(326) |
(214) |
(820) |
(1,089) |
|
Other gains and losses, and litigation (3) |
(1) |
— |
(5) |
136 |
Gain on Regeneron investment as result of transaction completed on
May 29th, 2020 (4)
|
— |
— |
— |
7,382 |
|
Operating income |
1,474 |
1,491 |
8,126 |
14,113 |
|
Financial expenses |
(93) |
(100) |
(368) |
(388) |
|
Financial income |
10 |
7 |
40 |
53 |
| Income
before tax and associates and joint ventures |
1,391 |
1,398 |
7,798 |
13,778 |
|
Income tax expense |
(268) |
(326) |
(1,558) |
(1,807) |
|
Share of profit/(loss) of associates and joint ventures |
18 |
4 |
39 |
359 |
| Net
income |
1,141 |
1,076 |
6,279 |
12,330 |
|
Net income attributable to non-controlling interests |
10 |
9 |
56 |
36 |
| Net
income attributable to equity holders of Sanofi |
1,131 |
1,067 |
6,223 |
12,294 |
| Average number
of shares outstanding (million) |
1,254.9 |
1,255.1 |
1,252.5 |
1,253.6 |
|
IFRS Earnings per share (in euros) |
0.90 |
0.85 |
4.97 |
9.81 |
(1) It Includes the impacts of
the IFRIC final agenda decisions of March 2021 on the costs of
configuring or customising application software used in a Software
as a Service (SaaS) arrangement) and of April 2021 on the
attribution of benefits to periods of service
(2) In 2021 and 2020, mainly
related to Sutimlimab impairments.
(3) In 2020, includes mainly the
gain on the sale of operations related to the Seprafilm product to
Baxter.
(4) In 2020, this line includes
the pre-tax income from the sale of Regeneron shares following the
public offer for sale and Regeneron's repurchase on May 29, 2020.
This amount includes the gain related to the remeasurement at fair
value of the 400,000 retained shares that could be used to finance
the R&D collaboration under the letter of agreement dated
2018.
Appendix 4: Reconciliation of Net income attributable to
equity holders of Sanofi to Business net income
| €
million |
Q4 2021 |
Q4 2020 (1) |
FY 2021 |
FY 2020 (1) |
| Net
income attributable to equity holders of Sanofi |
1,131 |
1,067 |
6,223 |
12,294 |
| Amortization of
intangible assets (2) |
420 |
394 |
1,580 |
1,681 |
| Impairment of
intangible assets (3) |
15 |
5 |
192 |
330 |
| Fair value
remeasurement of contingent consideration |
5 |
(48) |
4 |
(124) |
| Expenses arising
from the impact of acquisitions on inventories |
4 |
— |
4 |
53 |
| Restructuring
costs and similar items |
326 |
214 |
820 |
1,089 |
| Other gains and
losses, and litigation (4) |
1 |
— |
5 |
(136) |
| Gain on sale of
Regeneron shares on May 29, 2020 (5) |
— |
— |
— |
(7,225) |
| Tax effect of
the items listed above: |
(174) |
(105) |
(614) |
(270) |
|
Amortization and impairment of intangible assets |
(95) |
(117) |
(415) |
(541) |
|
Fair value remeasurement of contingent consideration |
(4) |
38 |
(2) |
39 |
|
Expenses arising from the impact of acquisitions on
inventories |
— |
— |
— |
(8) |
|
Restructuring costs and similar items |
(79) |
(36) |
(200) |
(299) |
|
Gain on sale of Regeneron shares on May 29, 2020 |
— |
2 |
— |
477 |
|
Other tax effects |
4 |
8 |
3 |
62 |
| Share of items
listed above attributable to non-controlling interests |
2 |
— |
(1) |
(3) |
| Restructuring
costs of associates and joint ventures, and expenses arising from
the impact of acquisitions on associates and joint ventures |
— |
— |
— |
(30) |
| Effect of
discontinuation of use of equity method for Regeneron investment
(6) |
— |
— |
— |
(313) |
| Business
net income |
1,730 |
1,527 |
8,213 |
7,346 |
|
IFRS earnings per share
(7) (in euros) |
0.90 |
0.85 |
4.97 |
9.81 |
(1) It Includes the impacts of
the IFRIC final agenda decisions of March 2021 on the costs of
configuring or customising application software used in a Software
as a Service (SaaS) arrangement) and of April 2021 on the
attribution of benefits to periods of service.
(2) Of which related to
amortization expense generated by the remeasurement of intangible
assets as part of business combinations: €394 million in the fourth
quarter of 2021 and €370 million in the fourth quarter of
2020.
(3) In 2021 and 2020, mainly
related to Sutimlimab impairments.
(4) In 2020, includes mainly the
gain on the sale of operations related to the Seprafilm product to
Baxter.
(5) This line includes the result
of the sale of 13 million of Regeneron’s shares as part of the
public offering and of the 9.8 million of its shares repurchased by
Regeneron. The amount does not include the gain related to the
remeasurement at fair value at this date of the 400,000 retained
shares.
(6) Our non-GAAP indicator
(Business Net Income) does not include the share of income related
to equity accounting from Regeneron since it ceased to be an
associate on May 29, 2020. As a result, this line reflects that
exclusion up to this date.
(7) Q4: Based on an average number
of shares outstanding of of 1,254.9 million in the fourth quarter
of 2021 and 1,255.1 million in the fourth quarter of 2020
FY : Based on an average number of shares outstanding of
1,252.5 million in the full year of 2021 and 1,253.6 million in the
full year of 2020.
Appendix 5: Change in net debt
| €
million |
FY 2021 |
FY 2020 |
(1) (2) |
| Business
net income |
8,213 |
7,346 |
|
| Depreciation
& amortization & impairment of property, plant and
equipment and software |
1,469 |
1,494 |
|
| Other items |
220 |
35 |
|
|
Operating cash flow |
9,902 |
8,875 |
|
| Changes in
Working Capital |
1,475 |
(35) |
|
| Acquisitions of
property, plant and equipment and software |
(1,400) |
(1,316) |
|
| Free
cash flow before restructuring, acquisitions and
disposals |
9,977 |
7,524 |
|
| Acquisitions of
intangibles assets, investments and other long-term financial
assets (3) |
(1,488) |
(562) |
|
| Restructuring
costs and similar items paid |
(1,060) |
(910) |
|
| Proceeds from
disposals of property, plant and equipment, intangible assets and
other non-current assets net of taxes (3) |
667 |
930 |
|
| Free
cash flow |
8,096 |
6,982 |
|
Acquisitions of
investments in consolidated undertakings including
assumed debt (4) |
(5,298) |
(5,786) |
|
| Proceeds from
Sale of Regeneron Shares on May 29,2020 net of taxes |
— |
10,370 |
|
| Issuance of
Sanofi shares |
186 |
203 |
|
| Acquisition of
treasury shares |
(382) |
(822) |
|
| Dividends paid
to shareholders of Sanofi |
(4,008) |
(3,937) |
|
| Other items |
213 |
(693) |
|
|
Change in net debt |
(1,193) |
6,317 |
|
|
Beginning of period |
8,790 |
15,107 |
|
|
Closing of net debt |
9,983 |
8,790 |
|
(1) Excluding any effect
of equity method accounting for Regeneron investment for
comparison purposes.
(2) Includes the impacts of the
IFRIC final agenda decisions of March 2021 on the costs of
configuring or customising application software used in a Software
as a Service (SaaS) arrangement and April 2021 on the attribution
of benefits to periods of service.
(3) Free cash flow includes
investments and divestments not exceeding a cap of €500 million per
transaction (inclusive of all payments related to the
transaction).
(4) Includes transactions that are
above a cap of €500 million per transaction (inclusive of all
payments related to the transaction).
Appendix 6: Simplified consolidated balance sheet
(1) Impacts of the IFRIC final agenda decisions of
March 2021 on the costs of configuring or customising
application software used in a Software as a Service (SaaS)
arrangement and of April 2021 on the attribution of benefits
to periods of service
Appendix 6: Simplified consolidated balance sheet 2020
reconciliation
| Assets (€
million) |
December
31, 2020 Published |
IFRIC’s
decisions impacts (1) |
December
31, 2020 Restated |
|
Liabilities & equity (€ million) |
December
31, 2020 Published |
IFRIC’s
decisions impacts (1) |
December
31, 2020 Restated |
| |
|
|
|
|
Equity
attributable to equity holders of Sanofi |
63,001 |
105 |
63,106 |
| |
|
|
|
|
Equity
attributable to non-controlling interests |
146 |
— |
146 |
| |
|
|
|
|
Total
equity |
63,147 |
105 |
63,252 |
| |
|
|
|
|
Long-term
debt |
19,745 |
— |
19,745 |
| Property, plant
and equipment - Owned Assets |
9,365 |
— |
9,365 |
|
Non-current lease
liabilities |
931 |
— |
931 |
| Right-of-use
assets |
1,198 |
— |
1,198 |
|
Non-current
liabilities related to business combinations and to non-controlling
interests |
387 |
— |
387 |
| Intangible assets
(including goodwill) |
62,785 |
(80) |
62,705 |
|
Non-current
provisions and other non-current liabilities |
7,536 |
(221) |
7,315 |
| Non-current
income tax assets |
248 |
— |
248 |
|
Non-current
income tax liabilities |
1,733 |
— |
1,733 |
| Non-current
financial assets & investments in associates and deferred tax
assets |
7,147 |
(36) |
7,111 |
|
Deferred tax
liabilities |
1,770 |
— |
1,770 |
|
Non-current assets |
80,743 |
(116) |
80,627 |
|
Non-current liabilities |
32,102 |
(221) |
31,881 |
| |
|
|
— |
|
Accounts payable
& Other current liabilities |
15,427 |
— |
15,427 |
| |
|
|
— |
|
Current
liabilities related to business combinations and to non-controlling
interests |
218 |
— |
218 |
| Inventories,
accounts receivable and other current assets |
18,580 |
— |
18,580 |
|
Current income
tax liabilities |
604 |
— |
604 |
| Current income
tax assets |
1,208 |
— |
1,208 |
|
Current lease
liabilities |
232 |
— |
232 |
| Cash and cash
equivalents |
13,915 |
— |
13,915 |
|
Short-term debt
and current portion of long-term debt |
2,767 |
— |
2,767 |
| Current
assets |
33,703 |
— |
33,703 |
|
Current
liabilities |
19,248 |
— |
19,248 |
| Assets held for
sale or exchange |
83 |
— |
83 |
|
Liabilities
related to assets held for sale or exchange |
32 |
— |
32 |
| Total
assets |
114,529 |
(116) |
114,413 |
|
Total
equity and liabilities |
114,529 |
(116) |
114,413 |
| |
|
|
|
|
|
|
|
|
(1) Impacts of the IFRIC final agenda decisions of
March 2021 on the costs of configuring or customising
application software used in a Software as a Service (SaaS)
arrangement and of April 2021 on the attribution of benefits
to periods of service
Appendix 7: Other current operating income net of expenses –
Regeneron Alliances
| €
million |
2021 |
2020 |
|
Monoclonal Antibodies
Alliance |
|
|
|
Income & Expense related to profit/loss sharing |
(1,253) |
(727) |
|
Additional share of profit paid by Regeneron related to development
costs |
127 |
75 |
|
Regeneron commercial operating expenses reimbursement |
(303) |
(349) |
|
Total: Monoclonal Antibody Alliance |
(1,429) |
(1,001) |
|
Immuno-Oncology Alliance |
|
|
|
Total Immuno-Oncology Alliance |
68 |
89 |
| Other
Regeneron |
|
|
|
Total others related to Regeneron (mainly Zaltrap) |
(12) |
(14) |
| Total
Regeneron Alliances |
(1,373) |
(926) |
Appendix 8: Currency sensitivity
2022 business EPS currency sensitivity
|
Currency |
Variation |
Business EPS Sensitivity |
| U.S. Dollar |
+0.05 USD/EUR |
-EUR 0.13 |
| Japanese
Yen |
+5 JPY/EUR |
-EUR 0.02 |
| Chinese
Yuan |
+0.2 CNY/EUR |
-EUR 0.02 |
| Brazilian
Real |
+0.4 BRL/EUR |
-EUR 0.01 |
|
Russian Ruble |
+10 RUB/EUR |
-EUR 0.02 |
Currency exposure on Q4 2021 sales
|
Currency |
Q4 2021 |
| US $ |
39.5
% |
| Euro € |
23.4 % |
| Chinese Yuan |
5.5 % |
| Japanese Yen |
4.0 % |
| Mexican Peso |
2.1 % |
| British Pound |
1.8 % |
| Canadian $ |
1.8 % |
| Brazilian Real |
1.5 % |
| Hungarian
Forint |
1.4 % |
| Russian ruble |
1.3 % |
|
Others |
17.7 % |
Currency average rates
| |
Q4 2020 |
Q4 2021 |
Change |
2020 |
2021 |
Change |
| €/$ |
1.19 |
1.14 |
-4.1% |
1.14 |
1.18 |
+3.7% |
| €/Yen |
124.54 |
130.06 |
+4.4% |
121.76 |
129.86 |
+6.7% |
| €/Yuan |
7.88 |
7.31 |
-7.2 % |
7.87 |
7.64 |
-3.0% |
| €/Real |
6.44 |
6.39 |
-0.8% |
5.89 |
6.48 |
+8.4% |
|
€/Ruble |
90.90 |
83.11 |
-8.6% |
82.62 |
87.23 |
+5.6% |
Appendix 9: Definitions of non-GAAP financial
indicators
Company sales at constant exchange rates
(CER)
When we refer to changes in our net sales “at
constant exchange rates” (CER), this means that we exclude the
effect of changes in exchange rates.
We eliminate the effect of exchange rates by
recalculating net sales for the relevant period at the exchange
rates used for the previous period.
Reconciliation of net sales to Company sales at constant
exchange rates for the fourth quarter and in 2021
| €
million |
Q4 2021 |
2021 |
| Net
sales |
9,994 |
37,761 |
| Effect of
exchange rates |
225 |
(850) |
|
Company sales at constant exchange rates |
9,769 |
38,611 |
Business net income
Sanofi publishes a key non-GAAP indicator.
Following the Regeneron shares transaction that was completed on
May 29, 2020, the definition of the non-GAAP financial measure
“Business net income” has been revised such that Share
of profit/(loss) from investments accounted for using the equity
method excludes the effects of applying the equity
method to the investment in Regeneron. The comparative periods of
2019 presented have been restated to reflect that adjustment.
Business net income is defined as net income
attributable to equity holders of Sanofi excluding:
-
amortization of intangible assets,
-
impairment of intangible assets,
-
fair value remeasurement of contingent consideration related to
business combinations or to disposals,
-
other impacts associated with acquisitions (including impacts of
acquisitions on associates and joint ventures),
-
restructuring costs and similar items(1),
-
other gains and losses (including gains and losses on disposals of
non-current assets(1)),
-
costs or provisions associated with litigation(1),
-
gain on Regeneron investment as a result of the transaction
completed on May 29, 2020 (the amount does not include the gain
related to the remeasurement at fair value at this date of the
400,000 retained shares),
-
tax effects related to the items listed above as well as effects of
major tax disputes,
-
effect of equity method accounting for Regeneron investment
(excluded from Business net income as a consequence of the sale of
the entire equity investment in Regeneron (with the exception of
400,000 shares retained by Sanofi) on May 29th 2020,
-
net income attributable to non-controlling interests related to the
items listed above.
(1) Reported in the line items
Restructuring costs and
similar items and Gains and
losses on disposals, and litigation, which are
defined in Notes B.19. and B.20. to our consolidated financial
statements.
Free cash flow
Free cash flow is a non-GAAP financial indicator
which is reviewed by our management, and which we believe provides
useful information to measure the net cash generated from the
Company’s operations that is available for strategic
investments1 (net of divestments1), for debt
repayment, and for capital return to shareholders. Free Cash Flow
is determined from the Business Net Income adjusted for
depreciation, amortization and impairment, share of profit/loss in
associates and joint ventures net of dividends received, gains
& losses on disposals, net change in provisions including
pensions and other post-employment benefits, deferred taxes,
share-based expense and other non-cash items. It comprises net
changes in working capital, capital expenditures and other asset
acquisitions2 net of disposal proceeds2, and
payments related to restructuring and similar items. Free cash flow
is not defined by IFRS and it is not a substitute measure for the
IFRS aggregate net cash flows in operating activities.
1 Amount of the transaction above a cap
of €500 million per transaction (inclusive of all payments related
to the transaction).
2 Not exceeding a cap of €500 million
per transaction (inclusive of all payments related to the
transaction).
Reconciliation from net cash provided by/(used in)
operating activities to free cash flow
| €
million |
2021 |
2020 (2) |
|
Net cash provided by/(used in) operating activities in the
Consolidated statements of cash
flows(1) |
10,522 |
7,418 |
|
Acquisition of property, plant and equipment and software |
(1,400) |
(1,316) |
| Acquisitions of
intangibles assets, investments and other long-term financial
assets(3) |
(1,488) |
(562) |
| Proceeds from
disposals of property, plant and equipment, intangible assets and
other non-current assets net of taxes(3) |
667 |
930 |
| Repayment of
lease liabilities |
(264) |
(234) |
|
Others |
59 |
746 |
|
Free cash flow(4) |
8,096 |
6,982 |
1 Most directly comparable IFRS measure
to free cash flow.
2 Includes the impacts of the IFRIC
final agenda decisions of March 2021 on the costs of configuring or
customising application software used in a Software as a Service
(SaaS) arrangement and April 2021 on the attribution of benefits to
periods of service.
3 Transactions up to €500 million per
transaction.
4 Non IFRS indicator (see definition in
Appendix 9).
In December 2019, Sanofi announced that it
expected to increase its annual Free Cash Flow (see definition
above) by approximately 50% by 2022 compared with an adjusted base
of €4.1bn in 2018.
1See Appendix 9 for definitions of financial
indicators.
2Sanofi has prioritized core assets in its General
Medicines portfolio with differentiated and/or established profiles
that have significant opportunity for growth in key markets. Core
assets include Toujeo, Soliqua, Praluent, Multaq, Lovenox, Plavix
and others for total sales of €5.6bn in 2020
3LMIC Low to Middle Income Countries
4See Appendix 3 for 2021 fourth-quarter
consolidated income statement; see Appendix 9 for definitions of
financial indicators, and Appendix 4 for reconciliation of IFRS net
income reported to business net income.
5Not exceeding €500 million per transaction
(inclusive of all payments related to the transaction).
6non-GAAP financial measure (definition in Appendix
9).


Sanofi (BIT:1SAN)
Historical Stock Chart
From Mar 2024 to Apr 2024

Sanofi (BIT:1SAN)
Historical Stock Chart
From Apr 2023 to Apr 2024
