SIFCO Industries, Inc. (NYSE American: SIF) today announced
financial results for its second quarter of fiscal 2020, which
ended March 31, 2020.
Second Quarter Results
- Net sales in the second quarter of fiscal 2020 increased 11.5%
to $30.5 million, compared with $27.4 million for the same period
in fiscal 2019.
- Net income for the second quarter of fiscal 2020 was $3.3
million, or $0.57 per diluted share, compared with net loss of $1.3
million, or $(0.23) per diluted share, in the second quarter of
fiscal 2019.
- EBITDA was $5.4 million in the second quarter of fiscal 2020
compared with $1.0 million in the second quarter of fiscal
2019.
- Adjusted EBITDA in the second quarter of fiscal 2020 was $4.5
million compared with Adjusted EBITDA being break-even at the
second quarter of fiscal 2019.
Year to Date Results
- Net sales in the first six months of fiscal 2020 increased 0.5%
to $56.7 million, compared with $56.5 million for the same period
in fiscal 2019.
- Net income in the first six months of fiscal 2020 was $1.9
million, or $0.33 per diluted share, compared with net loss of $2.5
million, or $(0.46) per diluted share in the first six months of
fiscal 2019.
- EBITDA was $6.0 million in the first six months of fiscal 2020
compared with EBITDA of $1.4 million in the first six months of
fiscal 2019.
- Adjusted EBITDA in the first six months of fiscal 2020 was $5.2
million compared with Adjusted EBITDA of $0.3 million in the first
six months of fiscal 2019.
Net income, EBITDA and Adjusted EBITDA results for the second
quarter and six months ended March 31, 2020 include higher margins
from productivity improvements as well as insurance recoveries at
the location where the fire occurred.
Other Highlights
CEO Peter W. Knapper stated, "The entire SIFCO team is meeting
the emergent challenges of the COVID-19 pandemic with safety as our
top priority as we serve our customers during these uncertain
times. I’m honored and humbled to work with a group of people that
preemptively created and implemented a control plan to safeguard
our employees, their families, and any guests to our sites before
governmental guidelines were announced. This effort has been
successful in avoiding any cases within the SIFCO family as of this
writing. We are considered an essential business and continue to
operate while fully complying with all governmental guidelines for
safety.
The restoration of our Orange, California facility is expected
to be completed in the fourth quarter. We have returned to partial
production in the impacted building and are making progress in
getting our customer schedules back on track. The second quarter
was strong in terms of financial performance as we continue to
execute on our business strategy. As we move forward in these
extremely volatile and uncertain times, we will focus on safely
serving our customers first, while aggressively conserving working
capital everywhere practical. While encouraged by the improved
performance in our second quarter, particularly in light of the
challenges presented by the COVID-19 pandemic, we recognize that
the pandemic and its impact on the global economy will continue to
present challenges to both the Company and our customers. In face
of the continued uncertainty created by the COVID-19 pandemic, the
Company is actively monitoring the Company’s liquidity and capital
resources and has taken proactive steps to preserve our financial
flexibility."
Use of Non-GAAP Financial Measures
The Company uses certain non-GAAP measures in this release.
EBITDA and Adjusted EBITDA are non-GAAP financial measures and are
intended to serve as supplements to results provided in accordance
with accounting principles generally accepted in the United States.
SIFCO Industries, Inc. believes that such information provides an
additional measurement and consistent historical comparison of the
Company’s performance. A reconciliation of the non-GAAP financial
measures to the most directly comparable GAAP measures is available
in this news release.
Forward-Looking Language
Certain statements contained in this press release are
“forward-looking statements” within the meaning of the Private
Securities Litigation Reform Act of 1995, such as statements
relating to financial results and plans for future business
development activities, and are thus prospective. Such
forward-looking statements are subject to risks, uncertainties and
other factors, which could cause actual results to differ
materially from future results expressed or implied by such
forward-looking statements. Potential risks and uncertainties
include, but are not limited to, economic conditions, concerns with
or threats of, or the consequences of, pandemics, contagious
diseases or health epidemics, including COVID-19, competition and
other uncertainties the Company, its customers, and the industry in
which they operate have experienced and continue to experience,
detailed from time to time in the Company’s Securities and Exchange
Commission filings. For a discussion of such risk factors and
uncertainties see Item 1A, "Risk Factors" in the Company's
Quarterly Report on Form10-Q for the quarter ended March 31, 2020
and other reports file by the Company with the Securities &
Exchange Commission.
The Company's Quarterly Report on Form 10-Q for the quarter
ended March 31, 2020 and Annual Report on Form 10-K for the year
ended September 30, 2019 and other reports filed with the
Securities & Exchange Commission can be accessed through the
Company's website: www.sifco.com, or
on the Securities and Exchange Commission's website: www.sec.gov.
SIFCO Industries, Inc. is engaged in the production of forgings
and machined components primarily for the aerospace and energy
markets. The processes and services include forging, heat-treating,
coating, and machining.
Second Quarter ended March 31,
(Amounts in thousands, except per share
data)
(Unaudited)
Three Months Ended March
31,
Six Months Ended March
31,
2020
2019
2020
2019
Net sales
$
30,537
$
27,392
$
56,744
$
56,458
Cost of goods sold
24,260
25,304
47,143
51,633
Gross profit
6,277
2,088
9,601
4,825
Selling, general and administrative
expenses
3,321
3,784
7,529
7,894
Amortization of intangible assets
408
413
817
828
Loss (gain) on disposal or impairment of
operating assets
41
—
41
(282
)
Gain on insurance proceeds received
(1,000
)
(1,164
)
(1,000
)
(1,164
)
Operating income (loss)
3,507
(945
)
2,214
(2,451
)
Interest income
—
(1
)
—
(2
)
Interest expense
262
315
513
607
Foreign currency exchange gain (loss),
net
(1
)
(1
)
—
(1
)
Other loss (income), net
25
(34
)
(84
)
(35
)
Income (loss) before income tax
benefit
3,221
(1,224
)
1,785
(3,020
)
Income tax (benefit) expense
(39
)
34
(134
)
(480
)
Net income (loss)
$
3,260
$
(1,258
)
$
1,919
$
(2,540
)
Net income (loss) per share
Basic
$
0.57
$
(0.23
)
$
0.34
$
(0.46
)
Diluted
$
0.57
$
(0.23
)
$
0.33
$
(0.46
)
Weighted-average number of common shares
(basic)
5,679
5,561
5,645
5,548
Weighted-average number of common shares
(diluted)
5,770
5,561
5,748
5,548
Non-GAAP Financial Measures
Presented below is certain financial information based on the
Company's EBITDA and Adjusted EBITDA. References to “EBITDA” mean
earnings (losses) from continuing operations before interest,
taxes, depreciation and amortization, and references to “Adjusted
EBITDA” mean EBITDA plus, as applicable for each relevant period,
certain adjustments as set forth in the reconciliations of net
income to EBITDA and Adjusted EBITDA.
Neither EBITDA nor Adjusted EBITDA is a measurement of financial
performance under generally accepted accounting principles in the
United States of America (“GAAP”). The Company presents EBITDA and
Adjusted EBITDA because management believes that they are useful
indicators for evaluating operating performance and liquidity,
including the Company’s ability to incur and service debt and it
uses EBITDA to evaluate prospective acquisitions. Although the
Company uses EBITDA and Adjusted EBITDA for the reasons noted
above, the use of these non-GAAP financial measures as analytical
tools has limitations. Therefore, reviewers of the Company’s
financial information should not consider them in isolation, or as
a substitute for analysis of the Company's results of operations as
reported in accordance with GAAP. Some of these limitations
include:
- Neither EBITDA nor Adjusted EBITDA reflects the interest
expense, or the cash requirements necessary to service interest
payments on indebtedness;
- Although depreciation and amortization are non-cash charges,
the assets being depreciated and amortized will often have to be
replaced in the future, and neither EBITDA nor Adjusted EBITDA
reflects any cash requirements for such replacements;
- The omission of the substantial amortization expense associated
with the Company’s intangible assets further limits the usefulness
of EBITDA and Adjusted EBITDA; and
- Neither EBITDA nor Adjusted EBITDA includes the payment of
taxes, which is a necessary element of operations.
Because of these limitations, EBITDA and Adjusted EBITDA should
not be considered as measures of discretionary cash available to
the Company to invest in the growth of its businesses. Management
compensates for these limitations by not viewing EBITDA or Adjusted
EBITDA in isolation and specifically by using other GAAP measures,
such as net income (loss), net sales, and operating income (loss),
to measure operating performance. Neither EBITDA nor Adjusted
EBITDA is a measurement of financial performance under GAAP, and
neither should be considered as an alternative to net loss or cash
flow from operations determined in accordance with GAAP. The
Company’s calculation of EBITDA and Adjusted EBITDA may not be
comparable to the calculation of similarly titled measures reported
by other companies.
The following table sets forth a reconciliation of net loss to
EBITDA and Adjusted EBITDA:
Dollars in thousands
Three Months Ended
Six Months Ended
March 31,
March 31,
2020
2019
2020
2019
Net income (loss)
$
3,260
$
(1,258
)
$
1,919
$
(2,540
)
Adjustments:
Depreciation and amortization expense
1,875
1,910
3,731
3,840
Interest expense, net
262
314
513
605
Income tax (benefit)
(39
)
34
(134
)
(480
)
EBITDA
5,358
1,000
6,029
1,425
Adjustments:
Foreign currency exchange gain, net
(1)
(1
)
(1
)
—
(1
)
Other income, net (2)
25
(34
)
(84
)
(35
)
(Loss) gain on disposal and impairment of
assets (3)
41
—
41
(282
)
Gain on insurance proceeds received
(4)
(1,000
)
(1,164
)
(1,000
)
(1,164
)
Equity compensation (5)
70
190
225
426
LIFO impact (6)
(33
)
(19
)
(57
)
Adjusted EBITDA
$
4,460
$
(28
)
$
5,200
$
312
(1)
Represents the gain or loss from changes in the exchange
rates between the functional currency and the foreign currency in
which the transaction is denominated.
(2)
Represents miscellaneous non-operating income or expense,
such as pension costs or grant income.
(3)
Represents the difference between the proceeds from the sale
of operating equipment and the carrying values shown on the
Company’s books or asset impairment of long-lived assets.
(4)
Represents the difference between the insurance proceeds
received for the damaged property and the carrying values shown on
the Company's books for the assets that were damaged in the fire at
the Orange location.
(5)
Represents the equity-based compensation expense recognized
by the Company under its 2016 Long-Term Incentive Plan (as the
amendment and restatement of, and successor to, the 2007 Long-Term
Incentive Plan) due to granting of awards, awards not vesting
and/or forfeitures.
(6)
Represents the change in the reserve for inventories for
which cost is determined using the last-in, first-out (“LIFO”)
method.
Reference to the above activities can found in the consolidated
financial statements included in Item 8 of this Annual Report on
Form 10-K.
View source
version on businesswire.com: https://www.businesswire.com/news/home/20200512005882/en/
SIFCO Industries, Inc. Thomas R. Kubera, 216-881-8600
www.sifco.com
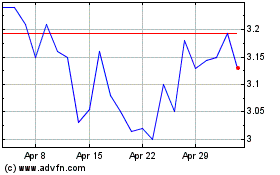
Sifco Industries (AMEX:SIF)
Historical Stock Chart
From Mar 2024 to Apr 2024

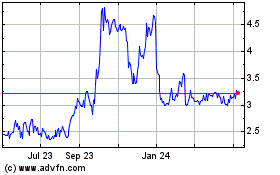
Sifco Industries (AMEX:SIF)
Historical Stock Chart
From Apr 2023 to Apr 2024
