Completed Strategic Acquisition of Sundance
Energy Updated 2022 Production and Capital Guidance FY22 Oil
Production to Increase Over 100% Year-Over-Year Preliminary 2023
Guidance; Targeting 63,000 Boe/d Projected 2023 Free Cash Flow
Yield of 40%
SilverBow Resources, Inc. (NYSE: SBOW) (“SilverBow” or “the
Company”) announced today that it has closed its previously
announced acquisition of substantially all of the oil and gas
assets from Sundance Energy, Inc. and certain affiliated entities,
(collectively, “Sundance"). Total purchase consideration due to
Sundance, subject to customary closing adjustments, was comprised
of approximately $225 million in cash and 4.1 million shares of
SilverBow’s common stock. The cash portion of the purchase was
funded with cash on hand and borrowings under the Company's
revolving credit facility. Further, SilverBow updated its outlook
to adjust for the recent closings of both the Sundance acquisition
and the acquisition of the assets of the oil and gas assets of
SandPoint Operating, LLC, a subsidiary of SandPoint Resources, LLC,
(collectively, “SandPoint") on May 10, 2022. Additionally, the
Company has provided its oil and gas hedged volumes as of the end
of the second quarter of 2022.
MANAGEMENT COMMENTS
Sean Woolverton, SilverBow’s Chief Executive Officer, commented,
“The successful closing of this acquisition provides a step-change
to SilverBow’s production base, drilling inventory and cash flow
profile. Our June production rate is set to increase by over 25% to
over 58,000 Boe/d by year-end, driven by the combination of
acquired production and the increase to our capital program by
adding a second rig. Our multi-year growth profile is significant,
as we estimate we will grow annual production 30% or more in both
2022 and 2023. Our increased scale is supported by over 600
high-return locations, providing over a decade of drilling
inventory at a two-rig pace and operating cash flows that fund our
development plan at a re-investment rate of approximately 60%.”
Mr. Woolverton commented further, “Our balanced portfolio
strategy provides us with optionality to allocate capital to
projects depending upon prevailing commodity prices. With the
current high oil and gas price environment, our plan is to dedicate
one rig towards liquids development and one rig towards gas
development for the near-term. Full year 2022 oil production is
expected to increase over 100% year-over-year with nearly 50% of
revenue coming from oil by year-end. Looking ahead, our preliminary
2023 outlook forecasts approximately $250 million in free cash
flow, representing a 40% free cash flow yield. We expect to track
toward 1.0x leverage and below while simultaneously pursuing our
growth strategy.”
2022 GUIDANCE
The updated 2022 guidance is provided in the table below and
shown comparatively to the SilverBow guidance provided earlier this
year when the Company announced its 2022 budget.
Full
Year 2022 Guidance
Prior
Updated
Production
Volumes:
Oil (BBL/D)
5,100 - 5,500
7,900 - 8,200
Gas (MMCF/D)
180 - 195
194 - 200
NGL (BBL/D)
4,000 - 4,500
5,100 - 5,400
Total Reported Production (MMCFE/D)
235 - 255
272 - 282
% Gas
77%
71%
Costs &
Expenses:
Lease Operating Expenses ($/MCFE)
$0.45 - $0.49
$0.59 - $0.63
Transportation and Processing ($/MCFE)
$0.28 - $0.32
$0.32 - $0.36
Production Taxes (% of Sales)
5.5% - 6.5%
5.5% - 6.5%
Cash G&A ($MM)
$15.0 - $16.5
$16.0 - $17.0
Capital Expenditures ($MM)
$180 - $200
$300 - $330
SilverBow estimates its average daily production for the second
quarter of 2022 to be 236 to 238 million cubic feet of gas
equivalent (“MMcfe/d”) (~78% gas) which includes 51 days of
production from the SandPoint assets. SilverBow expects to exit
December producing approximately 350 MMcfe/d, which represents a
25% increase compared to the Company’s average daily production for
the month of June.
Effective with the Sundance acquisition, SilverBow is running
two drilling rigs. One rig is dedicated to developing the Company’s
oily acreage and the other rig is primarily focused on SilverBow’s
gas portfolio. The Company’s expects to invest nearly $90 to $110
million in the third quarter of 2022 and deliver total production
of 293 to 308 MMcfe/d (68% gas).
SilverBow anticipates 2022 capital expenditures of $300 to $330
million to deliver total production between 272 and 282 MMcfe/d,
after incorporating SandPoint beginning in mid-May and Sundance
beginning in July.
2023 PRELIMINARY OUTLOOK
The Company’s 2023 production is expected to grow by over 35%
year-over-year to an annualized production volume of 63,000 Boe/d
which reflects SilverBow’s two-rig development program and a full
year of contributions from the acquired assets.
SilverBow expects to generate approximately $250 million of free
cash flow in 2023 based on $90 WTI and $4.75 Henry Hub pricing. The
Company estimates every $5.00 change in NYMEX oil price would
result in a change of $20 million in free cash flow and every $1.00
change in NYMEX natural gas price results in a change of $40
million in estimated free cash flow (assuming no change to 2023
hedge position).
SilverBow’s 2023 projected free cash flow yield is estimated at
40% based on the Company’s market capitalization as of July 1,
2022. SilverBow projects its re-investment rate to be approximately
60%.
LIQUIDITY UPDATE
As of June 30, 2022, the Company had approximately $9 million in
cash and $494 million of outstanding borrowings under its Credit
Facility. The Company had $275 million of undrawn capacity, after
factoring in approximately $6 million in letters of credit, and
approximately $9 million in cash, and resulting in approximately
$284 million of liquidity.
HEDGING UPDATE
As of June 29, 2022, SilverBow had 69% of total estimated
production volumes hedged for the remainder of 2022, using the
midpoint of production guidance. The Company's hedge book consists
of swaps and collars extending to the fourth quarter of 2024.
Additional details are shown below.
Oil
Hedge Position
3Q22
4Q22
1Q23
2Q23
3Q23
4Q23
1Q24
2Q24
3Q24
4Q24
Swaps:
WTI Volume (BBL/D)
5,747
6,086
3,913
3,435
3,804
4,188
2,000
1,250
1,250
1,250
Price ($/BBL)
$66.32
$74.00
$77.53
$76.65
$72.51
$74.76
$81.35
$81.80
$79.96
$78.36
Collars:
WTI Volume (BBL/D)
1,247
1,188
1,908
1,846
792
785
1,513
363
Ceiling Price ($/BBL)
$72.92
$70.97
$66.00
$64.89
$66.26
$65.13
$65.86
$60.72
Floor Price ($/BBL)
$56.37
$54.23
$47.37
$53.91
$59.27
$58.54
$51.61
$45.00
Three Way
Collars:
WTI Volume (BBL/D)
165
144
161
146
104
98
91
85
Ceiling Price ($/BBL)
$62.50
$62.14
$64.55
$64.53
$63.33
$63.35
$67.85
$67.85
Floor Price ($/BBL)
$53.27
$52.94
$55.14
$55.04
$53.41
$53.38
$57.50
$57.50
Subfloor Price ($/BBL)
$42.48
$42.21
$44.24
$44.19
$43.08
$43.08
$45.00
$45.00
Gas
Hedge Position
3Q22
4Q22
1Q23
2Q23
3Q23
4Q23
1Q24
2Q24
3Q24
4Q24
Swaps:
Henry Hub Volume (MCF/D)
67,470
47,818
12,900
22,593
32,348
42,250
8,198
55,714
55,000
55,000
Price ($/MMBTU)
$3.70
$3.95
$6.11
$4.43
$4.51
$4.71
$4.34
$3.86
$3.94
$4.21
Collars:
Henry Hub Volume (MCF/D)
90,384
99,265
125,199
113,420
109,309
95,272
56,165
1,022
2,152
2,011
Ceiling Price ($/MMBTU)
$3.29
$3.47
$4.98
$3.73
$3.89
$4.35
$5.54
$3.65
$3.33
$3.33
Floor Price ($/MMBTU)
$2.86
$2.90
$3.43
$3.07
$3.24
$3.47
$3.67
$3.15
$2.90
$2.90
Three Way
Collars:
Henry Hub Volume (MCF/D)
3,864
3,411
2,534
2,383
2,176
2,066
Ceiling Price ($/MMBTU)
$3.03
$3.01
$2.95
$2.94
$3.37
$3.37
Floor Price ($/MMBTU)
$2.56
$2.54
$2.50
$2.50
$2.50
$2.50
Subfloor Price ($/MMBTU)
$2.06
$2.04
$2.00
$2.00
$2.00
$2.00
INVESTOR PRESENTATION AND OTHER DETAILS
SilverBow has posted a presentation under the “Investor
Relations” section of the Company’s website, www.sbow.com.
Investors are encouraged to access for additional details and
information.
ABOUT SILVERBOW RESOURCES, INC.
SilverBow Resources, Inc. (NYSE: SBOW) is a Houston-based energy
company actively engaged in the exploration, development, and
production of oil and gas in the Eagle Ford Shale and Austin Chalk
in South Texas. With over 30 years of history operating in South
Texas, the Company possesses a significant understanding of
regional reservoirs which it leverages to assemble high quality
drilling inventory while continuously enhancing its operations to
maximize returns on capital invested. For more information, please
visit www.sbow.com. Information on the Company’s website is not
part of this release.
FORWARD-LOOKING STATEMENTS
This release includes “forward-looking statements” within the
meaning of Section 27A of the Securities Act of 1933, as amended,
and Section 21E of the Securities Exchange Act of 1934, as amended.
These forward-looking statements represent management's
expectations or beliefs concerning future events, and it is
possible that the results described in this release will not be
achieved. These forward-looking statements are based on current
expectations and assumptions and are subject to a number of risks
and uncertainties, many of which are beyond our control. All
statements, other than statements of historical fact included in
this press release, including those regarding our strategy, the
benefits of the acquisitions, future operations, guidance and
outlook, financial position, well expectations and drilling plans,
estimated production levels, expected oil and natural gas pricing,
estimated oil and natural gas reserves or the present value
thereof, reserve increases, service costs, impacts of inflation,
future free cash flow and expected leverage ratio, capital
expenditures, budget, projected costs, prospects, plans and
objectives of management are forward-looking statements. When used
in this report, the words “will,” “could,” “believe,” “anticipate,”
“intend,” “estimate,” “budgeted,” "guidance," “expect,” “may,”
“continue,” “predict,” “potential,” “plan," “project” and similar
expressions are intended to identify forward-looking statements,
although not all forward-looking statements contain such
identifying words. Important factors that could cause actual
results to differ materially from our expectations include, but are
not limited to, risks and uncertainties discussed in the Company’s
reports filed with the SEC.
All forward-looking statements speak only as of the date of this
news release. You should not place undue reliance on these
forward-looking statements. The Company’s capital budget, operating
plan, service cost outlook and development plans are subject to
change at any time. Although we believe that our plans, intentions
and expectations reflected in or suggested by the forward-looking
statements we make in this release are reasonable, we can give no
assurance that these plans, intentions or expectations will be
achieved. The risk factors and other factors noted herein and in
the Company's SEC filings could cause its actual results to differ
materially from those contained in any forward-looking statement.
These cautionary statements qualify all forward-looking statements
attributable to us or persons acting on our behalf.
All subsequent written and oral forward-looking statements
attributable to us or to persons acting on our behalf are expressly
qualified in their entirety by the foregoing. We undertake no
obligation to publicly release the results of any revisions to any
such forward-looking statements that may be made to reflect events
or circumstances after the date of this release or to reflect the
occurrence of unanticipated events, except as required by law.
View source
version on businesswire.com: https://www.businesswire.com/news/home/20220705005168/en/
Jeff Magids Director of Finance & Investor Relations (281)
874-2700, (888) 991-SBOW
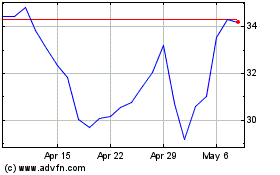
SilverBow Resources (NYSE:SBOW)
Historical Stock Chart
From Mar 2024 to Apr 2024

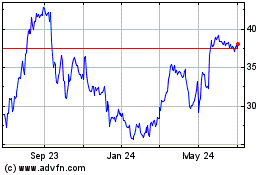
SilverBow Resources (NYSE:SBOW)
Historical Stock Chart
From Apr 2023 to Apr 2024
