ALKM Tests $0.0019 200 Day MA - Penny Land Run?
September 03 2021 - 10:48AM
InvestorsHub NewsWire
September 3, 2021 -- InvestorsHub
NewsWire -- via pennymillions --
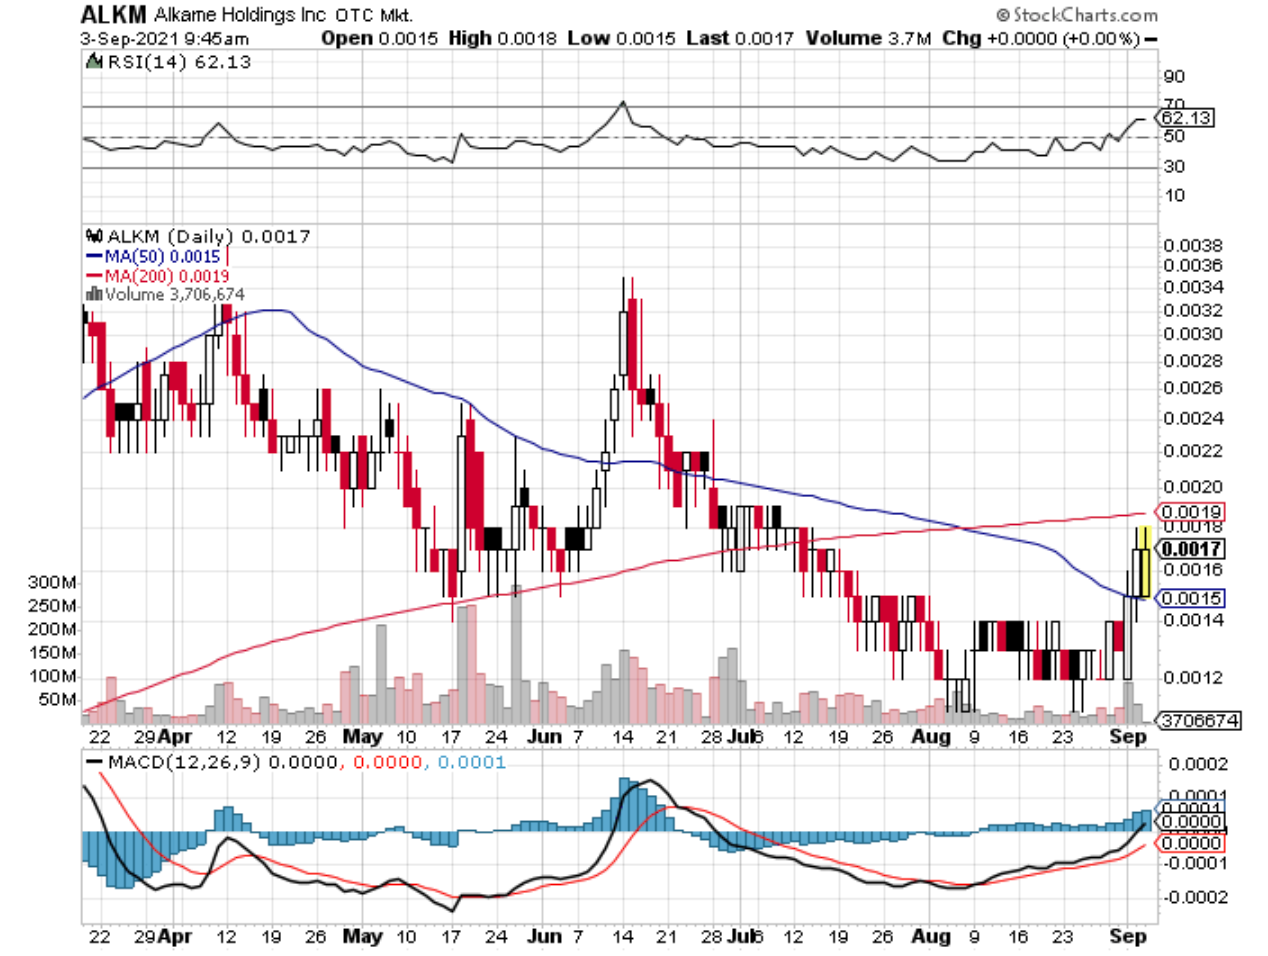
Trading this morning in Alkame
Holdings, Inc. (ALKM)
is testing the $0.0019 200 Day Moving Average (MA). Earlier
this week the PPS broke through the 50 Day MA on balance sheet
restructuring news. A 200 Day MA breakthrough could trigger a
run back to the $0.009 52 Week High.
Source - https://www.pennymillions.com/blog/alkm-tests-00019-200-day-ma-pennyland-run
Other stocks on the move include CHNC, TGGI and
DRNG.
SOURCE: pennymillions
Alkame (CE) (USOTC:ALKM)
Historical Stock Chart
From Mar 2024 to Apr 2024
 Charts.")
Alkame (CE) (USOTC:ALKM)
Historical Stock Chart
From Apr 2023 to Apr 2024
 Charts.")