PASADENA, Calif., Oct. 26, 2020 /PRNewswire/ -- Alexandria
Real Estate Equities, Inc. (NYSE:ARE) announced financial and
operating results for the third quarter ended September 30,
2020.
|
Key
highlights
|
|
|
|
|
YTD
|
|
|
Operating
results
|
3Q20
|
|
3Q19
|
|
3Q20
|
|
3Q19
|
|
|
Total
revenues:
|
|
|
|
|
|
|
|
|
|
In millions
|
$
|
545.0
|
|
$
|
390.5
|
|
$
|
1,421.9
|
|
$
|
1,123.2
|
|
|
Growth
|
39.6%
|
|
|
|
26.6%
|
|
|
|
|
Net income (loss)
attributable to Alexandria's common stockholders –
diluted
|
|
In millions
|
$
|
79.3
|
|
$
|
(49.8)
|
|
$
|
324.2
|
|
$
|
150.4
|
|
|
Per share
|
$
|
0.63
|
|
$
|
(0.44)
|
|
$
|
2.61
|
|
$
|
1.35
|
|
|
Funds from operations
attributable to Alexandria's common stockholders – diluted, as
adjusted
|
|
|
In millions
|
$
|
230.7
|
|
$
|
197.1
|
|
$
|
677.1
|
|
$
|
579.6
|
|
|
Per share
|
$
|
1.83
|
|
$
|
1.75
|
|
$
|
5.46
|
|
$
|
5.19
|
|
Alexandria and its tenants
at the vanguard and heart of the life science ecosystem
Bringing together our unique and pioneering strategic vertical
platforms of essential Labspace® real estate, strategic
venture investments, impactful thought leadership, and purposeful
corporate responsibility, Alexandria is at the vanguard and heart of the
vital life science ecosystem that is advancing solutions for
COVID-19 and other key challenges to human health. Safe and
effective vaccines and therapies, in addition to widespread
testing, continue to be critically needed to combat the global
COVID-19 pandemic. By maintaining continuous operations across our
campuses and facilities, Alexandria has enabled our tenants, nearly 100
of which have programs focused on COVID-19, to continue to pursue
their essential, mission-critical research, development,
manufacturing, and commercialization efforts. Refer to
"Alexandria and Its Innovative
Tenants Are at the Vanguard and Heart of the Life Science Ecosystem
Advancing Solutions for COVID-19" of this Earnings Press Release
for additional detail.
Strong and flexible balance sheet with significant
liquidity
- $3.9 billion of liquidity as of
September 30, 2020, proforma for our
unsecured senior line of credit amended in October 2020. Refer to "Key credit metrics" of
our Supplemental Information for additional details.
- Minimal debt, 1.5% of total outstanding debt, maturing prior to
2024.
- 10.6 years weighted-average remaining term of debt as of
September 30, 2020.
- Investment-grade credit ratings, which rank in the top 10%
among all publicly traded REITs, of Baa1/Stable from Moody's
Investors Service and BBB+/Stable from S&P Global Ratings, both
as of September 30, 2020.
Continued dividend strategy to share growth in cash flows
with stockholders
Common stock dividend declared for 3Q20 of $1.06 per common share, aggregating $4.18 per common share for the twelve months
ended September 30, 2020, up
24 cents, or 6%, over the twelve
months ended September 30, 2019. Our
FFO payout ratio of 61% for the three months ended
September 30, 2020, allows us to share growth in cash flows
from operating activities with our stockholders while also
retaining a significant portion for reinvestment.
A REIT industry-leading, high-quality tenant roster
- 54% of annual rental revenue from investment-grade or publicly
traded large cap tenants.
- Weighted-average remaining lease term of 7.7 years.
Key strategic transactions generated capital for investment
into our highly leased value-creation pipeline
- During 3Q20, we completed two strategic transactions in our
SoMa submarket that generated capital aggregating $284.2 million for investment into our highly
leased development and redevelopment projects currently under
construction:
-
- Disposition of 945 Market Street, aggregating 255,765 RSF, for
a sales price of $198.0 million.
- Termination of our contract with Pinterest, Inc. related to a
future lease of 488,899 RSF at our 88 Bluxome Street development
project, which has not commenced vertical construction. We
recognized income of $86.2 million
that comprise a termination fee of $89.5
million and related expenses of $3.3
million.
High-quality revenues and cash flows, strong Adjusted EBITDA
margin, and operational excellence
|
Percentage of annual
rental revenue in effect from:
|
|
|
|
|
|
Investment-grade or
publicly traded large cap tenants
|
|
54%
|
|
|
|
Class A properties in
AAA locations
|
|
73%
|
|
|
|
Occupancy of
operating properties in North America
|
|
94.9%
|
(1)
|
|
|
Operating
margin
|
|
74%
|
(2)
|
|
|
Adjusted EBITDA
margin
|
|
67%
|
|
|
|
Weighted-average
remaining lease term:
|
|
|
|
|
|
All tenants
|
|
7.7
|
years
|
|
Top 20
tenants
|
|
11.0
|
years
|
|
|
|
|
|
|
|
|
(1)
|
Includes 859,479 RSF,
or 2.8%, of vacancy in our North America markets, representing
lease-up opportunities at properties recently acquired. Excluding
these acquired vacancies, occupancy of operating properties in
North America was 97.7% as of September 30, 2020, up 60 bps
from 97.1% as of June 30, 2020. Refer to "Occupancy" of our
Supplemental Information for additional details regarding vacancy
from recently acquired properties.
|
|
(2)
|
Includes the effect
of a termination fee recognized during 3Q20. Excluding this effect,
our operating margin for 3Q20 would have been 70%.
|
Continued solid net operating income and internal
growth
- Net operating income (cash basis) of $1.4 billion for 3Q20 annualized, up $483.7 million, or 50.2%, compared to 3Q19
annualized.
- 94% of our leases contain contractual annual rent escalations
approximating 3%.
- Same property net operating income growth:
-
- 2.9% and 4.9% (cash basis) for 3Q20 over 3Q19.
- 2.3% and 4.8% (cash basis) for YTD 3Q20 over YTD 3Q19.
- Continued solid leasing activity and rental rate growth in 3Q20
over expiring rates on renewed and re-leased space:
|
|
|
|
3Q20
|
|
YTD 3Q20
|
|
|
Total leasing
activity – RSF
|
|
1,208,382
|
|
2,989,247
|
|
|
Leasing of
development and redevelopment space – RSF
|
|
313,939
|
|
524,210
|
|
|
Lease renewals and
re-leasing of space:
|
|
|
|
|
|
|
RSF (included in total
leasing activity above)
|
|
605,765
|
|
1,856,917
|
|
|
Rental rate
increases
|
|
39.9%
|
|
40.7%
|
|
|
Rental rate increases
(cash basis)
|
|
30.9%
|
|
21.5%
|
Sustained strength in tenant collections during the ongoing
COVID-19 pandemic
- We have collected rents and tenant recoveries as follows:
-
- 99.7% for the three months ended September 30, 2020; and
- 99.7% for October 2020 as of
October 23, 2020.
- As of June 30, 2020 and
September 30, 2020, our tenant
receivables balances were $7.2
million and $7.6 million,
respectively, our two lowest quarter-end balances since 2013.
Key items included in operating results
|
Key items included in
net income attributable to Alexandria's common
stockholders:
|
|
|
|
|
|
|
|
|
|
YTD
|
|
3Q20
|
|
3Q19
|
|
3Q20
|
|
3Q19
|
|
3Q20
|
|
3Q19
|
|
3Q20
|
|
3Q19
|
|
(In millions,
except per
share amounts)
|
Amount
|
|
Per Share –
Diluted
|
|
Amount
|
|
Per Share –
Diluted
|
|
Unrealized (losses)
gains on non-real
estate investments
|
$
|
(14.0)
|
|
$
|
(70.0)
|
|
$
|
(0.11)
|
|
$
|
(0.62)
|
|
$
|
140.5
|
|
$
|
13.2
|
|
$
|
1.13
|
|
$
|
0.12
|
|
Gain on sales of
real
estate
|
1.6
|
|
—
|
|
0.01
|
|
—
|
|
1.6
|
|
—
|
|
0.01
|
|
—
|
|
Impairment of real
estate
|
(7.7)
|
|
—
|
|
(0.06)
|
|
—
|
|
(30.5)
|
|
—
|
|
(0.24)
|
|
—
|
|
Impairment of
non-real
estate investments
|
—
|
|
(7.1)
|
|
—
|
|
(0.06)
|
|
(24.5)
|
|
(7.1)
|
|
(0.20)
|
|
(0.06)
|
|
Loss on early
extinguishment of debt
|
(52.8)
|
|
(40.2)
|
|
(0.42)
|
|
(0.36)
|
|
(52.8)
|
|
(47.6)
|
|
(0.42)
|
|
(0.43)
|
|
Loss on early
termination of interest
rate hedge agreements
|
—
|
|
(1.7)
|
|
—
|
|
(0.02)
|
|
—
|
|
(1.7)
|
|
—
|
|
(0.02)
|
|
Termination
fee(1)
|
86.2
|
|
—
|
|
0.69
|
|
—
|
|
86.2
|
|
—
|
|
0.69
|
|
—
|
|
Acceleration of
stock
compensation expense
due to executive officer
resignation
|
(4.5)
|
|
—
|
|
(0.04)
|
|
—
|
|
(4.5)
|
|
—
|
|
(0.04)
|
|
—
|
|
Preferred stock
redemption charge
|
—
|
|
—
|
|
—
|
|
—
|
|
—
|
|
(2.6)
|
|
—
|
|
(0.02)
|
|
Total
|
$
|
8.8
|
|
$
|
(119.0)
|
|
$
|
0.07
|
|
$
|
(1.06)
|
|
$
|
116.0
|
|
$
|
(45.8)
|
|
$
|
0.93
|
|
$
|
(0.41)
|
|
|
|
|
|
|
|
|
|
|
|
|
|
|
|
|
|
(1)
|
Refer to the previous
page for additional details.
|
Strategic acquisitions with significant value-creation
opportunities in key submarkets
- During 3Q20, we completed acquisitions of 24 properties
aggregating 4.7 million SF, including 2.2 million RSF from our
acquisition of Alexandria Center® for Life Science –
Durham (described below) and 1.5
million RSF of future value-creation opportunities, for an
aggregate purchase price of $1.3
billion. Refer to "Acquisitions" of this Earnings Press
Release for additional details.
- In August 2020, we acquired
Alexandria Center® for Life Science – Durham, a 16-building collaborative life
science campus aggregating 2.2 million RSF, located in our Research
Triangle market for $590.4 million.
The campus comprises 12 operating properties, one operating
property with future redevelopment opportunities, and three
properties that are currently undergoing redevelopment. The 13
operating properties generate 99% of annual rental revenue from
investment-grade tenants. The acquisition of this campus, which is
in close proximity to renowned academic institutions, including
Duke University, North Carolina State University, and the
University of North Carolina at Chapel
Hill, allows us to allocate capital into a key innovation
cluster with significant opportunities for incremental net
operating income and organic growth.
Highly leased value-creation pipeline, including
COVID-19-focused R&D space
- Current and pre-leased near-term projects aggregating 4.1
million RSF, including COVID-19-focused R&D spaces, are highly
leased/negotiating at 74% and will generate significant revenues
and cash flows. Key highlights include:
-
- Continued leasing/negotiating progress on projects that were
under construction as of 2Q20, 80% leased/negotiating;
- 902,381 RSF added to projects under construction that are 54%
leased/negotiating;
- 493,986 RSF of near-term projects that are highly
leased/negotiating at 80%.
- Annual net operating income (cash basis), including our share
of unconsolidated real estate joint ventures, is expected to
increase by $27 million upon the
burn-off of initial free rent on recently delivered projects.
Balance sheet management
Key metrics as of September 30, 2020
- $29.2 billion of total market
capitalization.
- $21.3 billion of total equity
capitalization.
- $3.9 billion of liquidity as of
September 30, 2020, proforma for our
unsecured senior line of credit amended in October 2020.
|
|
3Q20
|
|
Goal
|
|
|
Quarter
|
|
Trailing
|
|
4Q20
|
|
|
Annualized
|
|
12 Months
|
|
Annualized
|
|
Net debt and
preferred stock to
Adjusted EBITDA
|
|
5.8x
|
|
6.0x
|
|
Less than or equal to
5.3x
|
|
Fixed-charge coverage
ratio
|
|
4.3x
|
|
4.3x
|
|
Greater than or equal
to 4.4x
|
|
|
|
|
|
|
|
|
|
|
|
|
|
|
|
|
|
Value-creation
pipeline of new Class A development and redevelopment
projects as a percentage of gross investments in real
estate
|
|
3Q20
|
|
Current and pre-leased
near-term projects 74% leased/negotiating
|
|
7%
|
|
Income-producing/potential cash flows/covered land
play(1)
|
|
6%
|
|
Land
|
|
3%
|
|
|
|
|
|
(1)
|
Includes projects
that have existing buildings that are generating or can generate
operating cash flows. Also includes development rights associated
with existing operating campuses.
|
Key capital events
- In August 2020, we
opportunistically issued $1.0 billion
of unsecured senior notes payable due in 2033 at an interest rate
of 1.875% ("1.875% Unsecured Senior Notes").
- We used a portion of the proceeds from our 1.875% Unsecured
Senior Notes to refinance $500.0
million of our 3.90% unsecured senior notes payable due in
2023, pursuant to a partial cash tender offer completed on
August 5, 2020, and a subsequent call
for redemption for the remaining outstanding amounts, which settled
on September 4, 2020. As a result of
our debt refinancing, we recognized a loss on early extinguishment
of debt of $50.8 million, including
the write-off of unamortized loan fees.
- In October 2020, we amended our
unsecured senior line of credit. Key changes include:
|
|
|
|
|
New
Agreement
|
|
Change
|
|
|
|
Commitments available
for borrowing
|
|
$3.0
billion
|
|
Up $800
million
|
|
|
|
Interest
rate
|
|
LIBOR+0.825%
|
|
Added a 0% LIBOR
floor
|
|
|
|
Maturity
date
|
|
January 6,
2026
|
|
Extended 2
years
|
|
|
|
|
|
|
|
|
- In January 2020 and July 2020, we completed $1.0 billion and $1.1
billion of forward equity sales agreements, respectively, to
sell an aggregate of 6.9 million shares for each offering (13.8
million in aggregate) of our common stock (including the exercise
of underwriters' options) at public offering prices of $155.00 per share and $160.50 per share, respectively, before
underwriting discounts.
-
- In March 2020, we settled 3.4
million shares and received proceeds of $500.0 million. In September 2020, we settled 8.7 million shares and
received proceeds of $1.3
billion.
- As of October 26, 2020, 1.8
million shares of our common stock remain outstanding under forward
equity sales agreements, for which we expect to receive proceeds of
$267.4 million, to be further
adjusted as provided in the sales agreements, that will fund
pending and recently completed acquisitions and the construction of
our highly leased development projects. We expect to settle the
remaining outstanding forward equity sales agreements in 2020.
- During 3Q20 and through October 26,
2020, there was no sale activity under our "at-the-market"
common stock offering program ("ATM program"). As of October 26, 2020, we have $843.7 million remaining available under our ATM
program.
Investments
- Our investments in publicly traded companies and privately held
entities aggregated a carrying amount of $1.3 billion, including an adjusted cost basis of
$788.8 million and unrealized gains
of $542.1 million, as of September 30, 2020.
- Investment income of $3.3 million
during 3Q20 included $17.4 million in
realized gains and $14.0 million in
unrealized losses.
Leader in corporate responsibility: catalyzing and leading
the way for positive societal change
Industry leadership
- In July 2020, Alexandria Venture
Investments, our strategic venture capital platform, was recognized
as the most active biopharma investor by new deal volume from 2019
to 1H20 by Silicon Valley Bank in its "Mid-Year 2020 Healthcare
Investments and Exits Report." Alexandria's venture activity provides us
with, among other things, mission-critical data and knowledge on
innovations and trends.
- In September 2020, Alexandria won the Commercial Brokers
Association ("CBA") Boston Landlord of the Year award. The CBA was
established as a freestanding division of the Greater Boston Real
Estate Board in 2001 and represents over 400 members in the
commercial brokerage community throughout Massachusetts.
Pioneering social responsibility initiatives to continue to
drive unique, disruptive, and highly impactful solutions to tackle
some of society's most complex and pressing challenges
Alexandria is profoundly
committed to driving forward significant collaborative and
innovative solutions to address some of today's most urgent and
widespread societal challenges, including the COVID-19 pandemic,
the opioid crisis, poverty, and disparities in educational
opportunities. We align every aspect of our multifaceted business
model and visionary social responsibility efforts to support our
mission to advance human health, as well as to drive tangible and
positive results in our local communities.
At the vanguard and heart of the life science ecosystem that
is crucial to advancing innovative solutions for COVID-19
- Alexandria has enabled notable
life science tenants to continue their essential on-site operations
as part of the industry's collective efforts to improve the
quality, capacity, and turnaround time for COVID-19 testing. In
addition, we have leveraged our network of experts to focus on the
health, safety, and well-being of our tenants and their employees
by increasing and improving their access to COVID-19 testing in
critical locations, such as New York
City and Cambridge.
- Alexandria has pioneered and
implemented robust, cutting-edge initiatives for safer buildings,
which have been reviewed and validated by our COVID-19 Advisory
Board, along with building optimization measures and operational
protocols that encompass a variety of research-backed initiatives,
including informational health and safety graphics, disinfectant
cleaning guidelines, improved air filtration, effective health
security communications, and the implementation of
building-specific guidelines and policies that call for active
cooperation of building occupants and service providers.
- As a testament to our comprehensive and industry-leading
COVID–19 prevention guidelines and practices, which expand upon our
existing rigorous health and safety standards, we were recognized
by the Center for Active Design, the operator of Fitwel, as the
first-ever company to achieve a Fitwel Viral Response Certification
with Distinction, the highest designation within the new Viral
Response Module developed by the world's leading healthy building
certification system.
- Alexandria has sourced over
54,000 pieces of personal protective equipment worldwide and
donated these mission-critical supplies to protect and support
healthcare workers in some of the nation's hardest-hit cities,
including New York City,
Boston, Seattle, Los
Angeles, and San
Diego.
- Alexandria has donated more
than $1 million to several highly
impactful national and regional organizations supporting
communities severely affected by the pandemic, including ROAR
(Relief Opportunities for All Restaurants), which makes
financial relief available to New York
City's nearly 1 million restaurant workers, and
Robin Hood, New York City's largest poverty-fighting
organization, of which our executive chairman and founder,
Joel S. Marcus, has served on the
board of directors since 2016.
Pioneering a fully integrated ecosystem to reverse the
trajectory of the opioid epidemic and support addiction
recovery
- Determined to reverse the trajectory of the U.S. opioid crisis,
which is one of the most pervasive public health challenges in our
nation's history, Alexandria, in
partnership with Verily Life Sciences, envisioned an innovative,
non-profit healthcare ecosystem dedicated to the full and sustained
recovery of people living with addiction. To realize this vision,
Alexandria and Verily Life
Sciences pioneered a fully integrated campus to house an
evidence-based comprehensive treatment model encompassing a full
continuum of care with dedicated facilities and services for
treatment, residential housing, group therapy, family
reunification, workforce development programs, job placement, and
community transition.
- As the strategic real estate partner in this mission-critical
initiative, Alexandria catalyzed
the vision for and led the design and development of the 4.3-acre,
59,000 RSF campus in Dayton, Ohio,
aimed at revolutionizing the way addiction is treated. Since the
opening of the Outpatient Clinic in the fall of 2019 and the Crisis
Stabilization Unit in the winter of 2020, OneFifteen has served
more than 1,500 patients and carried out more than 2,000 virtual
visits. In September 2020,
Alexandria delivered OneFifteen
Living, a three-story residential housing facility that serves as a
safe place for patients to live as they access on-campus treatment
services.
- As overdose deaths rise dramatically against the backdrop of
the COVID-19 pandemic, Alexandria
is committed to addressing this public health crisis and developing
effective, scalable solutions. It is our hope that OneFifteen's
groundbreaking, evidence-based, comprehensive treatment strategy
will drive superior health outcomes and serve as a model of
recovery for the rest of the country to replicate.
Empowering students through educational opportunities that
build foundations and pave paths for long-term success
- Alexandria is deeply committed
to driving educational opportunities and providing the support and
resources needed to build the foundations for underprivileged
students to succeed and become engaged and leading members of
society. Understanding that education is one of the most
fundamental foundations for a safe, healthy, and good life and
essential for opportunity and economic mobility, we have forged
deep partnerships in our communities with highly impactful
organizations that provide holistic educational resources to
underserved populations.
- In Durham, North Carolina, we
work closely with the Emily Krzyzewski Center, a non-profit
organization that paves a path to success in higher education for
academically focused, low-income K–12 students. Through programs
that build and accelerate students' scholastic skills, the center
has supported exceptional achievement throughout the students'
years in high school and higher education and in their careers.
Students receive holistic support that encompasses academic skills
development, personal management and leadership training, college
planning, and career exploration. Of those who complete Emily K's
Scholars to College program, 100% are accepted to college each
year.
- Through our long-term, hands-on partnership with CS4ALL
(Computer Science for All), we are helping to ensure that all
of New York City's 1.1 million
public school students, 72.8% of whom are considered low income,
have access to high-quality computer science coursework throughout
their K–12 education. We believe that STEM (science, technology,
engineering, and mathematics) education is important for preparing
students for academic success, the 21st-century job market, and
beyond.
- In August 2020, we pledged to
donate $1.5 million to the
San Carlos School District
and the San Carlos Education Foundation, extending our
strong commitment to enhancing neighborhoods where we develop and
operate. The generous donation fills the school district's funding
gap resulting from the economic impact of COVID-19 and,
importantly, will enable San
Carlos public schools to continue to offer quality education
to its students.
- In August 2020, we made a pledge
to the South San Francisco Unified School District through
the California Life Sciences Institute and California Life Sciences
Association's joint South San Francisco Empowerment Initiative,
which aims to build science competency while closing the digital
gap. Through this contribution, we provided iPads, Chromebooks, and
MacBook Airs to help K–12 students and teachers in South San Francisco stay connected in a
digital learning environment.
|
(1)
|
Represents an
illustrative subset of nearly 100 tenants focused on
COVID-19-related efforts, with some of these companies working on
multiple efforts that span testing, treatment, and/or vaccine
development.
|
|
(1)
|
Source: Scott
Gottlieb, MD, Twitter, October 13, 2020, 6:19 a.m.
|
|
(2)
|
Announced award value
and clinical trial stage as of October 23, 2020.
|
|
(3)
|
Johnson & Johnson
has temporarily paused further dosing in all of its COVID-19
vaccine candidate clinical trials, including the Phase III ENSEMBLE
trial, due to an unexplained illness in a study participant.
AstraZeneca similarly paused its Phase III vaccine trial in early
September due to an unexplained case of transverse myelitis in a
study participant. As of October 23, 2020, the clinical holds
for both Johnson & Johnson and AstraZeneca have been lifted
after review by independent data safety monitoring boards and
approval from the FDA.
|
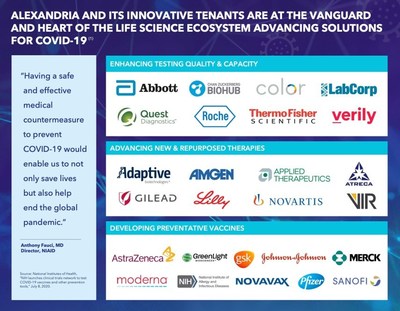
Alexandria Fighting COVID-19 on Multiple Fronts
September 30, 2020
Alexandria and its
innovative tenants are at the vanguard and heart of the life
science ecosystem advancing solutions for COVID-19
Safe and effective vaccines and therapies, in addition to
widespread testing, continue to be critically needed to combat the
global COVID-19 pandemic. By maintaining essential continuous
operations across our campuses, Alexandria has enabled several of our life
science tenants to pursue mission-critical COVID-19-related
research and development. The heroic work being done by so many of
our tenants and campus community members to help test for, treat,
and prevent COVID-19, as well as provide medical supplies and
protective equipment to neighboring hospitals, is profound and
inspiring. We are currently tracking nearly 100 tenants across our
cluster markets that are advancing solutions for COVID-19.
Developing preventative vaccines
A prophylactic vaccine should help bring about the effective end
of the global COVID-19 pandemic. As such, researchers around the
world are working tirelessly on over 135 COVID-19 vaccine programs,
with at least 48 vaccine candidates in human trials.
In an effort to expedite the development, manufacturing, and
distribution of COVID-19 vaccines, the U.S. government has called
for unprecedented public-private collaboration, allocating several
billions of dollars through various initiatives, including
Operation Warp Speed. Leveraging their vaccine development
expertise and innovative technology platforms, our tenants
AstraZeneca plc, Moderna, Inc., and Pfizer
Inc. have the most advanced vaccine programs in late-stage
clinical development, each of which has been further supported by
government funding. Each company expects to announce critical data
in the fourth quarter of 2020 which could form the basis for
emergency use authorization ("EUA") from the FDA by year-end 2020
or in early 2021.
Additional tenants including Emergent BioSolutions Inc.,
FUJIFILM Diosynth Biotechnologies, GlaxoSmithKline,
Johnson & Johnson, Merck & Co., Inc.,
Novavax, Inc., and Sanofi have also been awarded
government support for their efforts in the development,
manufacturing, and/or distribution of COVID-19 vaccines. Clinical
trial data and progress will continue to be reported by these
companies over the coming months, with the goal of expediting the
widespread delivery of a safe and effective COVID-19 vaccine to the
public within the next 12 months.
Advancing new and repurposed therapies
On October 22, 2020, the FDA
approved Gilead Sciences, Inc.'s antiviral drug
Veklury® (remdesivir) for the treatment of COVID-19
patients requiring hospitalization. In addition, over 250
experimental therapies to treat COVID-19 are being studied in over
600 clinical trials around the world in addition to more than 150
therapeutic candidates in preclinical development. A substantial
number of these programs are sponsored by our tenants and include
the following notable efforts:
- Eli Lilly and Company is developing multiple potential
antibody therapies for the treatment and potential prevention of
COVID-19. On October 7, 2020, the
company announced that it was seeking emergency use authorization
from the FDA for its most advanced antibody (bamlanivimab),
developed in partnership with AbCellera and the NIH, for the
treatment of high-risk patients with mild to moderate COVID-19. On
October 13, 2020, the NIH announced
that it would pause enrollment of its Phase III study testing
Lilly's antibody treatment in hospitalized patients out of "an
abundance of caution" to allow an independent safety review of the
trial data.
- Vir Biotechnology, Inc. ("Vir") and
GlaxoSmithKline ("GSK") have entered into a strategic
partnership to utilize Vir's neutralizing antibody platform to
identify novel drug candidates that may be used as therapeutic or
preventative COVID-19 treatments. On October
6, 2020, Vir and GSK announced that their most advanced
antibody therapy for the early treatment of patients with COVID-19
has entered Phase III; they expect initial study data by year-end
2020 and complete results in the first quarter of 2021.
Several other Alexandria
tenants, including AbbVie Inc., Amgen, AstraZeneca
plc, Atreca Inc., Enanta Pharmaceuticals, Inc.,
Novartis AG, and Pfizer Inc., are similarly
endeavoring to develop novel therapies and repurpose existing and
investigational drugs to provide near-term treatments for moderate
and severe COVID-19 patients and those at highest risk.
Improving testing quality and capacity
Abbott Laboratories, Adaptive Biotechnologies
Corporation, Color, Cue Health Inc.,
Laboratory Corporation of America Holdings, Quest
Diagnostics, Quidel Corporation, Roche, Thermo
Fisher Scientific Inc., Verily Life Sciences, and others
are working to improve testing quality, capacity, and turnaround
time to more effectively determine who has an active COVID-19
infection, who has been exposed to the virus, and who has developed
immunity against it. The increased availability of widespread
COVID-19 testing is critical for curtailing the pandemic and
facilitating a safer reopening of workplaces, communities, and
society overall.
|
Acquisitions
September 30, 2020
(Dollars in thousands)
|
|
|
|
|
|
|
|
|
|
|
Square
Footage
|
|
Unlevered
Yields
|
|
|
|
Property
|
|
Submarket/Market
|
|
Date of
Purchase
|
|
Number of
Properties
|
|
Operating
Occupancy
|
|
Future
Development
|
|
Active
Redevelopment
|
|
Operating With
Future
Development/
Redevelopment
|
|
Operating
|
|
Initial
Stabilized
|
|
Initial
Stabilized
(Cash)
|
|
Purchase
Price
|
|
|
|
|
|
|
|
|
|
|
|
|
|
|
|
|
|
|
|
|
|
|
|
|
|
|
|
Completed in
1H20
|
|
|
|
|
|
15
|
|
80%
|
|
1,739,825
|
|
63,774
|
|
439,244
|
|
1,492,599
|
|
|
|
|
|
$
|
699,829
|
|
|
|
|
|
|
|
|
|
|
|
|
|
|
|
|
|
|
|
|
|
|
|
|
|
|
|
Completed in
3Q20:
|
|
|
|
|
|
|
|
|
|
|
|
|
|
|
|
|
|
|
|
|
|
|
|
|
|
|
Alexandria
Center® for Life
Science – Durham
|
|
Research
Triangle/
Research
Triangle
|
|
8/21/20
|
|
16
|
|
84%
|
|
—
|
|
652,381
|
|
100,145
|
|
1,485,621
|
|
(1)
|
|
|
(1)
|
|
|
|
590,412
|
|
Reservoir
Woods
|
|
Route 128/
Greater
Boston
|
|
8/25/20
|
|
3
|
|
100
|
|
440,000
|
|
—
|
|
515,273
|
|
—
|
|
(2)
|
|
|
(2)
|
|
|
|
325,307
|
|
3181 Porter
Drive
|
|
Greater
Stanford/
San
Francisco
|
|
8/6/20
|
|
1
|
|
100
|
|
—
|
|
—
|
|
—
|
|
104,011
|
|
7.2%
|
|
|
5.0%
|
|
|
|
115,200
|
|
One Upland
Road
|
|
Route 128/
Greater
Boston
|
|
8/19/20
|
|
1
|
|
100
|
|
450,000
|
|
—
|
|
—
|
|
243,082
|
|
6.3%
|
(3)
|
|
5.6%
|
(3)
|
|
|
110,257
|
|
11255 and 11355
North
Torrey Pines Road
|
|
Torrey
Pines/
San Diego
|
|
7/22/20
|
|
2
|
|
100
|
|
240,000
|
(4)
|
—
|
|
139,135
|
|
—
|
|
(2)
|
|
|
(2)
|
|
|
|
97,500
|
|
Other
|
|
Various
|
|
Various
|
|
1
|
|
75
|
|
327,488
|
|
—
|
|
42,380
|
|
—
|
|
N/A
|
|
|
N/A
|
|
|
|
44,244
|
|
Completed in
3Q20
|
|
|
|
|
|
24
|
|
90%
|
|
1,457,488
|
|
652,381
|
|
796,933
|
|
1,832,714
|
|
|
|
|
|
|
|
|
1,282,920
|
|
|
|
|
|
|
|
|
|
|
|
|
|
|
|
|
|
|
|
|
|
|
|
|
|
|
|
Projected in
4Q20:
|
|
|
|
|
|
|
|
|
|
|
|
|
|
|
|
|
|
|
|
|
|
|
|
|
|
|
Completed
acquisitions
|
|
Various
|
|
October
2020
|
|
3
|
|
100%
|
|
—
|
|
169,420
|
|
76,951
|
|
—
|
|
(2)
|
|
|
(2)
|
|
|
|
108,748
|
|
Pending
acquisitions
|
|
Various
|
|
|
|
|
|
|
|
|
|
|
|
|
|
|
|
|
|
|
|
|
508,503
|
|
Projected in
4Q20
|
|
|
|
|
|
|
|
|
|
|
|
|
|
|
|
|
|
|
|
|
|
|
|
|
617,251
|
|
|
|
|
|
|
|
|
|
|
|
|
|
|
|
|
|
|
|
|
|
|
|
|
|
|
|
2020 guidance
range
|
|
|
|
|
|
|
|
|
|
|
|
|
|
|
|
|
|
|
|
|
|
$2,400,000
– $2,800,000
|
|
|
|
|
|
|
|
|
|
|
|
|
|
|
|
|
|
|
|
|
|
|
|
|
|
|
|
Mercer Mega
Block
|
|
Lake
Union/Seattle
|
|
TBD(5)
|
|
—
|
|
N/A
|
|
800,000
|
|
—
|
|
—
|
|
—
|
|
(5)
|
|
|
(5)
|
|
|
$
|
143,500
|
|
|
|
|
|
|
|
|
|
|
|
|
|
|
|
|
|
|
|
|
|
|
|
|
|
|
|
(1)
|
The campus includes
16 properties, of which three properties aggregating 652,381 RSF
are currently undergoing active redevelopment. We expect to achieve
unlevered initial stabilized yields of 6.2% and 5.8% (cash basis)
for the 13 operating properties. These operating properties
generate 99% of annual rental revenue from investment-grade
tenants. Refer to "New Class A development and redevelopment
properties: current projects" of our Supplemental Information for
additional details on the three properties undergoing active
redevelopment.
|
|
(2)
|
We expect to provide
total estimated costs and related yields for development and
redevelopment projects in the future, subsequent to the
commencement of construction.
|
|
(3)
|
Represents unlevered
initial stabilized yields for the operating property excluding
excess land.
|
|
(4)
|
Represents total
square footage upon completion of development or redevelopment of a
new Class A property. Square footage presented includes RSF of
buildings currently in operation. We intend to demolish the
existing properties upon expiration of the existing in-place leases
and commencement of future construction. Refer to "Definitions and
reconciliations" of our Supplemental Information for additional
details on value-creation square feet currently included in rental
properties.
|
|
(5)
|
We continue to
diligently work through various long-lead-time due diligence items,
with certain deadlines extending into early 2021. We are working
toward completion of all due diligence items as soon as
possible.
|
|
Dispositions
September 30, 2020
(Dollars in thousands)
|
|
Property
|
|
Submarket/Market
|
|
Date of
Sale
|
|
Interest
Sold
|
|
RSF
|
|
Sales
Price
|
|
Sales Price
per RSF
|
|
Gain
|
|
Completed:
|
|
|
|
|
|
|
|
|
|
|
|
|
|
|
|
945 Market
Street(1)
|
|
SoMa/San
Francisco
|
|
9/4/20
|
|
99.5%
|
|
255,765
|
|
$
|
198,000
|
|
$
|
774
|
|
$
|
—
|
|
9808 and 9868 Scranton
Road
|
|
Sorrento Mesa/San
Diego
|
|
4/13/20
|
|
50%
|
|
219,628
|
|
51,104
|
|
$
|
465
|
|
(2)
|
|
Other
|
|
Route 495/Greater
Boston
|
|
8/7/20
|
|
100%
|
|
60,759
|
|
3,350
|
|
$
|
55
|
|
1,603
|
|
|
|
|
|
|
|
|
536,152
|
|
252,454
|
|
|
|
$
|
1,603
|
|
|
|
|
|
|
|
|
|
|
|
|
|
|
|
|
|
|
Projected
4Q20:
|
|
|
|
|
|
|
|
|
|
|
|
|
|
|
|
|
|
Pending
|
|
San
Francisco
|
|
TBD
|
|
TBD
|
|
|
|
500,000
|
–
|
600,000
|
|
|
|
|
|
Pending
|
|
Seattle
|
|
TBD
|
|
TBD
|
|
|
|
200,000
|
–
|
300,000
|
|
|
|
|
|
Other
|
|
Various
|
|
TBD
|
|
TBD
|
|
|
|
47,546
|
–
|
147,546
|
|
|
|
|
|
2020 guidance
range
|
|
|
|
|
|
|
|
|
|
$
|
1,000,000
|
–
|
$
|
1,300,000
|
|
|
|
|
|
|
|
|
|
|
|
|
|
|
|
|
|
|
|
|
|
|
|
|
|
|
|
|
|
|
|
|
|
|
|
|
|
|
|
|
|
|
|
|
(1)
|
Upon approval for
sale by our Board of Directors in September 2020, the asset met the
criteria for classification as held for sale, and we recognized an
impairment charge of $6.8 million to lower the carrying amount
to the estimated fair value less costs to sell. In September 2020,
we completed the disposition and sold our ownership interest in
this recently acquired property, which is expected to be used as
retail space by the buyer.
|
|
(2)
|
We completed the sale
of a partial interest in properties at 9808 and 9868 Scranton Road
in our Sorrento Mesa submarket to the existing SD Tech by
Alexandria consolidated real estate joint venture, in which we have
a 50% ownership interest. We retained control over this real estate
joint venture, and therefore, we continue to consolidate these
properties. For consolidated joint ventures, we account for the
difference between the consideration received and the book value of
the interest sold as an equity transaction, with no gain or loss
recognized in earnings.
|
Guidance
September 30, 2020
(Dollars in millions, except per share amounts)
The following updated guidance is based on our current view of
existing market conditions and assumptions for the year ending
December 31, 2020. There can be no assurance that actual
amounts will not be materially higher or lower than these
expectations. Also, refer to our discussion of "forward-looking
statements" on page 12 of this Earnings Press Release for
additional details.
|
Projected 2020
Earnings per Share and Funds From Operations per Share Attributable
to Alexandria's Common Stockholders – Diluted
|
|
|
|
As of
10/26/20
|
|
As of
7/27/20
|
|
|
Earnings per
share(1)
|
|
$3.09 to
$3.11
|
|
$3.00 to
$3.08
|
|
|
Depreciation and
amortization of real estate assets
|
|
5.15
|
|
5.15
|
|
|
Gain on sale of real
estate
|
|
(0.01)
|
|
—
|
|
|
Impairment of real
estate – rental properties(2)
|
|
0.12
|
|
0.06
|
|
|
Allocation to unvested
restricted stock awards
|
|
(0.05)
|
|
(0.05)
|
|
|
Funds from operations
per share(3)
|
|
$8.30 to
$8.32
|
|
$8.16 to
$8.24
|
|
|
Unrealized gains on
non-real estate investments
|
|
(1.13)
|
|
(1.25)
|
|
|
Impairment of non-real
estate investments
|
|
0.20
|
|
0.20
|
|
|
Impairment of real
estate(4)
|
|
0.12
|
|
0.12
|
|
|
Loss on early
extinguishment of debt(5)
|
|
0.42
|
|
—
|
|
|
Termination
fee(6)
|
|
(0.69)
|
|
—
|
|
|
Acceleration of stock
compensation expense due to executive officer
resignation
|
|
0.04
|
|
—
|
|
|
Allocation to unvested
restricted stock awards/other
|
|
0.03
|
|
0.03
|
|
|
Funds from operations
per share, as adjusted(1)
|
|
$7.29 to
$7.31
|
|
$7.26 to
$7.34
|
|
|
Midpoint
|
|
$7.30
|
|
$7.30
|
|
|
|
|
As of
10/26/20
|
|
As of
7/27/20
|
|
|
Key
Assumptions
|
|
Low
|
|
High
|
|
Low
|
|
High
|
|
|
Occupancy percentage
in North America as of December 31, 2020
|
|
94.8%
|
|
95.4%
|
|
94.8%
|
|
95.4%
|
|
|
Lease renewals and
re-leasing of space:
|
|
|
|
|
|
|
|
|
|
|
Rental rate
increases
|
|
30.5%
|
|
33.5%
|
|
28.0%
|
|
31.0%
|
|
|
Rental rate increases
(cash basis)
|
|
16.0%
|
|
19.0%
|
|
14.0%
|
|
17.0%
|
|
|
Same property
performance:
|
|
|
|
|
|
|
|
|
|
|
Net operating income
increase
|
|
1.0%
|
|
3.0%
|
|
1.0%
|
|
3.0%
|
|
|
Net operating income
increase (cash basis)
|
|
4.5%
|
|
6.5%
|
|
4.5%
|
|
6.5%
|
|
|
Straight-line rent
revenue
|
|
$
|
98
|
|
$
|
108
|
|
$
|
98
|
|
$
|
108
|
|
|
General and
administrative expenses(7)
|
|
$
|
126
|
|
$
|
131
|
|
$
|
121
|
|
$
|
126
|
|
|
Capitalization of
interest
|
|
$
|
117
|
|
$
|
127
|
|
$
|
117
|
|
$
|
127
|
|
|
Interest
expense
|
|
$
|
170
|
|
$
|
180
|
|
$
|
170
|
|
$
|
180
|
|
|
|
|
|
|
|
|
|
|
|
|
|
|
|
|
(1)
|
Excludes unrealized
gains or losses after September 30, 2020, that are required to
be recognized in earnings and are excluded from funds from
operations per share, as adjusted.
|
|
(2)
|
Includes a $7.6
million impairment recognized during 1Q20 on our investment in a
recently developed retail property held by our unconsolidated real
estate joint venture. Additionally, during 3Q20 we recognized an
impairment charge of $7.7 million primarily to reduce the carrying
amount of our property at 945 Market Street to its estimated fair
value. We completed the disposition of this asset in September
2020.
|
|
(3)
|
Refer to "Funds from
operations and funds from operations, as adjusted, attributable to
Alexandria's common stockholders" in "Definitions and
reconciliations" of our Supplemental Information for additional
details.
|
|
(4)
|
Includes an
impairment charge of $10 million recognized in April 2020 to write
off the carrying amount of the pre-acquisition deposit related to
an operating tech office property for which our revised economic
projections declined from our initial underwriting. The impairment
was recognized concurrently with the submission of our notice to
terminate the transaction.
|
|
(5)
|
Includes losses on
early extinguishment of debt aggregating $53.4 million comprising
(i) $50.8 million related to the refinancing of our 3.90% unsecured
senior notes payable due in 2023 in 3Q20, (ii) $1.9 million related
to the termination of our $750 million unsecured senior line of
credit in 3Q20, and (iii) $651 thousand related to the amendment of
our unsecured senior line of credit in October 2020.
|
|
(6)
|
Refer to page 1 of
this Earnings Press Release for additional details.
|
|
(7)
|
Increase in the
guidance range for general and administrative expenses attributable
to the acceleration of stock compensation expense due to the
resignation of an executive officer in 3Q20.
|
|
Guidance
September 30, 2020
(Dollars in millions, except per share amounts)
|
|
|
|
|
Key Credit
Metrics
|
|
2020
Guidance
|
|
Net debt and
preferred stock to Adjusted EBITDA – 4Q20 annualized
|
|
Less than or equal to
5.3x
|
|
Fixed-charge coverage
ratio – 4Q20 annualized
|
|
Greater than or equal
to 4.4x
|
|
|
|
|
|
|
|
|
|
|
|
|
|
|
As of
10/26/20
|
|
|
|
|
Key Sources and
Uses of Capital
|
|
Range
|
|
Midpoint
|
|
Certain
Completed
Items
|
|
As of 7/27/20
Midpoint
|
|
|
Sources of
capital:
|
|
|
|
|
|
|
|
|
|
|
|
|
|
|
Net cash provided by
operating activities after dividends(1)
|
|
$
|
185
|
|
$
|
225
|
|
$
|
205
|
|
|
|
|
$
|
205
|
|
|
Incremental
debt
|
|
635
|
|
575
|
|
|
605
|
|
see below
|
|
|
495
|
|
|
Real estate
dispositions and partial interest sales
|
|
1,000
|
|
1,300
|
|
|
1,150
|
|
(2)
|
|
|
1,250
|
|
|
Common
equity
|
|
2,080
|
|
2,600
|
|
|
2,340
|
|
$
|
2,078
|
(3)
|
|
2,090
|
|
|
Total sources of
capital
|
|
$
|
3,900
|
|
$
|
4,700
|
|
$
|
4,300
|
|
|
|
|
$
|
4,040
|
|
|
Uses of
capital:
|
|
|
|
|
|
|
|
|
|
|
|
|
|
|
Construction (see page
45 for additional information)
|
|
$
|
1,200
|
|
$
|
1,500
|
|
$
|
1,350
|
|
|
|
|
$
|
1,350
|
|
|
Acquisitions (see page
8 for additional information)
|
|
2,400
|
|
2,800
|
|
|
2,600
|
|
$
|
2,091
|
|
|
1,800
|
|
|
Proceeds from complete
unsecured senior notes offering held in cash
|
|
300
|
|
400
|
|
|
350
|
|
$300 –
$400
|
|
|
—
|
|
|
Total uses of
capital
|
|
$
|
3,900
|
|
$
|
4,700
|
|
$
|
4,300
|
|
|
|
|
$
|
3,150
|
|
|
Incremental debt
(included above):
|
|
|
|
|
|
|
|
|
|
|
|
|
|
|
Issuance of unsecured
senior notes payable
|
|
$
|
1,700
|
|
$
|
1,700
|
|
$
|
1,700
|
|
$
|
1,700
|
|
|
$
|
700
|
|
|
Principal repayments of
unsecured senior notes payable
|
|
(500)
|
|
(500)
|
|
|
(500)
|
|
$
|
(500)
|
|
|
—
|
|
|
Unsecured senior line
of credit, commercial paper, and other
|
|
(565)
|
|
(625)
|
|
|
(595)
|
|
|
|
|
(205)
|
|
|
Incremental
debt
|
|
$
|
635
|
|
$
|
575
|
|
$
|
605
|
|
|
|
|
$
|
495
|
|
|
|
|
|
|
|
|
|
|
|
|
|
|
|
|
|
Excess sources of
capital
|
|
|
|
|
|
|
$
|
—
|
|
|
|
|
|
$
|
890
|
|
|
|
|
(1)
|
Excludes significant
termination fee proceeds.
|
|
(2)
|
Refer to
"Dispositions" in this Earnings Press Release for additional
information.
|
|
(3)
|
Refer to page 3 of
this Earnings Press Release for additional detail on our forward
equity sales agreements activity.
|
Earnings Call Information and About the Company
September 30, 2020
We will host a conference call on Tuesday, October 27,
2020, at 3:00 p.m. Eastern Time
("ET")/noon Pacific Time ("PT"),
which is open to the general public, to discuss our financial and
operating results for the third quarter ended September 30,
2020. To participate in this conference call, dial (833) 366-1125
or (412) 902-6738 shortly before 3:00 p.m.
ET/noon PT and ask the
operator to join the call for Alexandria Real Estate Equities, Inc.
The audio webcast can be accessed at www.are.com in the "For
Investors" section. A replay of the call will be available for a
limited time from 5:00 p.m.
ET/2:00 p.m. PT on Tuesday,
October 27, 2020. The replay number is (877) 344-7529 or (412)
317-0088, and the access code is 10147053.
Additionally, a copy of this Earnings Press Release and
Supplemental Information for the third quarter ended
September 30, 2020, is available in the "For Investors"
section of our website at www.are.com or by following this link:
http://www.are.com/fs/2020q3.pdf.
For any questions, please contact Joel
S. Marcus, executive chairman and founder; Stephen A. Richardson, co-chief executive
officer; Peter M. Moglia, co-chief
executive officer and co-chief investment officer; Dean A. Shigenaga, co-president and chief
financial officer; or Sara M.
Kabakoff, vice president – corporate communications, at
(626) 578-0777; or Paula Schwartz,
managing director of Rx Communications Group, at (917)
322-2216.
About the Company
Alexandria Real Estate Equities, Inc. (NYSE:ARE), an S&P
500® urban office real estate investment trust ("REIT"),
is the first, longest-tenured, and pioneering owner, operator, and
developer uniquely focused on collaborative life science,
technology, and agtech campuses in AAA innovation cluster
locations, with a total market capitalization of $29.2 billion as of September 30, 2020, and
an asset base in North America of
47.4 million square feet ("SF"). The asset base in North America includes 31.2 million RSF of
operating properties and 2.8 million RSF of Class A properties
undergoing construction, 7.2 million RSF of near-term and
intermediate-term development and redevelopment projects, and 6.2
million SF of future development projects. Founded in 1994,
Alexandria pioneered this niche
and has since established a significant market presence in key
locations, including Greater
Boston, San Francisco,
New York City, San Diego, Seattle, Maryland, and Research Triangle. Alexandria has a longstanding and proven track
record of developing Class A properties clustered in urban life
science, technology, and agtech campuses that provide our
innovative tenants with highly dynamic and collaborative
environments that enhance their ability to successfully recruit and
retain world-class talent and inspire productivity, efficiency,
creativity, and success. Alexandria also provides strategic capital to
transformative life science, technology, and agtech companies
through our venture capital platform. We believe our unique
business model and diligent underwriting ensure a high-quality and
diverse tenant base that results in higher occupancy levels, longer
lease terms, higher rental income, higher returns, and greater
long-term asset value. For additional information on Alexandria, please visit www.are.com.
***********
This document includes "forward-looking statements" within the
meaning of Section 27A of the Securities Act of 1933, as amended,
and Section 21E of the Securities Exchange Act of 1934, as amended.
Such forward-looking statements include, without limitation,
statements regarding our 2020 earnings per share attributable to
Alexandria's common stockholders –
diluted, 2020 funds from operations per share attributable to
Alexandria's common stockholders –
diluted, net operating income, and our projected sources and uses
of capital. You can identify the forward-looking statements by
their use of forward-looking words, such as "forecast," "guidance,"
"goals," "projects," "estimates," "anticipates," "believes,"
"expects," "intends," "may," "plans," "seeks," "should," or "will,"
or the negative of those words or similar words. These
forward-looking statements are based on our current expectations,
beliefs, projections, future plans and strategies, anticipated
events or trends, and similar expressions concerning matters that
are not historical facts, as well as a number of assumptions
concerning future events. There can be no assurance that actual
results will not be materially higher or lower than these
expectations. These statements are subject to risks, uncertainties,
assumptions, and other important factors that could cause actual
results to differ materially from the results discussed in the
forward-looking statements. Factors that might cause such a
difference include, without limitation, our failure to obtain
capital (debt, construction financing, and/or equity) or refinance
debt maturities, increased interest rates and operating costs,
adverse economic or real estate developments in our markets
(including the impact of the ongoing COVID-19 pandemic), our
failure to successfully place into service and lease any properties
undergoing development or redevelopment and our existing space held
for future development or redevelopment (including new properties
acquired for that purpose), our failure to successfully operate or
lease acquired properties, decreased rental rates, increased
vacancy rates or failure to renew or replace expiring leases,
defaults on or non-renewal of leases by tenants, adverse general
and local economic conditions, an unfavorable capital market
environment, decreased leasing activity or lease renewals, and
other risks and uncertainties detailed in our filings with the
Securities and Exchange Commission ("SEC"). Accordingly, you are
cautioned not to place undue reliance on such forward-looking
statements. All forward-looking statements are made as of the date
of this Earnings Press Release, and unless otherwise stated, we
assume no obligation to update this information and expressly
disclaim any obligation to update or revise any forward-looking
statements, whether as a result of new information, future events,
or otherwise. For more discussion relating to risks and
uncertainties that could cause actual results to differ materially
from those anticipated in our forward-looking statements, and risks
to our business in general, please refer to our SEC filings,
including our most recent annual report on Form 10-K and any
subsequent quarterly reports on Form 10-Q.
For additional discussion of the risks and other potential
impacts posed by the outbreak of the COVID-19 pandemic and
uncertainties we, our tenants, and the global and national
economies face as a result, see the sections entitled "Risk
Factors" and "Management's Discussion and Analysis of Financial
Condition and Results of Operations" in our quarterly report on
Form 10-Q filed with the SEC on October 26, 2020.
Alexandria®,
Lighthouse Design® logo, Building the Future of
Life-Changing Innovation™, Labspace®, Alexandria
Center®, Alexandria Technology Square®,
Alexandria Technology Center®, Alexandria Innovation
Center®, Alexandria
Summit®, LaunchLabs®, GradLabs™, and
That's What's in Our DNA™ are copyrights and trademarks of
Alexandria Real Estate Equities, Inc. All other company names,
trademarks, and logos referenced herein are the property of their
respective owners.
|
Consolidated
Statements of Operations
September 30, 2020
(Dollars in thousands, except per share amounts)
|
|
|
|
Three Months
Ended
|
|
Nine Months
Ended
|
|
|
9/30/20
|
|
6/30/20
|
|
3/31/20
|
|
12/31/19
|
|
9/30/19
|
|
9/30/20
|
|
9/30/19
|
|
Revenues:
|
|
|
|
|
|
|
|
|
|
|
|
|
|
|
|
Income from
rentals
|
|
$
|
543,412
|
(1)
|
|
$
|
435,856
|
|
|
$
|
437,605
|
|
|
$
|
404,721
|
|
|
$
|
385,776
|
|
|
$
|
1,416,873
|
|
|
$
|
1,112,143
|
|
|
Other income
|
|
1,630
|
|
|
1,100
|
|
|
2,314
|
|
|
3,393
|
|
|
4,708
|
|
|
5,044
|
|
|
11,039
|
|
|
Total
revenues
|
|
545,042
|
|
|
436,956
|
|
|
439,919
|
|
|
408,114
|
|
|
390,484
|
|
|
1,421,917
|
|
|
1,123,182
|
|
|
|
|
|
|
|
|
|
|
|
|
|
|
|
|
|
Expenses:
|
|
|
|
|
|
|
|
|
|
|
|
|
|
|
|
Rental
operations
|
|
140,443
|
|
|
123,911
|
|
|
129,103
|
|
|
121,852
|
|
|
116,450
|
|
|
393,457
|
|
|
323,640
|
|
|
General and
administrative
|
|
36,913
|
(1)
|
|
31,775
|
|
|
31,963
|
|
|
29,782
|
|
|
27,930
|
|
|
100,651
|
|
|
79,041
|
|
|
Interest
|
|
43,318
|
|
|
45,014
|
|
|
45,739
|
|
|
45,493
|
|
|
46,203
|
|
|
134,071
|
|
|
128,182
|
|
|
Depreciation and
amortization
|
|
176,831
|
|
|
168,027
|
|
|
175,496
|
|
|
140,518
|
|
|
135,570
|
|
|
520,354
|
|
|
404,094
|
|
|
Impairment of real
estate
|
|
7,680
|
|
|
13,218
|
|
|
2,003
|
|
|
12,334
|
|
|
—
|
|
|
22,901
|
|
|
—
|
|
|
Loss on early
extinguishment of debt
|
|
52,770
|
|
|
—
|
|
|
—
|
|
|
—
|
|
|
40,209
|
|
|
52,770
|
|
|
47,570
|
|
|
Total
expenses
|
|
457,955
|
|
|
381,945
|
|
|
384,304
|
|
|
349,979
|
|
|
366,362
|
|
|
1,224,204
|
|
|
982,527
|
|
|
|
|
|
|
|
|
|
|
|
|
|
|
|
|
|
Equity in earnings
(losses) of unconsolidated real estate joint ventures
|
|
3,778
|
|
|
3,893
|
|
|
(3,116)
|
|
|
4,777
|
|
|
2,951
|
|
|
4,555
|
|
|
5,359
|
|
|
Investment income
(loss)
|
|
3,348
|
|
|
184,657
|
|
|
(21,821)
|
|
|
152,667
|
|
|
(63,076)
|
|
|
166,184
|
|
|
41,980
|
|
|
Gain on sales of real
estate
|
|
1,586
|
|
|
—
|
|
|
—
|
|
|
474
|
|
|
—
|
|
|
1,586
|
|
|
—
|
|
|
Net income
(loss)
|
|
95,799
|
|
|
243,561
|
|
|
30,678
|
|
|
216,053
|
|
|
(36,003)
|
|
|
370,038
|
|
|
187,994
|
|
|
Net income
attributable to noncontrolling interests
|
|
(14,743)
|
|
|
(13,907)
|
|
|
(11,913)
|
|
|
(13,612)
|
|
|
(11,199)
|
|
|
(40,563)
|
|
|
(27,270)
|
|
|
Net income (loss)
attributable to Alexandria Real Estate Equities, Inc.'s
stockholders
|
|
81,056
|
|
|
229,654
|
|
|
18,765
|
|
|
202,441
|
|
|
(47,202)
|
|
|
329,475
|
|
|
160,724
|
|
|
Dividends on
preferred stock
|
|
—
|
|
|
—
|
|
|
—
|
|
|
—
|
|
|
(1,173)
|
|
|
—
|
|
|
(3,204)
|
|
|
Preferred stock
redemption charge
|
|
—
|
|
|
—
|
|
|
—
|
|
|
—
|
|
|
—
|
|
|
—
|
|
|
(2,580)
|
|
|
Net income
attributable to unvested restricted stock awards
|
|
(1,730)
|
|
|
(3,054)
|
|
|
(1,925)
|
|
|
(2,823)
|
|
|
(1,398)
|
|
|
(5,304)
|
|
|
(4,532)
|
|
|
Net income (loss)
attributable to Alexandria Real Estate Equities, Inc.'s
common stockholders
|
|
$
|
79,326
|
|
|
$
|
226,600
|
|
|
$
|
16,840
|
|
|
$
|
199,618
|
|
|
$
|
(49,773)
|
|
|
$
|
324,171
|
|
|
$
|
150,408
|
|
|
|
|
|
|
|
|
|
|
|
|
|
|
|
|
|
Net income (loss) per
share attributable to Alexandria Real Estate Equities,
Inc.'s common stockholders:
|
|
|
|
|
|
|
|
|
|
|
|
|
|
|
|
Basic
|
|
$
|
0.64
|
|
|
$
|
1.82
|
|
|
$
|
0.14
|
|
|
$
|
1.75
|
|
|
$
|
(0.44)
|
|
|
$
|
2.62
|
|
|
$
|
1.35
|
|
|
Diluted
|
|
$
|
0.63
|
|
|
$
|
1.82
|
|
|
$
|
0.14
|
|
|
$
|
1.74
|
|
|
$
|
(0.44)
|
|
|
$
|
2.61
|
|
|
$
|
1.35
|
|
|
|
|
|
|
|
|
|
|
|
|
|
|
|
|
|
Weighted-average
shares of common stock outstanding:
|
|
|
|
|
|
|
|
|
|
|
|
|
|
|
|
Basic
|
|
124,901
|
|
|
124,333
|
|
|
121,433
|
|
|
114,175
|
|
|
112,120
|
|
|
123,561
|
|
|
111,540
|
|
|
Diluted
|
|
125,828
|
|
|
124,448
|
|
|
121,785
|
|
|
114,974
|
|
|
112,120
|
|
|
124,027
|
|
|
111,712
|
|
|
|
|
|
|
|
|
|
|
|
|
|
|
|
|
|
Dividends declared
per share of common stock
|
|
$
|
1.06
|
|
|
$
|
1.06
|
|
|
$
|
1.03
|
|
|
$
|
1.03
|
|
|
$
|
1.00
|
|
|
$
|
3.15
|
|
|
$
|
2.97
|
|
|
|
|
(1)
|
Refer to "Key items
included in operating results" on page 2 of this Earnings Press
Release for additional details.
|
|
Consolidated
Balance Sheets
September 30, 2020
(In thousands)
|
|
|
|
9/30/20
|
|
6/30/20
|
|
3/31/20
|
|
12/31/19
|
|
9/30/19
|
|
Assets
|
|
|
|
|
|
|
|
|
|
|
|
Investments in real
estate
|
|
$
|
17,600,648
|
|
|
$
|
16,281,125
|
|
|
$
|
15,832,182
|
|
|
$
|
14,844,038
|
|
|
$
|
13,618,280
|
|
|
Investments in
unconsolidated real estate joint ventures
|
|
330,792
|
|
|
326,858
|
|
|
325,665
|
|
|
346,890
|
|
|
340,190
|
|
|
Cash and cash
equivalents
|
|
446,255
|
|
|
206,860
|
|
|
445,255
|
|
|
189,681
|
|
|
410,675
|
|
|
Restricted
cash
|
|
38,788
|
|
|
34,680
|
|
|
43,116
|
|
|
53,008
|
|
|
42,295
|
|
|
Tenant
receivables
|
|
7,641
|
|
|
7,208
|
|
|
14,976
|
|
|
10,691
|
|
|
10,668
|
|
|
Deferred
rent
|
|
719,552
|
|
|
688,749
|
|
|
663,926
|
|
|
641,844
|
|
|
615,817
|
|
|
Deferred leasing
costs
|
|
266,440
|
|
|
274,483
|
|
|
269,458
|
|
|
270,043
|
|
|
252,772
|
|
|
Investments
|
|
1,330,945
|
|
|
1,318,465
|
|
|
1,123,482
|
|
|
1,140,594
|
|
|
990,454
|
|
|
Other
assets
|
|
1,169,610
|
|
|
930,680
|
|
|
983,875
|
|
|
893,714
|
|
|
777,003
|
|
|
Total
assets
|
|
$
|
21,910,671
|
|
|
$
|
20,069,108
|
|
|
$
|
19,701,935
|
|
|
$
|
18,390,503
|
|
|
$
|
17,058,154
|
|
|
|
|
|
|
|
|
|
|
|
|
|
Liabilities,
Noncontrolling Interests, and Equity
|
|
|
|
|
|
|
|
|
|
|
|
Secured notes
payable
|
|
$
|
342,363
|
|
|
$
|
344,784
|
|
|
$
|
347,136
|
|
|
$
|
349,352
|
|
|
$
|
351,852
|
|
|
Unsecured senior
notes payable
|
|
7,230,819
|
|
|
6,738,486
|
|
|
6,736,999
|
|
|
6,044,127
|
|
|
6,042,831
|
|
|
Unsecured senior line
of credit and commercial paper
|
|
249,989
|
|
|
440,000
|
|
|
221,000
|
|
|
384,000
|
|
|
343,000
|
|
|
Accounts payable,
accrued expenses, and other liabilities
|
|
1,609,340
|
|
|
1,343,181
|
|
|
1,352,554
|
|
|
1,320,268
|
|
|
1,241,276
|
|
|
Dividends
payable
|
|
143,040
|
|
|
133,681
|
|
|
129,981
|
|
|
126,278
|
|
|
115,575
|
|
|
Total
liabilities
|
|
9,575,551
|
|
|
9,000,132
|
|
|
8,787,670
|
|
|
8,224,025
|
|
|
8,094,534
|
|
|
|
|
|
|
|
|
|
|
|
|
|
Commitments and
contingencies
|
|
|
|
|
|
|
|
|
|
|
|
|
|
|
|
|
|
|
|
|
|
|
Redeemable
noncontrolling interests
|
|
11,232
|
|
|
12,122
|
|
|
12,013
|
|
|
12,300
|
|
|
12,099
|
|
|
|
|
|
|
|
|
|
|
|
|
|
Alexandria Real
Estate Equities, Inc.'s stockholders' equity:
|
|
|
|
|
|
|
|
|
|
|
|
7.00% Series D
cumulative convertible preferred stock
|
|
—
|
|
|
—
|
|
|
—
|
|
|
—
|
|
|
57,461
|
|
|
Common
stock
|
|
1,333
|
|
|
1,246
|
|
|
1,243
|
|
|
1,208
|
|
|
1,132
|
|
|
Additional paid-in
capital
|
|
10,711,119
|
|
|
9,443,274
|
|
|
9,336,949
|
|
|
8,874,367
|
|
|
7,743,188
|
|
|
Accumulated other
comprehensive loss
|
|
(10,638)
|
|
|
(13,080)
|
|
|
(15,606)
|
|
|
(9,749)
|
|
|
(11,549)
|
|
|
Alexandria Real
Estate Equities, Inc.'s stockholders' equity
|
|
10,701,814
|
|
|
9,431,440
|
|
|
9,322,586
|
|
|
8,865,826
|
|
|
7,790,232
|
|
|
Noncontrolling
interests
|
|
1,622,074
|
|
|
1,625,414
|
|
|
1,579,666
|
|
|
1,288,352
|
|
|
1,161,289
|
|
|
Total
equity
|
|
12,323,888
|
|
|
11,056,854
|
|
|
10,902,252
|
|
|
10,154,178
|
|
|
8,951,521
|
|
|
Total liabilities,
noncontrolling interests, and equity
|
|
$
|
21,910,671
|
|
|
$
|
20,069,108
|
|
|
$
|
19,701,935
|
|
|
$
|
18,390,503
|
|
|
$
|
17,058,154
|
|
|
Funds From
Operations and Funds From Operations per Share
September
30, 2020
(In thousands)
|
|
|
The following table
presents a reconciliation of net income (loss) attributable to
Alexandria's common stockholders, the most directly comparable
financial measure presented in accordance with generally accepted
accounting principles ("GAAP"), including our share of amounts from
consolidated and unconsolidated real estate joint ventures, to
funds from operations attributable to Alexandria's common
stockholders – diluted, and funds from operations attributable to
Alexandria's common stockholders – diluted, as adjusted, for the
periods below:
|
|
|
|
Three Months
Ended
|
|
Nine Months
Ended
|
|
|
9/30/20
|
|
6/30/20
|
|
3/31/20
|
|
12/31/19
|
|
9/30/19
|
|
9/30/20
|
|
9/30/19
|
|
Net income (loss)
attributable to Alexandria's common stockholders
|
|
$
|
79,326
|
|
|
$
|
226,600
|
|
|
$
|
16,840
|
|
|
$
|
199,618
|
|
|
$
|
(49,773)
|
|
|
$
|
324,171
|
|
|
$
|
150,408
|
|
|
Depreciation and
amortization of real estate assets
|
|
173,622
|
|
|
165,040
|
|
|
172,628
|
|
|
137,761
|
|
|
135,570
|
|
|
511,290
|
|
|
404,094
|
|
|
Noncontrolling share
of depreciation and amortization from consolidated real estate
JVs
|
|
(15,256)
|
|
|
(15,775)
|
|
|
(15,870)
|
|
|
(10,176)
|
|
|
(8,621)
|
|
|
(46,901)
|
|
|
(20,784)
|
|
|
Our share of
depreciation and amortization from unconsolidated real estate
JVs
|
|
2,936
|
|
|
2,858
|
|
|
2,643
|
|
|
2,702
|
|
|
1,845
|
|
|
8,437
|
|
|
3,664
|
|
|
Gain on sales of real
estate
|
|
(1,586)
|
|
|
—
|
|
|
—
|
|
|
(474)
|
|
|
—
|
|
|
(1,586)
|
|
|
—
|
|
|
Impairment of real
estate – rental properties
|
|
7,680
|
|
|
—
|
|
|
7,644
|
|
|
12,334
|
|
|
—
|
|
|
15,324
|
|
|
—
|
|
|
Allocation to unvested
restricted stock awards
|
|
(1,261)
|
|
|
(2,228)
|
|
|
(847)
|
|
|
(1,809)
|
|
|
—
|
|
|
(5,692)
|
|
|
(2,929)
|
|
|
Funds from
operations attributable to Alexandria's common stockholders –
diluted(1)
|
|
245,461
|
|
|
376,495
|
|
|
183,038
|
|
|
339,956
|
|
|
79,021
|
|
|
805,043
|
|
|
534,453
|
|
|
Unrealized losses
(gains) on non-real estate investments
|
|
14,013
|
|
|
(171,652)
|
|
|
17,144
|
|
|
(148,268)
|
|
|
70,043
|
|
|
(140,495)
|
|
|
(13,221)
|
|
|
Impairment of non-real
estate investments
|
|
—
|
|
|
4,702
|
|
|
19,780
|
|
|
9,991
|
|
|
7,133
|
|
|
24,482
|
|
|
7,133
|
|
|
Impairment of real
estate
|
|
—
|
|
|
13,218
|
|
|
2,003
|
|
|
—
|
|
|
—
|
|
|
15,221
|
|
|
—
|
|
|
Loss on early
extinguishment of debt
|
|
52,770
|
|
|
—
|
|
|
—
|
|
|
—
|
|
|
40,209
|
|
|
52,770
|
|
|
47,570
|
|
|
Loss on early
termination of interest rate hedge agreements
|
|
—
|
|
|
—
|
|
|
—
|
|
|
—
|
|
|
1,702
|
|
|
—
|
|
|
1,702
|
|
|
Termination
fee
|
|
(86,179)
|
|
|
—
|
|
|
—
|
|
|
—
|
|
|
—
|
|
|
(86,179)
|
|
|
—
|
|
|
Acceleration of stock
compensation expense due to executive officer
resignation
|
|
4,499
|
|
|
—
|
|
|
—
|
|
|
—
|
|
|
—
|
|
|
4,499
|
|
|
—
|
|
|
Preferred stock
redemption charge
|
|
—
|
|
|
—
|
|
|
—
|
|
|
—
|
|
|
—
|
|
|
—
|
|
|
2,580
|
|
|
Allocation to unvested
restricted stock awards
|
|
179
|
|
|
2,251
|
|
|
(591)
|
|
|
1,760
|
|
|
(1,002)
|
|
|
1,804
|
|
|
(657)
|
|
|
Funds from
operations attributable to Alexandria's common stockholders –
diluted, as adjusted
|
|
$
|
230,743
|
|
|
$
|
225,014
|
|
|
$
|
221,374
|
|
|
$
|
203,439
|
|
|
$
|
197,106
|
|
|
$
|
677,145
|
|
|
$
|
579,560
|
|
|
|
|
(1)
|
Calculated in
accordance with standards established by the Nareit Board of
Governors. Refer to "Funds from operations and funds from
operations, as adjusted, attributable to Alexandria's common
stockholders" in the "Definitions and reconciliations" of our
Supplemental Information for additional details.
|
|
Funds From
Operations and Funds From Operations per Share (continued)
September 30, 2020
(In thousands, except per share amounts)
|
|
|
The following table
presents a reconciliation of net income (loss) per share
attributable to Alexandria's common stockholders, the most directly
comparable financial measure presented in accordance with GAAP,
including our share of amounts from consolidated and unconsolidated
real estate joint ventures, to funds from operations per share
attributable to Alexandria's common stockholders – diluted, and
funds from operations per share attributable to Alexandria's common
stockholders – diluted, as adjusted, for the periods below. Per
share amounts may not add due to rounding.
|
|
|
|
Three Months
Ended
|
|
Nine Months
Ended
|
|
|
9/30/20
|
|
6/30/20
|
|
3/31/20
|
|
12/31/19
|
|
9/30/19
|
|
9/30/20
|
|
9/30/19
|
|
Net income (loss)
per share attributable to Alexandria's common stockholders
– diluted
|
|
$
|
0.63
|
|
|
$
|
1.82
|
|
|
$
|
0.14
|
|
|
$
|
1.74
|
|
|
$
|
(0.44)
|
|
|
$
|
2.61
|
|
|
$
|
1.35
|
|
|
Depreciation and
amortization of real estate assets
|
|
1.28
|
|
|
1.22
|
|
|
1.31
|
|
|
1.13
|
|
|
1.14
|
|
|
3.81
|
|
|
3.46
|
|
|
Gain on sales of real
estate
|
|
(0.01)
|
|
|
—
|
|
|
—
|
|
|
—
|
|
|
—
|
|
|
(0.01)
|
|
|
—
|
|
|
Impairment of real
estate – rental properties
|
|
0.06
|
|
|
—
|
|
|
0.06
|
|
|
0.11
|
|
|
—
|
|
|
0.12
|
|
|
—
|
|
|
Allocation to unvested
restricted stock awards
|
|
(0.01)
|
|
|
(0.01)
|
|
|
(0.01)
|
|
|
(0.02)
|
|
|
—
|
|
|
(0.04)
|
|
|
(0.03)
|
|
|
Funds from
operations per share attributable to Alexandria's common
stockholders – diluted
|
|
1.95
|
|
|
3.03
|
|
|
1.50
|
|
|
2.96
|
|
|
0.70
|
|
|
6.49
|
|
|
4.78
|
|
|
Unrealized losses
(gains) on non-real estate investments
|
|
0.11
|
|
|
(1.38)
|
|
|
0.14
|
|
|
(1.29)
|
|
|
0.62
|
|
|
(1.13)
|
|
|
(0.12)
|
|
|
Impairment of non-real
estate investments
|
|
—
|
|
|
0.04
|
|
|
0.16
|
|
|
0.09
|
|
|
0.06
|
|
|
0.20
|
|
|
0.06
|
|
|
Impairment of real
estate
|
|
—
|
|
|
0.11
|
|
|
0.02
|
|
|
—
|
|
|
—
|
|
|
0.12
|
|
|
—
|
|
|
Loss on early
extinguishment of debt
|
|
0.42
|
|
|
—
|
|
|
—
|
|
|
—
|
|
|
0.36
|
|
|
0.42
|
|
|
0.43
|
|
|
Loss on early
termination of interest rate hedge agreements
|
|
—
|
|
|
—
|
|
|
—
|
|
|
—
|
|
|
0.02
|
|
|
—
|
|
|
0.02
|
|
|
Termination
fee
|
|
(0.69)
|
|
|
—
|
|
|
—
|
|
|
—
|
|
|
—
|
|
|
(0.69)
|
|
|
—
|
|
|
Acceleration of stock
compensation expense due to executive officer
resignation
|
|
0.04
|
|
|
—
|
|
|
—
|
|
|
—
|
|
|
—
|
|
|
0.04
|
|
|
—
|
|
|
Preferred stock
redemption charge
|
|
—
|
|
|
—
|
|
|
—
|
|
|
—
|
|
|
—
|
|
|
—
|
|
|
0.02
|
|
|
Allocation to unvested
restricted stock awards
|
|
—
|
|
|
0.01
|
|
|
—
|
|
|
0.01
|
|
|
(0.01)
|
|
|
0.01
|
|
|
—
|
|
|
Funds from
operations per share attributable to Alexandria's common
stockholders – diluted, as
adjusted
|
|
$
|
1.83
|
|
|
$
|
1.81
|
|
|
$
|
1.82
|
|
|
$
|
1.77
|
|
|
$
|
1.75
|
|
|
$
|
5.46
|
|
|
$
|
5.19
|
|
|
|
|
|
|
|
|
|
|
|
|
|
|
|
|
|
Weighted-average
shares of common stock outstanding(1) for
calculations of:
|
|
|
|
|
|
|
|
|
|
|
|
|
|
|
|
Earnings per share –
diluted
|
|
125,828
|
|
|
124,448
|
|
|
121,785
|
|
|
114,974
|
|
|
112,120
|
|
|
124,027
|
|
|
111,712
|
|
|
Funds from operations
– diluted, per share
|
|
125,828
|
|
|
124,448
|
|
|
121,785
|
|
|
114,974
|
|
|
112,562
|
|
|
124,027
|
|
|
111,712
|
|
|
Funds from operations
– diluted, as adjusted, per share
|
|
125,828
|
|
|
124,448
|
|
|
121,785
|
|
|
114,974
|
|
|
112,562
|
|
|
124,027
|
|
|
111,712
|
|
|
|
|
|
|
|
|
|
|
|
|
|
|
|
|
|
|
|
(1)
|
Refer to
"Weighted-average shares of common stock outstanding – diluted" in
the "Definitions and reconciliations" of our Supplemental
Information for additional details.
|
 View original content to download
multimedia:http://www.prnewswire.com/news-releases/alexandria-real-estate-equities-inc-reports-3q20-net-income-per-share--diluted-of-0-63-3q20-ffo-per-share--diluted-as-adjusted-of-1-83-and-operational-excellence-and-strong-and-flexible-balance-sheet-with-significant-li-301159850.html
View original content to download
multimedia:http://www.prnewswire.com/news-releases/alexandria-real-estate-equities-inc-reports-3q20-net-income-per-share--diluted-of-0-63-3q20-ffo-per-share--diluted-as-adjusted-of-1-83-and-operational-excellence-and-strong-and-flexible-balance-sheet-with-significant-li-301159850.html
SOURCE Alexandria Real Estate Equities, Inc.