Income Opportunity Realty Investors, Inc. (NYSE American:IOR), a
Dallas-based real estate investment company, today reported results
of operations for the third quarter ended September 30, 2018. For
the three months ended September 30, 2018, we reported a net income
applicable to common shares of $5.9 million or $1.44 per diluted
share for the three months ended September 30, 2018, as compared to
net income of $0.6 million or $0.15 per diluted share for the same
period ended 2017.
Our primary business is investing in real estate and mortgage
note receivables. Land held for development or sale has been our
sole operating segment.
Revenues
Land held subject to a sales contract has been our sole
operating segment. There was no operating revenue generated from
this segment for the three months ended September 30, 2018, as well
as the similar period in 2017. As of September 30, 2018, all land
was sold and in the three months ended September 30, 2018 a gain in
the amount of $7.3 million was recognized.
Expenses
There were no property operating expenses for the three months
ended September 30, 2018 as well as in the similar period in
2017.
General and administrative expenses were $83,000 for the three
months ended September 30, 2018. This represents a decrease of
$10,000, as compared to the prior period general and administrative
expenses of $93,000. This decrease was primarily due to an increase
in audit fees and cost reimbursements to our Advisor of
approximately $2,000 offset by a decrease in legal fees of
approximately $12,000.
Advisory fees were $168,000 for the three months ended September
30, 2018 compared to $166,000 for the same period of 2017 for an
increase of $2,000. Advisory fees are computed based on a gross
asset fee of 0.0625% per month (0.75% per annum) of the average of
the gross asset value.
Net income fee to related party increased $330,000 to $383,000
for the three months ended September 30, 2018 compared to the prior
period. The net income fee paid to our Advisor is calculated at
7.5% of net income.
Other income (expense)
Interest income increased to $1.2 million for the three months
ended September 30, 2018 compared to $0.9 million for the same
period of 2017. The increase of $0.3 million was due primarily to
increase in advisory fee balance.
About Income Opportunity Realty Investors, Inc.
Income Opportunity Realty Investors, Inc., a Dallas-based real
estate investment company, holds a portfolio of equity real estate
in Texas, including undeveloped land. The Company invests in real
estate through direct equity ownership and partnerships. For more
information, visit the Company’s website at www.incomeopp-realty.com.
INCOME OPPORTUNITY REALTY
INVESTORS, INC. CONSOLIDATED STATEMENTS OF OPERATIONS
(Unaudited) Three Months Ended September 30, Nine
Months Ended September 30, 2018
2017 2018 2017
(dollars in thousands, except per share amounts)
Revenues: Rental and other property revenues $ - $ - $ - $ -
Expenses: Property operating expenses - - - - General
and administrative (including $67 and $63 for the three months and
$201 and $174 for the nine months ended 2018 and 2017,
respectively, to related parties) 83 93 359 342 Net income fee to
related party 383 53 489 189 Advisory fee to related party
168 166 500 493
Total operating expenses 634 312
1,348 1,024 Net operating loss (634 ) (312 )
(1,348 ) (1,024 )
Other income (expenses): Interest
income from related parties 1,201 924 3,324 3,133 Other Income
- - - 250
Total other income 1,201 924
3,324 3,383 Income before gain on sale of real
estate land 567 612 1,976 2,359 Gain on sale of real estate land
7,323 - 7,323 -
Income before taxes 7,890 612 9,299 2,359 Income tax
(expense) - current (1,902 ) - (1,902 )
- Net income $ 5,988 $ 612 $ 7,397
$ 2,359
Earnings per share - basic and
diluted Net income $ 1.44 $ 0.15 $ 1.77 $
0.57 Weighted average common shares used in computing
earnings per share 4,168,214 4,168,214 4,168,214 4,168,214
INCOME OPPORTUNITY REALTY INVESTORS, INC.
CONSOLIDATED BALANCE SHEETS September 30,
December 31, 2018 2017
(unaudited) (audited) (dollars in
thousands, except par value amount) Assets Real estate
land holdings subject to sales contract, at cost $ - $
22,717 Total real estate - 22,717 Notes and interest
receivable from related parties 13,577 14,030
Total notes and interest receivable 13,577 14,030 Cash and
cash equivalents 1 2 Receivable and accrued interest from related
parties 81,720 49,631 Other assets - 1,517
Total assets $ 95,298 $ 87,897
Liabilities and Shareholders’ Equity Liabilities: Accounts
payable and other liabilities $ 14 $ 10 Total
liabilities 14 10 Shareholders’ equity: Common stock, $0.01 par
value, authorized 10,000,000 shares; issued 4,173,675 and
outstanding 4,168,214 shares in 2018 and 2017 42 42 Treasury stock
at cost, 5,461 shares in 2018 and 2017 (39 ) (39 ) Paid-in capital
61,955 61,955 Retained earnings 33,326 25,929
Total shareholders' equity 95,284
87,887 Total liabilities and shareholders' equity $ 95,298
$ 87,897
View source
version on businesswire.com: https://www.businesswire.com/news/home/20181113006204/en/
Income Opportunity Realty Investors, Inc.Investor
RelationsGene Bertcher (800)
400-6407investor.relations@incomeopp-realty.com
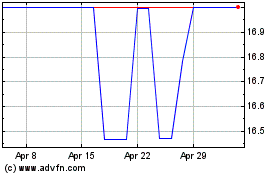
Income Opportunity Realt... (AMEX:IOR)
Historical Stock Chart
From Mar 2024 to Apr 2024

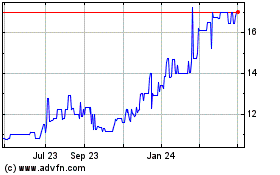
Income Opportunity Realt... (AMEX:IOR)
Historical Stock Chart
From Apr 2023 to Apr 2024
