Fiscal 2018 Operating Income Increased 47% on a
10% Gain in Revenue
Trio-Tech International (NYSE MKT: TRT) today announced
financial results for the fourth quarter and fiscal year ended June
30, 2018:
● Fourth quarter net income increased 91% to $0.17 per diluted
share vs $0.09 for the same quarter last year.
● Fiscal 2018 operating income increased 47% vs fiscal 2017.
● Fiscal 2018 net income after one-time $900,000 tax expense was
$0.31 per diluted share vs $0.36 for fiscal 2017.
CEO Comments
"The fourth quarter of fiscal 2018 was another good quarter for
Trio-Tech. Improved gross margin and slightly higher revenue helped
us deliver solid earnings growth for the quarter, capping an
impressive year for our company.
"Fiscal 2018 revenue increased at each of Trio-Tech’s core
business segments, compared to fiscal 2017, and was led by a 17%
gain in our revenue at our testing services operations. However,
our bottom-line performance for fiscal 2018 was affected by a
one-time, income tax expense of $900,000, related to the Tax Cuts
and Jobs Act of 2017, which requires a mandatory one-time
repatriation of certain earnings and profits of the Company’s
foreign subsidiaries previously deferred from U.S. taxation. This
estimated tax is payable over a period of eight years at no
interest and is not expected to have a material effect on the
Company’s working capital position. Without this one-time tax
expense, net earnings for fiscal 2018 would have exceeded our
fiscal 2017 result.
"Trio-Tech's financial condition grew even stronger in fiscal
2018. Higher cash flow from operations versus prior year
contributed to an increase in cash and equivalents to $1.84 per
outstanding share at June 30, 2018, compared to $1.35 per
outstanding share at June 30, 2017. Shareholders' equity also
increased, to $6.61 per outstanding share at the close of fiscal
2018 compared to $6.11 per outstanding share at June 30, 2017.
"Our backlog at the end of fiscal 2018 remained strong at
$8,699,000 compared to $7,546,000 at the end of fiscal 2017," said
S.W. Yong, Trio-Tech's CEO.
Fiscal 2018 Fourth Quarter Results
For the fiscal fourth quarter ended June 30, 2018, revenue
increased 1% to $10,760,000 compared to revenue of $10,638,000 for
the fourth quarter of fiscal 2017. Testing services revenue
increased 13% to $4,937,000 compared to $4,382,000 for the same
quarter last year reflecting higher volume at the company's
Singapore, Malaysia and Tianjin, China facilities. Manufacturing
revenue increased 1% to $4,116,000 from $4,068,000 due to firmer
demand at Trio-Tech's Suzhou, China and U.S. operations.
Distribution revenue declined 22% to $1,678,000 from $2,151,000,
primarily because of lower customer demand in Asia.
Gross margin for the fiscal fourth quarter improved to 27% of
revenue, compared to 22% of revenue for the same quarter of the
prior fiscal year, driven primarily by a favorable product mix in
Trio-Tech's manufacturing segment.
Operating expenses for the fourth quarter were $2,142,000, or
20% of revenue, compared to $2,014,000, or 19% of revenue, for the
fourth quarter of fiscal 2017.
Income from operations for the fourth quarter more than doubled
to $709,000 from $349,000 for the fourth quarter of fiscal
2017.
Net income attributable to Trio-Tech International common
shareholders for the fourth quarter of fiscal 2018 increased 91% to
$675,000, or $0.17 per diluted share, from $353,000, or $0.09 per
diluted share, for the fourth quarter of the prior fiscal year.
Fiscal 2018 Results
For the twelve months ended June 30, 2018, revenue increased 10%
to $42,361,000 compared to revenue of $38,538,000 for fiscal 2017.
Testing services revenue increased 17% to $19,391,000, compared to
$16,586,000 for fiscal 2017. Manufacturing revenue increased 5% to
$15,978,000 compared to $15,289,000 in fiscal 2017. Distribution
revenue increased 5% to $6,853,000 compared to $6,511,000 in fiscal
2017.
Gross profit for fiscal 2018 increased 12% to $10,638,000
compared to $9,462,000 for fiscal 2017. Gross margin was
approximately 25% of revenue in both periods, as higher gross
margin for the manufacturing segment was offset by lower gross
margin in testing services.
Operating expenses for fiscal 2018 increased 6% to $8,450,000
compared to $7,973,000 for fiscal 2017, but declined, as percent of
revenue, to 20% from 21% for fiscal 2017.
Income from operations increased 47% to $2,188,000 compared to
$1,489,000 in fiscal 2017.
Net income attributable to Trio-Tech International common
shareholders for fiscal 2018 declined 10% to $1,184,000, or $0.31
per diluted share, compared to $1,316,000, or $0.36 per diluted
share in fiscal 2017. Fiscal 2018 net income was affected by a
one-time, income tax expense of $900,000, related to the Tax Cuts
and Jobs Act of 2017.
About Trio-Tech
Established in 1958 and headquartered in Van Nuys, California,
Trio-Tech International is a diversified business group with
interests in semiconductor testing services, manufacturing and
distribution of semiconductor testing equipment, and real estate.
Further information about Trio-Tech's semiconductor products and
services can be obtained from the Company's Web site at
www.triotech.com, www.universalfareast.com, and
www.ttsolar.com.
Forward-Looking Statements
This press release contains statements that are forward-looking
statements within the meaning of the Private Securities Litigation
Reform Act of 1995 and may contain forward-looking statements
within the meaning of Section 27A of the Securities Act of 1933, as
amended, and Section 21E of the Securities Exchange Act of 1934, as
amended, and assumptions regarding future activities and results of
operations of the Company. In light of the "safe harbor" provisions
of the Private Securities Litigation Reform Act of 1995, the
following factors, among others, could cause actual results to
differ materially from those reflected in any forward-looking
statements made by or on behalf of the Company: market acceptance
of Company products and services; changing business conditions or
technologies and volatility in the semiconductor industry, which
could affect demand for the Company’s products and services; the
impact of competition; problems with technology; product
development schedules; delivery schedules; changes in military or
commercial testing specifications which could affect the market for
the Company’s products and services; difficulties in profitably
integrating acquired businesses, if any, into the Company; risks
associated with conducting business internationally and especially
in Asia, including currency fluctuations and devaluation, currency
restrictions, local laws and restrictions and possible social,
political and economic instability; changes to government policies,
potential legislative changes in U.S. and global financial and
equity markets, including market disruptions and significant
interest rate fluctuations; and other economic, financial and
regulatory factors beyond the Company’s control. Other than
statements of historical fact, all statements made in this press
release are forward-looking, including, but not limited to,
statements regarding industry prospects, future results of
operations or financial position, and statements of our intent,
belief and current expectations about our strategic direction,
prospective and future financial results and condition. In some
cases, you can identify forward-looking statements by the use of
terminology such as “may,” “will,” “expects,” “plans,”
“anticipates,” “estimates,” “potential,” “believes,” “can impact,”
“continue,” or the negative thereof or other comparable
terminology. Forward-looking statements involve risks and
uncertainties that are inherently difficult to predict, which could
cause actual outcomes and results to differ materially from our
expectations, forecasts and assumptions.
TRIO-TECH INTERNATIONAL AND SUBSIDIARIES CONSOLIDATED
STATEMENTS OF OPERATIONS AND COMPREHENSIVE INCOME AUDITED (IN
THOUSANDS, EXCEPT EARNINGS PER SHARE)
Three Months Ended Twelve Months Ended June 30, June 30,
Revenue 2018 2017 2018 2017
Manufacturing $ 4,116 $ 4,068 $ 15,978 $ 15,289 Testing services
4,937 4,382 19,391 16,586 Distribution 1,678 2,151 6,853 6,511
Others 29 37 139
152 10,760 10,638 42,361
38,538 Cost of Sales Cost of manufactured
products sold 2,967 3,329 12,213 12,091 Cost of testing services
rendered 3,442 2,988 13,323 11,057 Cost of distribution 1,470 1,929
6,068 5,828 Others 30 29 119
100 7,909 8,275
31,723 29,076 Gross Margin 2,851 2,363
10,638 9,462 Operating Expenses: General and administrative 1,911
1,733 7,250 6,911 Selling 214 220 826 807 Research and development
74 52 451 208 (Loss) Gain on disposal of property, plant and
equipment (57 ) 9 (77 ) 47
Total operating expenses 2,142 2,014
8,450 7,973 Income from
Operations 709 349 2,188 1,489 Other (Expenses) Income Interest
expense (59 ) (53 ) (233 ) (202 ) Other income, net 24
156 335 514 Total
other (Expenses) Income (35 ) 103 102
312 Income from Continuing Operations before
Income Taxes 674 452 2,290 1,801 Income Tax Benefit Expense
48 (85 ) (987 ) (341 )
Income from Continuing Operations before
Non-controlling Interest, net of tax
722 367 1,303 1,460 Loss from discontinued operations, net of tax
(2 ) (1 ) (13 ) (5 ) NET INCOME 720 366
1,290 1,455 Less: Net income attributable to the non-controlling
interest 45 13 106
139 Net Income attributable to Trio-Tech International 675
353 1,184 1,316 Net Income Attributable to Trio-Tech International:
Income from continuing operations, net of tax 677 355 1,197 1,325
Loss from discontinued operations, net of tax (2 ) (2
) (13 ) (9 ) Net Income Attributable to Trio-Tech
International $ 675 $ 353 $ 1,184 $ 1,316
Basic Earnings per Share - Continuing Operations $ 0.19 $
0.10 $ 0.34 $ 0.38 Basic Loss per Share - Discontinued Operations
(0.01 ) -- (0.01 ) --
Basic Earnings per Share $ 0.18 $ 0.10 $ 0.33
$ 0.38 Diluted Earnings per Share – Continuing Operations $
0.18 $ 0.09 $ 0.32 $ 0.36 Diluted Loss per Share – Discontinued
Operations (0.01 ) -- (0.01 ) --
Diluted Earnings per Share $ 0.17 $ 0.09 $
0.31 $ 0.36 Weighted Average Shares Outstanding -
Basic 3,553 3,523 3,553 3,523 Weighted Average Shares Outstanding -
Diluted 3,714 3,737 3,771 3,644
TRIO-TECH
INTERNATIONAL AND SUBSIDIARIES CONSOLIDATED STATEMENTS OF
OPERATIONS AND COMPREHENSIVE INCOME AUDITED (IN THOUSANDS, EXCEPT
EARNINGS PER SHARE) Three Months
Ended Twelve Months Ended June 30, June 30, 2018 2017
2018 2017
Comprehensive Income Attributable to
Trio-Tech International:
Net income $ 720 $ 366 $ 1,290 $ 1,455 Foreign currency
translation, net of tax (1,081 ) 408 728
(679 ) Comprehensive (Loss) Income (361 ) 774 2,018 776
Less: Comprehensive Income (Loss)
attributable to non-controlling interests
30 64 285 (11 )
Comprehensive (Loss) Income Attributable
to Trio-Tech International
$ (391 ) $ 710 $ 1,733 $ 787
TRIO-TECH
INTERNATIONAL AND SUBSIDIARIES CONDENSED CONSOLIDATED BALANCE
SHEETS (IN THOUSANDS, EXCEPT NUMBER OF SHARES) June
30, June 30, 2018 2017
ASSETS
(audited) CURRENT ASSETS: Cash and cash equivalents $ 6,539
$ 4,772 Short-term deposits 653 787 Trade accounts receivable, net
8,007 9,009 Other receivables 621 401 Inventories, net 2,930 1,756
Prepaid expenses and other current assets 208 226 Assets held for
sale 91 86 Total current assets 19,049 17,037
Deferred tax assets 400 375 Investment properties, net 1,146 1,216
Property, plant and equipment, net 11,935 11,291 Other assets 2,249
1,922 Restricted term deposits 1,695 1,657 Total
non-current assets 17,425 16,461 TOTAL ASSETS $
36,474 $ 33,498
LIABILITIES AND SHAREHOLDERS’ EQUITY
CURRENT LIABILITIES: Lines of credit $ 2,043 $ 2,556
Accounts payable 3,704 3,229 Accrued expenses 3,172 3,043 Income
taxes payable 285 233 Current portion of bank loans payable 367 260
Current portion of capital leases 250 228 Total
current liabilities 9,821 9,549 Bank loans payable, net of current
portion 1,437 1,552 Capital leases, net of current portion 524 531
Deferred tax liabilities 327 295 Income taxes payable 828 -- Other
non-current liabilities 36 44 Total non-current
liabilities 3,152 2,422 TOTAL LIABILITIES
12,973 11,971 COMMITMENTS AND CONTINGENCIES -- -- EQUITY
TRIO-TECH INTERNATIONAL'S SHAREHOLDERS' EQUITY:
Common stock, no par value, 15,000,000
shares authorized; 3,553,055 and 3,523,055 issued and outstanding
at June 30, 2018 and June 30, 2017, respectively
11,023 10,921 Paid-in capital 3,249 3,206 Accumulated retained
earnings 5,525 4,341 Accumulated other comprehensive
gain-translation adjustments 2,182 1,633 Total
Trio-Tech International shareholders' equity 21,979 20,101
Non-controlling interest 1,522 1,426 TOTAL EQUITY
23,501 21,527 TOTAL LIABILITIES AND EQUITY $ 36,474 $
33,498
View source
version on businesswire.com: https://www.businesswire.com/news/home/20180925005435/en/
Company Contact:Trio-Tech InternationalA. Charles
WilsonChairman(818) 787-7000orInvestor Contact:Berkman
Associates(310) 477-3118info@BerkmanAssociates.com
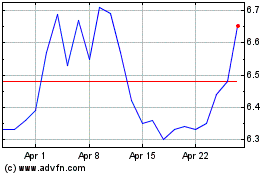
Trio Tech (AMEX:TRT)
Historical Stock Chart
From Mar 2024 to Apr 2024

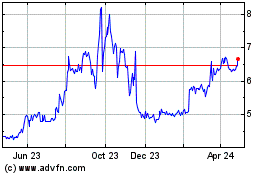
Trio Tech (AMEX:TRT)
Historical Stock Chart
From Apr 2023 to Apr 2024
