By Michael Wursthorn
Shares of companies like Amazon.com Inc., Netflix Inc. and
Salesforce.com Inc. have surged this year, driving the stock market
higher but also pushing valuations to what some investors consider
worrisome levels.
The valuation of the average stock in the S&P 500 is now in
the 97th percentile of historical levels, according to Goldman
Sachs Group Inc., which analyzed 40 years of market pricing and
valuation data. The valuation level is thanks in large part to the
rise of highflying tech stocks.
That has kicked off debate among investors as the bull market in
stocks is set this week to become the longest in history, based on
intraday trading.
Some investors believe the high valuation level shows a lack of
breadth in the market's rise, leaving stocks vulnerable to a
pullback. An analysis of data going back to 1964 shows that higher
multiples have led to weaker returns over 10-year stretches,
according to Credit Suisse Group AG.
Other investors counter that the way tech companies operate,
with heavy spending on developing new products, along with an
ability to disrupt markets or create new ones, makes traditional
valuation measures such a price/earnings ratios less relevant. The
problem, they say, is that such formulas say more about a company's
current situation and profitability than what sales and earnings
will look like five years out.
"I don't talk about multiples. That's where the conversation
stops," Jonathan Curtis, a portfolio manager at Franklin
Templeton's Franklin Equity Group, says of discussions with others
about tech companies. "I tell them, 'Help me understand what this
business looks like at maturity.'"
He and others argue that investors have to take a longer-term
view of high spending that depresses short-term profits, and so
leads to elevated price/earnings multiples.
Amazon, for example, has spent heavily to expand its logistics
and distribution, as well as its cloud-services arm. That led to
slim profits, or losses, in many quarters, leading some investors
to question a high multiple for a company constantly diving into
new businesses.
Now, the stock, up more than 60% this year, is the
single-biggest driving force behind the S&P 500's more than 6%
gain in 2018, as its Prime subscription service and web-services
arm have created a loyal client base. Amazon's soaring stock price
is also due to its ongoing shake-up of the retail, health-care and
cloud-computing industries.
Still, Amazon trades at a lofty 85 times future earnings, and
over the past three years its multiple has averaged around 115
times, according to FactSet. In comparison, the S&P 500 trades
at about 16 times earnings expected over the next 12 months.
Meanwhile, Netflix has spent billions of dollars to acquire
content and attract subscribers to make itself the leading
streaming service in the U.S.
It trades at a forward price/earnings ratio of 85 times,
according to FactSet.
Facebook shows, though, how companies can grow into outside
valuations. Less than five years ago, Facebook was trading at more
than 50 times forward earnings as it outspent rivals to dominate
social media's advertising landscape. Increased profits have
brought its valuation down to 23 times TIMES today.
"You have to bring some logic to those numbers to justify these
multiples," said Sebastian Werner, lead portfolio manager of
Deutsche Bank's DWS Science and Technology Fund.
Mr. Werner's investment team looks for a line of sight on how
much extra cash a business will generate after it covers big-ticket
expenses, a track record of massive revenue growth year over year
and the likelihood of profit-margin growth of as much as 40%.
Perhaps most important is how much many of these companies,
especially in the software space, are spending and making on their
customers, said Matt Sabel, a portfolio manager for MFS
Investments.
Companies like Salesforce spend massive sums to attract
customers, stretching its price/earnings ratio above 50 times. But
instead of looking at that cost and assuming it is high or low,
some investors have taken to measuring it against the value of
those customer relationships.
For a company like Salesforce with multiyear customer
agreements, the value of its clients vastly outpaces its
acquisition costs, bullish analysts said. By determining the ratio
of the lifetime value of a customer versus a company's customer
acquisition cost, an investor can determine whether spending on
marketing and sales is paying off, they add. Shares of Salesforce
are up 43% this year.
"It's very easy to analyze this year's costs and say look at all
this SPEND and it's unprofitable," said Mr. Sabel. "But the
cash-flow stream continues to grow over many years."
Of course, high multiples also mean companies can't afford even
small missteps. Netflix shares, for instance, have fallen 16% over
the past month after it said in July that it missed its own
forecasts by more than a million subscribers in the second
quarter.
And some investors caution rising interest rates will force down
overly optimistic valuations. The recent period of superlow rates
helped support higher valuations since future profits are worth
more when discounted back into today's money. As rates rise and
debt gets more expensive, profit margins will fall, said John
Prichard, president of Knightsbridge Asset Management.
Valuation concerns have already crept into the market, some
investors said, as defensive stocks that tend to post lower growth
than companies like Amazon and Facebook have outperformed. The top
five performing S&P 500 sectors the past three months are all
defensive, Bank of America Merrill Lynch said in a recent note,
including consume staples, utilities and health care.
"Valuations matter a lot more as you extend the time horizon,"
said Mr. Prichard. Add interest rates to the mix and "at some point
that will depress high-P/E stocks."
Write to Michael Wursthorn at Michael.Wursthorn@wsj.com
(END) Dow Jones Newswires
August 19, 2018 08:14 ET (12:14 GMT)
Copyright (c) 2018 Dow Jones & Company, Inc.
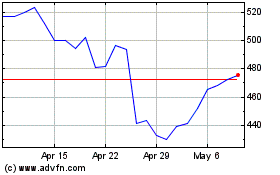
Meta Platforms (NASDAQ:META)
Historical Stock Chart
From Mar 2024 to Apr 2024

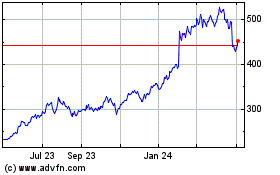
Meta Platforms (NASDAQ:META)
Historical Stock Chart
From Apr 2023 to Apr 2024
