Senseonics Holdings, Inc. (NYSE-American: SENS), a medical
technology company focused on the development and commercialization
of a long-term, implantable continuous glucose monitoring (CGM)
system for people with diabetes, today reported financial results
for the second quarter ended June 30, 2018.
RECENT HIGHLIGHTS & ACCOMPLISHMENTS:
- Received FDA approval for the
Eversense® CGM System, the first and only long-term implantable
continuous glucose monitoring system
- Completed first commercial insertion in
the U.S.
- Secured first U.S. payor coverage of
Eversense from Horizon Blue Cross Blue Shield of New Jersey
- Eversense Mobile Clinic traveling
across the U.S. training physicians
- Eversense® XL System introduced across
the existing European markets
- Strengthened balance sheet with
additional $150 million of gross proceeds through completion of
underwritten equity offering
“Second quarter was a very significant period for Senseonics. We
received FDA approval for the Eversense System, began our U.S.
commercial launch at ADA, and subsequently, in just six weeks,
secured reimbursement from BCBS New Jersey. Additionally, our
penetration in the EMEA market continues to grow as we have
expanded availability of the Eversense XL across Europe,” said Tim
Goodnow, President and Chief Executive Officer of Senseonics. “As
we go forward in the balance of 2018, we will continue to execute
on our commercial strategy and clinical development programs as we
work toward label expansion and additional regulatory
approvals.”
SECOND QUARTER 2018 RESULTS:
Revenue was $3.6 million for the second quarter of 2018,
compared to $0.8 million for the second quarter of 2017 and $2.9
million for the first quarter of 2018.
Second quarter 2018 sales and marketing expenses increased $2.7
million versus first quarter 2018, to $6.2 million. The increase in
sales and marketing expenses was primarily driven by an increase in
compensation expense associated with adding additional sales
resources to prepare for a United States launch in 2018, as well as
to support and expand the distribution of Eversense in Europe.
Second quarter 2018 research and development expense was
essentially flat compared to first quarter 2018 and $2.7 million
greater than second quarter 2017. The year-over-year increase in
research and development expenses was primarily driven by the
on-going support of our pre-market approval application including
the completion of the Advisory Panel activity.
Second quarter 2018 general and administrative expenses
increased $1.4 million over first quarter 2018 and increased $1.5
million over second quarter 2017, to $5.4 million. The
year-over-year increase in general and administration expenses was
primarily driven by an increase in compensation, legal and other
administrative expense associated with supporting operational
growth.
Net loss was $32.5 million, or $0.23 per share, in the second
quarter of 2018, compared to $12.4 million, or $0.12 per share, in
the second quarter of 2017. This compares to a first quarter 2018
net loss of $22.3 million or $0.16 per share. The increase in net
loss in the second quarter of 2018 compared to the first quarter of
2018 was driven primarily by a $5.3 million increase in the loss
from the change in fair value of the derivative liability and a
$4.1 million increase in operating expense. Excluding the change in
the increase of the derivative liability during the second quarter
2018, net loss for the three months ended June 30, 2018 would have
been $22.3 million or $0.16 per share. Second quarter 2018 net loss
per share for the three months ended June 30, 2018 was based on
138.8 million weighted average shares outstanding, compared to
103.7 million weighted average shares outstanding in the second
quarter of 2017.
As of June 30, 2018, cash, cash equivalents, and marketable
securities were $191.9 million and outstanding indebtedness was
$72.7 million.
CONFERENCE CALL AND WEBCAST INFORMATION
Company management will host a conference call at 4:30 pm
(Eastern Time) today, August 8, 2018, to discuss these financial
results. This conference call can be accessed live by telephone or
through Senseonics’ website.
Live
Teleconference Information:
Live Webcast
Information:
Dial in number: (877)883-0383
Visit http://www.senseonics.com and select
the “Investor Relations” section
International dial in: (412)902-6506
A replay of the call can be accessed on Senseonics’ website
http://www.senseonics.com under “Investor Relations.”
About Senseonics
Senseonics Holdings, Inc. is a medical technology company
focused on the development and commercialization of
transformational glucose monitoring products designed to help
people with diabetes confidently live their lives with ease.
Senseonics' CGM systems, Eversense and Eversense XL, include a
small sensor inserted completely under the skin that communicates
with a smart transmitter worn over the sensor. The glucose data are
automatically sent every 5 minutes to a mobile application on the
user's smartphone.
FORWARD LOOKING STATEMENTS
Any statements in this press release about future expectations,
plans and prospects for Senseonics, including statements about the
clinical development of future generations of Eversense, the
expanded commercialization of Eversense and Eversense XL in Europe,
label expansion, additional regulatory approvals, and other
statements containing the words “expect,” “intend,” “may,”
“projects,” “will,” and similar expressions, constitute
forward-looking statements within the meaning of The Private
Securities Litigation Reform Act of 1995. Actual results may differ
materially from those indicated by such forward-looking statements
as a result of various important factors, including: uncertainties
inherent in the regulatory approval process, uncertainties inherent
in the expanded commercial launch of Eversense and Eversense XL in
Europe and such other factors as are set forth in the risk factors
detailed in Senseonics’ Annual Report on Form 10-K for the year
ended December 31, 2017, Senseonics’ Quarterly Report on Form 10-Q
for the quarter ended June 30, 2018, and Senseonics’ other filings
with the SEC under the heading “Risk Factors.” In addition, the
forward-looking statements included in this press release represent
Senseonics’ views as of the date hereof. Senseonics anticipates
that subsequent events and developments will cause Senseonics’
views to change. However, while Senseonics may elect to update
these forward-looking statements at some point in the future,
Senseonics specifically disclaims any obligation to do so except as
required by law. These forward-looking statements should not be
relied upon as representing Senseonics’ views as of any date
subsequent to the date hereof.
FINANCIAL STATEMENTS TO FOLLOW:
Senseonics Holdings, Inc.
Condensed Consolidated Balance Sheets (in
thousands, except share and per share data) June
30, December 31, 2018 2017
(unaudited)
Assets Current assets: Cash and cash equivalents
$ 183,928 $ 16,150 Marketable securities 7,954 20,300 Accounts
receivable, primarily from a related party 2,988 3,382 Inventory,
net 8,400 2,991 Prepaid expenses and other current assets
4,195 2,092 Total current assets 207,465
44,915 Deposits and other assets 205 176 Property and
equipment, net 998 853 Total assets $
208,668 $ 45,944
Liabilities and
Stockholders’ Equity Current liabilities: Accounts payable $
5,172 $ 7,712 Accrued expenses and other current liabilities 9,863
5,428 Notes payable, current portion 10,000
10,000 Total current liabilities 25,035 23,140 Notes
payable, net of discount 9,619 14,414 Convertible senior notes, net
of discount 34,469 — Derivative liability 32,312 — Notes payable,
accrued interest 1,444 1,054 Other liabilities 73
69 Total liabilities 102,952 38,677
Commitments and contingencies (Note 8) Stockholders’ equity:
Common stock, $0.001 par value per share; 450,000,000 and
250,000,000 shares authorized, 175,897,790 and 136,882,735 shares
issued and outstanding as of June 30, 2018 and December 31, 2017
177 137 Additional paid-in capital 424,131 270,953 Accumulated
deficit (318,592 ) (263,823 ) Total stockholders'
equity 105,716 7,267 Total liabilities
and stockholders’ equity $ 208,668 $ 45,944
Senseonics Holdings, Inc. Unaudited Condensed
Consolidated Statement of Operations and Comprehensive Loss
(in thousands, except share and per share data)
Three Months Ended Six Months Ended June 30,
June 30, 2018 2017 2018 2017
Revenue, primarily from a related party $ 3,623 $ 814 $ 6,569 $
1,367 Cost of sales 3,839 1,714
7,147 2,759 Gross profit (216 ) (900 ) (578 )
(1,392 ) Expenses: Sales and marketing expenses 6,177 1,249
9,618 2,389 Research and development expenses 8,289 5,604 16,402
12,602 General and administrative expenses 5,382
3,888 9,393 7,655
Operating loss (20,064 ) (11,641 ) (35,991 ) (24,038 ) Other income
(expense), net: Interest income 241 37 425 58 Interest expense
(2,236 ) (767 ) (4,007 ) (1,451 ) Change in fair value of 2023
derivative (10,166 ) — (15,013 ) — Other expense (271 )
(3 ) (183 ) (16 ) Total other expense, net
(12,432 ) (733 ) (18,778 ) (1,409 )
Net loss (32,496 ) (12,374 ) (54,769 ) (25,447 ) Total
comprehensive loss $ (32,496 ) $ (12,374 ) $ (54,769 ) $ (25,447 )
Basic and diluted net loss per common share $ (0.23 ) $
(0.12 ) $ (0.40 ) $ (0.26 ) Basic and diluted weighted-average
shares outstanding 138,767,873 103,689,994
137,923,135 98,825,088
View source
version on businesswire.com: https://www.businesswire.com/news/home/20180808005748/en/
INVESTOR CONTACTSenseonics Holdings, Inc.R. Don Elsey,
301-556-1602Chief Financial Officerdon.elsey@senseonics.com
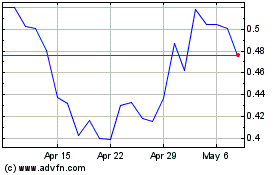
Senseonics (AMEX:SENS)
Historical Stock Chart
From Mar 2024 to Apr 2024

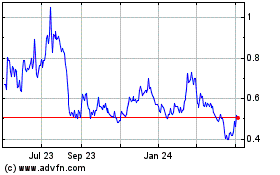
Senseonics (AMEX:SENS)
Historical Stock Chart
From Apr 2023 to Apr 2024
