- Net income reached US$806 million in
2017, from US$750 million in 2016, and was the highest net income
generation since 2007.
- Free cash flow after maintenance capex
for the full year was US$1.3 billion and conversion of EBITDA into
free cash flow after maintenance capex reached 50%.
- Total debt plus perpetual notes was
reduced by US$2.1 billion during 2017, on a pro-forma basis.
CEMEX, S.A.B. de C.V. ("CEMEX") (NYSE: CX), announced today
that, on a like-to-like basis for the ongoing operations and
adjusting for currency fluctuations, consolidated net sales
increased by 4% during the fourth quarter of 2017 to US$3.4
billion, and increased 3% for the full year 2017 to US$13.7 billion
versus the comparable periods in 2016. Operating EBITDA on a
like-to-like basis decreased by 7% during the fourth quarter of
2017 to US$625 million and decreased by 6% for the full year to
US$2.6 billion versus 2016.
CEMEX’s Consolidated Fourth-Quarter and
Full-Year 2017 Financial and Operational Highlights
- The increase in quarterly consolidated
net sales on a like-to-like basis was due to higher prices of our
products, in local currency terms in Mexico, the U.S. and our
Europe region, as well as higher volumes in our U.S., Europe and
Asia, Middle East & Africa regions.
- Operating earnings before other
expenses, net, in the fourth quarter decreased by 10%, to US$410
million and decreased by 9%, to US$1.7 billion, for the full-year
2017.
- Controlling interest net loss during
the quarter was US$105 million from an income of US$214 million in
the same period of 2016. Controlling interest net income for the
full year improved to US$806 million from US$750 million in
2016.
- Operating EBITDA on a like-to-like
basis decreased by 7% and 6% during the quarter and the full year,
respectively, to US$625 million and US$2.6 billion versus the
comparable periods of 2016.
- Operating EBITDA margin during the
quarter decreased to 18.3% from 20.7% in the same period of 2016.
For the full year, operating EBITDA margin decreased to 18.8% from
20.6% during 2016.
- Free cash flow after maintenance
capital expenditures for the quarter increased by 10% to US$680
million, compared to the same quarter of 2016. For the full year
2017, free cash flow after maintenance capital expenditures reached
US$1.3 billion and conversion of EBITDA into free cash flow after
maintenance capex reached 50%.
Fernando A. Gonzalez, Chief Executive Officer of CEMEX, said,
“Although 2017 was a challenging year, our two largest markets,
Mexico and the United States, performed well with like-to-like
increases in their EBITDA. We also generated free cash flow after
maintenance capex of close to US$1.3 billion, with a 50%
EBITDA-to-free-cash-flow conversion rate and which, together with
our asset-divestment initiatives, resulted in pro-forma debt
reduction of close to US$2.1 billion during the year.
“We had important headwinds during the year: underperformance in
Colombia, Egypt and the Philippines as well as increased energy
costs, mainly in Mexico. As we have done in the past, we focused on
the variables we control to dampen these headwinds and we continued
to deliver solid results.”
Consolidated Corporate Results
During the fourth quarter of 2017, controlling interest net loss
was US$105 million, versus an income of US$214 million in the same
period last year. Controlling interest net income for the full year
improved to US$806 million from US$750 million in 2016.
Total debt plus perpetual notes decreased by US$209 million
during the quarter. During 2017, total debt plus perpetual notes
was reduced by approximately US$1.7 billion, which represents a 13%
reduction from the debt level as of the end of 2016 and a 26%
reduction compared to the end of 2015. On a pro-forma basis,
including the payment of the 4.75% senior secured notes due 2022
outstanding aggregate principal amount, made on January 2018, total
debt plus perpetual notes was reduced by US$2.1 billion during
2017.
Geographical Markets Fourth-Quarter 2017
Highlights
Net sales in our operations in Mexico increased 6% on a
like-to-like basis in the fourth quarter of 2017 to US$781 million,
compared with US$701 million in the fourth quarter of 2016.
Operating EBITDA increased by 8% on a like-to-like basis to US$277
million versus the same period of last year.
CEMEX’s operations in the United States reported net
sales of US$838 million in the fourth quarter of 2017, an increase
of 4% on a like-to-like basis from the same period in 2016.
Operating EBITDA decreased by 5% on a like-to-like basis to US$158
million in the quarter, versus US$180 million in the same quarter
of 2016.
CEMEX’s operations in South, Central America and the
Caribbean reported net sales of US$452 million during the
fourth quarter of 2017, representing a decrease of 3% on a
like-to-like basis over the same period of 2016. Operating EBITDA
decreased by 10% on a like-to-like basis to US$105 million in the
fourth quarter of 2017, from US$108 million in the same quarter of
2016.
In Europe, net sales for the fourth quarter of 2017
increased by 5% on a like-to-like basis to US$911 million, compared
with US$780 million in the fourth quarter of 2016. Operating EBITDA
was US$99 million for the quarter, 9% higher on a like-to-like
basis than the same period last year.
Operations in Africa, Middle East and Asia reported a 14%
increase in net sales on a like-to-like basis for the fourth
quarter of 2017, to US$363 million, versus the same quarter of
2016. Operating EBITDA for the quarter was US$53 million, 31% lower
on a like-to-like basis from the same period last year.
CEMEX is a global building materials company that provides high
quality products and reliable service to customers and communities
in more than 50 countries. CEMEX has a rich history of improving
the well-being of those it serves through innovative building
solutions, efficiency advancements, and efforts to promote a
sustainable future.
This press release contains forward-looking statements and
information that are necessarily subject to risks, uncertainties
and assumptions. Many factors could cause the actual results,
performance or achievements of CEMEX to be materially different
from those expressed or implied in this release, including, among
others, changes in general economic, political, governmental and
business conditions globally and in the countries in which CEMEX
does business, changes in interest rates, changes in inflation
rates, changes in exchange rates, the level of construction
generally, changes in cement demand and prices, changes in raw
material and energy prices, changes in business strategy and
various other factors. Should one or more of these risks or
uncertainties materialize, or should underlying assumptions prove
incorrect, actual results may vary materially from those described
herein. CEMEX assumes no obligation to update or correct the
information contained in this press release.
Operating EBITDA is defined as operating income plus
depreciation and operating amortization. Free Cash Flow is defined
as Operating EBITDA minus net interest expense, maintenance and
expansion capital expenditures, change in working capital, taxes
paid, and other cash items (net other expenses less proceeds from
the disposal of obsolete and/or substantially depleted operating
fixed assets that are no longer in operation). Net debt is defined
as total debt minus the fair value of cross-currency swaps
associated with debt minus cash and cash equivalents. The
Consolidated Funded Debt to Operating EBITDA ratio is calculated by
dividing Consolidated Funded Debt at the end of the quarter by
Operating EBITDA for the last twelve months. All of the above items
are presented under the guidance of International Financial
Reporting Standards as issued by the International Accounting
Standards Board. Operating EBITDA and Free Cash Flow (as defined
above) are presented herein because CEMEX believes that they are
widely accepted as financial indicators of CEMEX's ability to
internally fund capital expenditures and service or incur debt.
Operating EBITDA and Free Cash Flow should not be considered as
indicators of CEMEX's financial performance, as alternatives to
cash flow, as measures of liquidity or as being comparable to other
similarly titled measures of other companies.
View source
version on businesswire.com: http://www.businesswire.com/news/home/20180208005504/en/
CEMEX, S.A.B. de C.V.Media Relations:Jorge Pérez,
+52(81) 8888-4334mr@cemex.comorInvestor Relations:Eduardo
Rendón, +52(81) 8888-4256ir@cemex.comorAnalyst
Relations:Lucy Rodriguez,
+1-212-317-6007ir@cemex.com
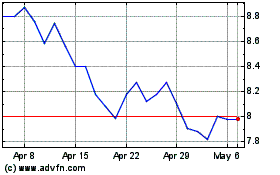
Cemex SaB De Cv (NYSE:CX)
Historical Stock Chart
From Mar 2024 to Apr 2024

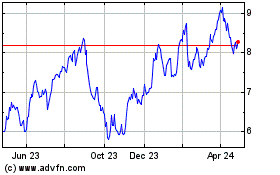
Cemex SaB De Cv (NYSE:CX)
Historical Stock Chart
From Apr 2023 to Apr 2024
