ENGlobal (NASDAQ:ENG), a leading provider of engineering and
automation services, today announced results for the third quarter
ended September 30, 2017.
ENGlobal reported a net loss of $12.1 million
for the third quarter of 2017 which was a $12.6 million decrease
over net income of $0.5 million reported for the prior year
period. The third quarter 2017 results included the effects
of a $11.3 million non-cash charge relating to a valuation
allowance that was taken against the Company’s deferred tax
assets. Net loss per diluted share was ($0.44) versus
net income per diluted share of $0.02 for the third quarter just
ended and for the third quarter of 2016, respectively.
During the second quarter of 2017, management
worked closely with a strategy consultant to perform an assessment
of the Company and both short term and long term market trends,
which in turn assisted management in updating its long term
business growth strategy. This assessment was completed in the
quarter just ended and concluded that ENGlobal’s market segments
that are expected to experience the highest future growth rates are
those relating to Industrial Controls and Automation and the
Industrial Internet of Things (IIOT).
These are both areas in which the Company has
extensive experience providing higher value products and services
to its clients but have not been the Company’s primary focus in
recent years. As a result of this strategic assessment,
management has developed a multi-year plan to invest and position
the Company as a leading provider of higher value industrial
automation and IIOT services to its extensive customer base – an
area that has historically produced higher project margins for
ENGlobal.
Additionally, through previous organic
initiatives, ENGlobal is now a vertically integrated service
provider with expertise in project related engineering, mechanical
fabrication, systems integration and automation. This positioning
has allowed the Company to differentiate itself from most of its
competitors as a full service provider - delivering benefits by
reducing its clients’ need to coordinate multiple vendors. In
addition, ENGlobal is now able to pursue larger scopes of work
focused on a wide range of modularized engineered systems.
Management believes that because of the vertical integration
strategy, an increasing amount of engineering, mechanical
fabrication and systems integration services necessary to support
the Company’s strategic growth plan will be awarded to the
Company.
Management's Assessment
William A. Coskey, P.E., Chairman and CEO of
ENGlobal stated: “Our management has been very busy - taking
actions during the quarter to begin the implementation of
ENGlobal’s strategy. These first steps included the reorganization
and refocusing of our business development personnel, the
development of relevant marketing materials and the successful
adoption of a new customer relationship management system. In
addition, during the quarter we completed the reorganization of our
operations staff resulting in a senior VP responsible for the
staffing, training, development and project execution of our
automation business and a senior VP with the same responsibilities
for our multidiscipline engineering and EPC projects business.”
Mark A. Hess, ENGlobal's Chief Financial Officer
stated: “During the quarter, we continued to work through
many projects that were awarded at the end of last year and early
this year at relatively lower margins. Combined with our low
productivity levels following hurricane Harvey, this produced lower
than expected revenue and gross margin for the quarter. While
our selling, general and administrative costs continue to be
rationalized and reduced, the reduction was not enough to offset
the reduced gross margin. In addition, during the quarter, pursuant
to standard accounting rules, we established a valuation allowance
against our deferred tax assets of $11.3 million.”
Mr. Hess continued: “While work as a result of
our strategy assessment is in its beginning phases, we have seen
encouraging early indicators that this approach is aligned with our
customers’ strategic focus and will be well received by our
clients. As one example, we have been developing our
automation pipeline over the last few quarters resulting in a 20%
increase of our automation backlog during the quarter just
ended. Proposal activity has been healthy and we are
currently awaiting client decisions on a number of significant
opportunities.”
The following is a summary of the income statement for the three
months ended September 30, 2017 and September 24, 2016:
| |
| (amounts in
thousands) |
|
Three months ended September 30,
2017 |
|
|
Three Months ended September 24,
2016 |
| Revenue |
$ |
12,896 |
|
$ |
15,968 |
| Gross Profit |
|
1,621 |
|
|
3,881 |
| General &
Administrative Expenses |
|
3,041 |
|
|
3,511 |
| Operating Income
(Loss) |
|
(1,420) |
|
|
370 |
| Net Income (Loss) |
|
(12,154) |
|
|
489 |
| |
|
|
|
|
|
The following table presents certain balance sheet items as of
September 30, 2017 and December 31, 2016:
| |
| (amounts in
thousands) |
|
As of September 30, 2017 |
|
As of December 31, 2016 |
| Cash |
$ |
10,898 |
$ |
15,687 |
| Working capital |
|
19,163 |
|
22,200 |
| |
|
|
|
|
The following table illustrates the composition of the Company's
revenue and profitability for its operations for the three and nine
months ended September 30, 2017 and September 24, 2016:
|
|
|
(amounts in thousands) |
Three months ended September 30,
2017 |
Three Months ended
September 24, 2016 |
| |
|
% of |
Gross |
Operating |
|
|
% of |
Gross |
Operating |
| |
Total |
Total |
Profit |
Profit |
|
Total |
Total |
Profit |
Profit |
|
Segment |
Revenue |
Revenue |
Margin |
Margin |
|
Revenue |
Revenue |
Margin |
Margin |
| |
|
|
|
|
|
|
|
|
|
| Engineering
& Construction |
$ |
8,573 |
66.5% |
10.5% |
0.3% |
|
$ |
8,216 |
51.5% |
17.7% |
6.6% |
| Automation |
|
4,323 |
33.5% |
16.7% |
4.4% |
|
|
7,752 |
48.5% |
31.3% |
22.5% |
|
Consolidated |
$ |
12,896 |
100.0% |
12.6% |
(11.0)% |
|
$ |
15,968 |
100.0% |
24.3% |
2.3% |
|
|
|
(amounts in thousands) |
Nine months ended September 30,
2017 |
Nine Months ended
September 24, 2016 |
| |
|
% of |
Gross |
Operating |
|
|
% of |
Gross |
Operating |
| |
Total |
Total |
Profit |
Profit |
|
Total |
Total |
Profit |
Profit |
|
Segment |
Revenue |
Revenue |
Margin |
Margin |
|
Revenue |
Revenue |
Margin |
Margin |
| |
|
|
|
|
|
|
|
|
|
| Engineering
& Construction |
$ |
26,833 |
64.9% |
13.5% |
3.5% |
|
$ |
25,000 |
56.0% |
11.5% |
1.8% |
| Automation |
|
14,503 |
35.1% |
15.5% |
4.0% |
|
|
19,622 |
44.0% |
23.1% |
11.9% |
|
Consolidated |
$ |
41,336 |
100.0% |
14.2% |
(8.8)% |
|
$ |
44,622 |
100.0% |
16.6% |
(6.3)% |
|
|
The Company's Quarterly Report on Form 10-Q for the quarterly
period ended September 30, 2017 is expected to be filed with the
Securities and Exchange Commission reflecting these results by the
end of the day on Friday, November 3, 2017.
About ENGlobalENGlobal (Nasdaq:ENG) is a
provider of engineering and automation services primarily to the
energy sector throughout the United States and
internationally. ENGlobal operates through two business
segments: Automation and Engineering. ENGlobal's Automation
segment provides services related to the design, integration and
implementation of advanced automation, information technology
process distributed control, instrumentation and process analytical
systems. The Engineering segment provides consulting services
for the development, management and execution of projects requiring
professional engineering, construction management, and related
support services and the fabrication operation. Within the
Engineering segment, ENGlobal's Government Services group provides
engineering, design, installation and operation and maintenance of
various government, public sector and international facilities, and
specializes in the turnkey installation and maintenance of
automation and instrumentation systems for the U.S. Defense
industry worldwide. Further information about the Company and
its businesses is available at www.ENGlobal.com.
Safe Harbor for Forward-Looking StatementsThe statements above
regarding the Company's expectations regarding its operations and
certain other matters discussed in this press release may
constitute forward-looking statements within the meaning of the
federal securities laws and are subject to risks and uncertainties
including, but not limited to: (1) the effect of economic downturns
and the volatility and level of oil and natural gas prices; (2) our
ability to retain existing customers and attract new customers; (3)
our ability to accurately estimate the overall risks, revenue or
costs on a contract; (4) the risk of providing services in excess
of original project scope without having an approved change order;
(5) our ability to execute our expansion into the modular solutions
market and to execute our updated business growth strategy to
position the Company as a leading provider of higher value
industrial automation and Industrial Internet of Things services to
its customer base; (6) our ability to attract and retain key
professional personnel; (7) our ability to fund our operations and
grow our business utilizing cash on hand, internally generated
funds and other working capital; (8) our ability to obtain
additional financing, including pursuant to a new credit facility,
when needed: (9) our dependence on one or a few customers; (10) the
risks of internal system failures of our information technology
systems, whether caused by us, third-party service providers,
intruders or hackers, computer viruses, natural disasters, power
shortages or terrorist attacks; (11) our ability to realize revenue
projected in our backlog and our ability to collect accounts
receivable and process accounts payable in a timely manner; (12)
the uncertainties related to the U.S. Government’s budgetary
process and their effects on our long-term U.S. Government
contracts; (13) operational and political risks in Russia and
Kazakhstan along the Caspian Sea; (14) the risk of unexpected
liability claims or poor safety performance; (15) our ability to
identify, consummate and integrate potential acquisitions; (16) our
reliance on third-party subcontractors and equipment manufacturers;
and (17) our ability to purchase shares under our stock purchase
program due to changes in stock price and other considerations.
Actual results and the timing of certain events could differ
materially from those projected in or contemplated by the
forward-looking statements due to a number of factors detailed from
time to time in ENGlobal's filings with the Securities and Exchange
Commission. In addition, reference is hereby made to cautionary
statements set forth in the Company's most recent reports on Form
10-K and 10-Q, and other SEC filings. Actual results and the timing
of certain events could differ materially from those projected in
or contemplated by the forward-looking statements due to a number
of factors detailed from time to time in ENGlobal's filings with
the Securities and Exchange Commission. In addition, reference is
hereby made to cautionary statements set forth in the Company's
most recent reports on Form 10-K and 10-Q, and other SEC
filings.
Click here to join our email list:
http://www.b2i.us/irpass.asp?BzID=702&to=ea&s=0
Contact:Mark Hess Phone: 281-878-4584E-mail: IR@ENGlobal.com
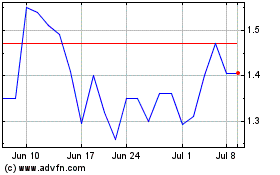
ENGlobal (NASDAQ:ENG)
Historical Stock Chart
From Mar 2024 to Apr 2024

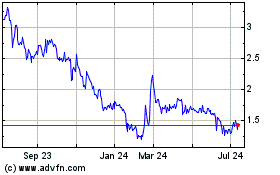
ENGlobal (NASDAQ:ENG)
Historical Stock Chart
From Apr 2023 to Apr 2024
