Exhibit 99.1
SANDSTORM GOLD LTD.
MANAGEMENT’S DISCUSSION AND ANALYSIS
Q3 / 2017
For The Period Ended September 30, 2017
This management’s discussion and analysis (“MD&A”) for Sandstorm Gold Ltd. and its subsidiary entities (“Sandstorm”, “Sandstorm Gold” or the “Company”) should be read in conjunction with the unaudited condensed consolidated interim financial statements of Sandstorm for the three and nine months ended September 30, 2017 and related notes thereto which have been prepared in accordance with International Financial Reporting Standards (“IFRS”) as issued by the International Accounting Standards Board (“IASB”), applicable to preparation of interim financial statements including International Accounting Standard 34—Interim Financial Reporting ("IAS 34"). Readers are encouraged to consult the Company’s audited consolidated financial statements for the year ended December 31, 2016 and the corresponding notes to the financial statements which are available on SEDAR at www.sedar.com. The information contained within this MD&A is current to November 1, 2017 and all figures are stated in U.S. dollars unless otherwise noted.
COMPANY HIGHLIGHTS
Operating Results
|
|
|
|
|
|
|
Attributable Gold Equivalent ounces sold (as defined hereinafter), for the three and nine months ended September 30, 2017 were 14,293 ounces and 42,601 ounces, respectively, compared with 12,588 and 36,486 ounces for the comparable periods in 2016.
|
|
|
|
|
|
|
|
Revenue for the three and nine months ended September 30, 2017 was $17.9 million and $52.8 million, respectively, compared with $16.8 million and $45.9 million for the comparable periods in 2016.
|
|
|
|
|
|
|
|
Cash flows from operating activities for the three and nine months ended September 30, 2017 were $11.9 million and $34.9 million, respectively, compared with $10.3 million and $28.9 million for the comparable periods in 2016.
|
|
|
|
|
|
|
|
Cost of sales, excluding depletion for the three and nine months ended September 30, 2017 were $3.5 million and $11.2 million, respectively, compared with $3.2 million and $9.5 million for the comparable periods in 2016.
|
|
|
|
|
|
|
|
Average cash costs1 for the three and nine months ended September 30, 2017 of $246 and $264 per Attributable Gold Equivalent ounce, respectively, compared with $255 and $261 per Attributable Gold Equivalent ounce for the comparable periods in 2016.
|
|
|
|
|
|
|
1.
|
Refer to section on non-IFRS and other measures of this MD&A.
|
New Anchor Asset
|
|
|
|
|
|
|
On July 3, 2017, Sandstorm completed its previously announced arrangement to acquire all the issued and ordinary share capital of Mariana Resources Ltd. (that Sandstorm did not already own). Under the terms of the arrangement and as consideration for the acquisition, the Company issued 32,685,228 common shares and paid an additional $47.3 million in cash. The transaction and the addition of the 30% Hot Maden interest to the Company’s portfolio of royalties provides for:
|
|
|
|
|
|
|
o
|
approximately 100% increase in estimated future production for only 19% dilution;
|
|
|
|
|
|
|
o
|
an anchor asset that is high-grade and low-cost with significant exploration upside;
|
|
|
|
|
|
|
o
|
a strong local partner with experience in exploring, developing, permitting and operating projects in Turkey; and
|
|
|
|
|
|
|
o
|
exploration properties in Côte d’Ivoire, Turkey, and Argentina. Sandstorm has begun the process to sell the exploration properties and expects to retain NSR royalties as well as equity in the spin-out.
|
Monetization of Securities
|
·
| |
On October 25, 2017, the Company agreed to sell $18.2 million in debt and equity securities of Trek Mining Inc. to Mr. Ross Beaty. The sale is conditional upon the closing of the announced business combination between Trek Mining, NewCastle Gold Ltd. and Anfield Gold Corp. The combined entity intends to operate under the name Equinox Gold Corp. and will be led by Mr. Ross Beaty as Chairman. The announced combination between Trek, NewCastle and Anfield is an encouraging development for Sandstorm shareholders. Sandstorm has existing royalties on properties that would be part of the Equinox Gold entity, and the combined company would be well financed to advance their assets into production. In addition, the monetization of a significant portion of Sandstorm’s debt and equity investments is a part of the Company’s strategy of selling non-core assets and using the capital raised to continue growing the stream and royalty portfolio. |
Gold Stream Amendment
|
·
| |
During the third quarter, the Company amended the Bachelor Lake gold stream with Metanor Resources Inc. Beginning October 1, 2017, Sandstorm will purchase 20% of the gold produced from the Bachelor Lake mine at an ongoing cost of $500 per ounce, until 12,000 ounces of gold have been purchased by the Company at which time the gold stream will convert into a 3.9% NSR royalty. As part of the amendment, Metanor has agreed it will sell a minimum of 1,500 ounces of gold to Sandstorm on a quarterly basis until the 12,000 ounce threshold has been reached. In consideration for the amendment, Sandstorm received: |
|
o
| |
a 3.9% NSR royalty on Metanor’s Barry project; and |
|
o
| |
$2.0 million in the common shares of Metanor. |
The amendment allows Sandstorm to maintain meaningful exposure to production from the Bachelor Lake mine while adding a royalty on the Barry project, an advanced exploration-stage asset located in the emerging Urban-Barry camp.
Newly Acquired Royalties
|
·
| |
Since September 2017, the Company has acquired 10 separate royalties on properties located in Peru, Botswana and South Africa. These royalties, which were purchased for an aggregate of $2.3 million, cover more than 1,000,000 hectares of property. |
Share Buy-Back Update
|
·
| |
Under the Company’s normal course issuer bid, the Company is able until April 4, 2018, to purchase approximately 7.6 million common shares. During the nine months ended September 30, 2017, the Company purchased approximately 3.3 million common shares. |
OVERVIEW
Sandstorm is a growth-focused company that seeks to acquire gold and other metals purchase agreements (“Gold Streams” or “Streams”) and royalties from companies that have advanced stage development projects or operating mines. In return for making upfront payments to acquire a Gold Stream, Sandstorm receives the right to purchase, at a fixed price per ounce or at a variable price based on spot, a percentage of a mine’s gold, silver, or other commodity ("Gold Equivalent") 1 production for the life of the mine. Sandstorm helps other companies in the resource industry grow their businesses, while acquiring attractive assets in the process. The Company is focused on acquiring Gold Streams and royalties from mines with low production costs, significant exploration potential and strong management teams. The Company currently has 171 Streams and net smelter returns royalties (“NSR”s), of which 20 of the underlying mines are producing.
|
|
|
|
1.
|
Refer to section on non-IFRS and other measures of this MD&A.
|
OUTLOOK
Based on the Company’s existing Gold Streams and NSRs, attributable Gold Equivalent production (individually and collectively referred to as “Attributable Gold Equivalent”) for 2017 is forecasted to be between 53,000 – 55,000 Attributable Gold Equivalent ounces. The Company is forecasting Attributable Gold Equivalent production of approximately 130,000 ounces per annum in 2022.
KEY PRODUCING ASSETS
|
|
|
|
Yamana Silver Stream
|
YAMANA GOLD INC.
|
The Company has a silver stream on Yamana Gold Inc.’s (“Yamana”) gold-silver Cerro Moro project, located in Santa Cruz, Argentina (the “Cerro Moro Project” or “Cerro Moro”) and an agreement to receive interim silver deliveries through 2018 from a number of Yamana’s currently operating mines.
Silver deliveries
Under the terms of the Yamana silver stream, Sandstorm has agreed to purchase, beginning January 1, 2019, for on-going per ounce cash payments equal to 30% of the spot price of silver, an amount of silver from Cerro Moro equal to 20% of the silver produced (up to an annual maximum of 1.2 million ounces of silver), until Yamana has delivered to Sandstorm 7.0 million ounces of silver; then 9% of the silver produced thereafter.
As part of the Yamana silver stream, through 2018, Sandstorm has also agreed to purchase, for on-going per ounce cash payments equal to 30% of the spot price of silver, an amount of silver from:
|
|
|
|
|
|
i.
|
the Minera Florida mine in Chile equal to 38% of the silver produced (up to an annual maximum of 200,000 ounces of silver); and
|
|
|
|
|
|
|
ii.
|
the Chapada mine in Brazil equal to 52% of the silver produced (up to an annual maximum of 100,000 ounces of silver).
|
Downside protection
If by January 1, 2019, the Cerro Moro processing facility has not averaged 80% of its daily nameplate production capacity over a 30-day period (the "Commencement of Production"), then Yamana´s producing El Peñon mine in Chile will provide a 24 month backstop until the Commencement of Production has begun. During the 24 month backstop, if applicable, Sandstorm will purchase, for on-going per ounce cash payments equal to 30% of the spot price of silver, an amount of silver equal to 16% of El Peñon´s silver production up to a maximum of 1.2 million ounces per annum.
About Cerro Moro
The Cerro Moro project is located approximately 70 kilometers southwest of the coastal port city of Puerto Deseado in the Santa Cruz province of Argentina. Cerro Moro contains a number of high grade epithermal gold and silver deposits, some of which will be mined via open pit and some via underground mining methods. The current plan indicates average annual production in the first three years of production of 150,000 ounces of gold and 7.2 million ounces of silver, with the life of mine annual production averaging approximately 130,000 ounces of gold and 6.4 million ounces of silver at a throughput of 1,000 tonnes per day.
|
|
|
|
|
|
»
|
Yamana recently reported that it is progressing well with respect to site construction activities and it anticipates the mechanical installation of the processing plant will be completed by the end of 2017.
|
|
|
|
|
|
|
»
|
Yamana’s 2017 exploration plan, which is anticipated to be part of a four year $30 million program, is aimed at expanding the Cerro Moro mineral resource. As part of that program, it was recently discovered that a 1,500 meter mineralized structure links the Esperanza and Escondida northwest mineral systems, with follow up drilling indicating that mineralization remains open along strike and down dip.
|
|
|
|
|
Chapada Copper Stream
|
YAMANA GOLD INC.
|
The Company has a copper stream on Yamana’s open pit gold-copper Chapada mine located 270 kilometers northwest of Brasília in Goiás State, Brazil (“Chapada” or the “Chapada Mine”). Under the terms of the Yamana copper stream, Sandstorm has agreed to purchase, for on-going per pound cash payments equal to 30% of the spot price of copper, an amount of copper from the Chapada Mine equal to:
|
|
|
|
|
|
i.
|
4.2% of the copper produced (up to an annual maximum of 3.9 million pounds of copper) until Yamana has delivered 39 million pounds of copper to Sandstorm (the “First Chapada Delivery Threshold”); then
|
|
|
|
|
|
|
ii.
|
3.0% of the copper produced until, on a cumulative basis, Yamana has delivered 50 million pounds of copper to Sandstorm (the “Second Chapada Delivery Threshold”); then
|
|
|
|
|
|
|
iii.
|
1.5% of the copper produced thereafter, for the life of the mine.
|
Downside protection
If Cerro Moro has not achieved the Commencement of Production and Sandstorm has not received cumulative pre-tax cash flow equal to $70 million from the Yamana silver stream, then the First Chapada Delivery Threshold and the Second Chapada Delivery Threshold will cease to be in effect and Sandstorm will continue to purchase 4.2% of Chapada’s payable copper production (up to an annual maximum of 3.9 million pounds of copper), until such time as Sandstorm has received cumulative pre-tax cash flow equal to $70 million, or Cerro Moro has achieved the Commencement of Production.
About Chapada
Chapada has been in production since 2007 and is a relatively low-cost South American operation. The ore is treated through a flotation plant with capacity of 22 million tonnes per annum. Yamana has benefitted from significant discoveries at Chapada in the past and in 2016 it announced an updated reserve statement which increased proven and probable copper mineral reserves to 3.25 billion pounds of copper contained in 559.5 million tonnes at 0.26% copper (see www.yamana.com for more information on this and recent drill results). Yamana recently announced positive results from its exploration program which is primarily focused on increasing mineral resources and mineral reserves by testing near mine and district targets including Baru, Suruca, Buriti and Formiga. Some of the highlights include: (i) the identification of a near surface, higher grade core to the Baru deposit that lies above Sucupira, a northeast to southwest trending mineral body immediately adjacent to the north wall of the main Chapada pit; (ii) at Suruca, current drilling has discovered a higher grade core to the mineralization that is at or above current life of mine grades with metallurgy similar to the Chapada deposit; (iii) a new copper-gold mineralization identified three kilometers from the Chapada mine, called the Buriti target which adds another near surface discovery at Chapada; and (iv) given the proximity of the Baru and Sucupira deposits to plant infrastructure, studies are underway to review a larger open pit scenario that would include both these deposits.
|
|
|
|
Diavik Diamond Royalty
|
RIO TINTO PLC
|
The Company has a 1% gross proceeds royalty based on the production from the Diavik mine located in Lac de Gras, Northwest Territories, Canada (“Diavik” or the “Diavik Mine”) which is operated by Rio Tinto PLC (“Rio Tinto”).
The Diavik Mine is Canada’s largest diamond mine. The mine began producing diamonds in January 2003, and has since produced more than 100 million carats from three kimberlite pipes (A154 South, A154 North, and A418). Rio Tinto has approved the development of an open pit mine on a fourth pipe (A21) which is targeted for production in 2018. Recent public announcements have indicated that the development of A21 pipe continues to progress according to plan.
|
|
|
|
|
|
»
|
A year end reserve was filed for the Diavik Mine which when compared to the 2015 technical report, adds approximately 6.7 million carats to the mineral reserves. For more information refer to www.ddcorp.ca.
|
|
|
|
|
|
|
»
|
In accordance with the project plan, the completion of the A21 dike and the start of dewatering are expected by the end of 2017.
|
|
|
|
|
Santa Elena Gold Stream
|
FIRST MAJESTIC SILVER CORP.
|
The Company has a Gold Stream to purchase 20% of the life of mine gold produced from First Majestic Silver Corp.’s (“First Majestic”) open-pit and underground Santa Elena mine, located in Mexico (the “Santa Elena Mine”), for a per ounce cash payment equal to the lesser of $450 and the then prevailing market price of gold.
The Santa Elena Mine was successfully transitioned from an open pit heap leach operation to an underground mining and milling operation and commercial production for the 3,000 tonne per day processing plant was declared in 2014.
|
|
|
|
|
|
»
|
First Majestic recently announced that it had successfully completed the connection of the San Salvador ramp to the Main vein which has resulted in a reduction in haulage bottlenecks and has improved mine planning logistics. In addition, the new ramp is expected to support future exploration activities around the Tortuga vein.
|
|
|
|
|
Black Fox Gold Stream
|
MCEWEN MINING INC.
|
The Company has a Gold Stream to purchase 8% of the life of mine gold produced from McEwen Mining Inc.’s (“McEwen”) open pit and underground Black Fox mine, located in Ontario, Canada (the “Black Fox Mine”), and 6.3% of the life of mine gold produced from McEwen’s Black Fox Extension, which includes a portion of McEwen’s Pike River concessions, for a per ounce cash payment equal to the lesser of $531 and the then prevailing market price of gold.
The Black Fox Mine began operating as an open pit mine in 2009 (depleted in 2015) and transitioned to underground operations in 2011. On October 6, 2017, McEwen completed its previously announced acquisition of the Black Fox Mine from the previous owner, Primero Mining Corp.
|
|
|
|
Bachelor Lake Gold Stream
|
METANOR RESOURCES INC.
|
On September 29, 2017, the Company amended its Gold Stream with Metanor Resources Inc (“Metanor”). Beginning October 1, 2017, Sandstorm will purchase 20% of the gold produced from Metanor’s Bachelor Lake gold mine located in Quebec, Canada (the “Bachelor Lake Mine”), for a per ounce cash payment equal to the lesser of $500 and the then prevailing market price of gold, until 12,000 ounces of gold have been purchased by the Company at which time the Gold Stream will convert into a 3.9% NSR royalty. As part of the amendment, Metanor has agreed it will sell a minimum of 1,500 ounces of gold to Sandstorm on a quarterly basis until the 12,000 ounce threshold has been reached. Under the previous Gold Stream, there were no requirements for minimum deliveries nor was there a subsequent conversion of the Gold Stream into a NSR royalty. In consideration for entering into the amendment, Sandstorm received:
|
o
| |
a 3.9% NSR royalty on Metanor’s Barry project; and |
|
o
| |
$2.0 million in the common shares of Metanor. |
Metanor may elect to reduce the 3.9% NSR royalty on the Bachelor Lake or Barry projects by making a $2.0 million payment to Sandstorm in each case (the “Purchase Option”). Upon exercising either of the Purchase Options, the respective Sandstorm NSR royalty will decrease to 1.8%. In addition to the Gold Stream, Sandstorm has an already existing 1% NSR royalty on the Bachelor Lake gold mine, which remains unaffected by the amendment. In connection with the amendment, the Company recognized a gain of $3.0 million during the three months ended September 30, 2017.
The Bachelor Lake Mine is an underground mining operation with an operating mill and surface infrastructure, which began production in early 2013. The amendment not only allows Sandstorm to maintain meaningful exposure to the production from the Bachelor Lake mine, but it also adds a royalty on the Barry project, which is an advanced exploration-stage asset located in the emerging Urban-Barry camp. Metanor is currently conducting exploration drilling at the Barry project and has plans to complete a pre-feasibility study as it continues the permitting process.
|
The Bachelor Lake Mine is an underground mining operation with an operating mill and surface infrastructure, which began production in early 2013.
|
|
|
|
|
|
|
|
|
|
|
Karma Gold Stream
|
ENDEAVOUR MINING CORP.
|
The Company has a Gold Stream which entitles it to purchase 25,000 ounces of gold over a five year period and thereafter 1.625% of the gold produced from Endeavour Mining Corporation’s (“Endeavour”) open-pit heap leach Karma gold mine located in Burkina Faso, West Africa (“Karma” or the “Karma Mine”) for on-going per ounce cash payment equal to 20% of the spot price of the gold.
The Gold Stream, which on a gross basis requires Endeavour to deliver 100,000 ounces of gold over a five year period starting March 31, 2016 and thereafter 6.5% of the equivalent gold production at the Karma Mine, is syndicated 75% and 25% between Franco-Nevada Corp. and Sandstorm, respectively (together the “Stream Syndicate”).
The Karma Mine has five defined mineral deposits that make up the Karma project. Based on recent drilling, Endeavour has extended the mine life beyond 10 years.
|
|
|
|
|
|
»
|
A 60,000 meter exploration drilling program, at Kao North, was completed in 2016, which confirmed the continuity of the previous inferred resource, identified resources amenable to heap leach processing and converted mineral resources into mineral reserves. For more information refer to www.endeavourmining.com .
|
|
|
|
|
|
|
»
|
Endeavour has a $4 million exploration program to drill near-mill targets such as Rambo West and Yabonsgo.
|
|
|
|
|
Bracemac-McLeod Royalty
|
GLENCORE PLC
|
Sandstorm has a 3% NSR based on 100% of the production from the Bracemac-McLeod property located in Matagami, Quebec, Canada (“Bracemac-McLeod” or the “Bracemac-McLeod Mine”) which is owned and operated by a subsidiary of Glencore plc (“Glencore”).
The Bracemac-McLeod Mine is a high grade volcanogenic massive sulphide deposit located in the historic and prolific Matagami mining district of Quebec. Continuous mining and milling operations have been active in the Matagami district for over fifty years with ten previously operating mines and one other currently producing mine. The Bracemac-McLeod Mine began initial production in the second half of 2013.
|
|
|
|
Ming Gold Stream
|
RAMBLER METALS & MINING PLC
|
The Company has a Gold Stream to purchase approximately 25% of the first 175,000 ounces of gold produced and 12% of the life of mine gold produced thereafter, from Rambler Metals & Mining PLC’s (“Rambler”) Ming Copper-Gold mine, located in Newfoundland, Canada (the “Ming Mine”). There are no ongoing per ounce payments required by Sandstorm in respect of the Ming Mine Gold Stream. In the event that the metallurgical recoveries of gold at the Ming Mine are below 85%, the percentage of gold that Sandstorm shall be entitled to purchase shall be increased proportionally. Based on 2016 metallurgical recoveries, Sandstorm’s 2017 gold purchase entitlement was adjusted to 32%.
|
|
|
|
|
|
»
|
Rambler has begun a surface diamond drilling program targeting the depth extension of both the Lower Footwall Zone and the high grade Ming Massive Sulphides. For more information refer to www.ramblermines.com
|
OTHER PRODUCING ASSETS
|
|
|
|
Emigrant Springs
|
NEWMONT MINING CORP.
|
The Company has a 1.5% NSR on the Emigrant Springs mine (the “Emigrant Springs Mine”) which is located in the Carlin Trend in Nevada, U.S.A. and is owned and operated by Newmont Mining Corp. (“Newmont”). The Emigrant Springs Mine is an open pit, heap leach operation that has been in production since the third quarter of 2012.
|
|
|
|
Gualcamayo Royalty
|
YAMANA GOLD INC.
|
The Company has a 1% NSR on the Gualcamayo gold mine (the “Gualcamayo Mine”) which is located in San Juan province, Argentina and owned and operated by Yamana. The Gualcamayo Mine is an open pit, heap leach operation encompassing three substantial zones of gold mineralization. Yamana recently announced exploration success in near pit targets of Cerro Condor and Potenciales which, Yamana believes, provides support for extending the life of the open pit.
|
|
|
|
Mine Waste Solutions Royalty
|
ANGLOGOLD ASHANTI LTD.
|
The Company has a 1% NSR on the gold produced from Mine Waste Solutions tailings recovery operation (“MWS”) which is located near Stilfontein, South Africa, and is owned and operated by AngloGold Ashanti Ltd. (“AngloGold”). MWS is a gold and uranium tailings recovery operation. The operation re-processes multiple tailings dumps in the area through three production modules, the last of which was commissioned in 2011.
|
|
|
|
San Andres Royalty
|
AURA MINERALS INC.
|
The Company has a 1.5% NSR on the San Andres mine (the “San Andres Mine”) which is located in La Únion, Honduras and is owned and operated by Aura Minerals Inc. (“Aura Minerals”). The San Andres Mine is an open pit, heap leach operation. The mine has been in production since 1983 and has well-developed infrastructure, which includes power and water supply, warehouses, maintenance facilities, assay laboratory and on-site camp facilities.
DEVELOPMENT ASSETS
|
|
|
|
Hot Maden
|
LYDIA MADENCILIK A.S
|
The Company has a 30% interest and a 2% NSR on the Hot Maden gold-copper project which is located in the Artvin Province, northeastern Turkey (the “Hot Maden Project” or “Hot Maden”). The project is operated and co-owned by a Turkish partner, Lidya Madencilik Sanayi ve Ticaret A.S. (“Lydia”), which owns the remaining 70% interest in the project. Lydia is an experienced Turkish company who is also a joint-venture partner with Alacer Gold Corp. on the producing Çöpler mine in Turkey. The Hot Maden Project is envisaged as a conventional underground mine and processing facility producing concentrates without the use of cyanide.
On July 3, 2017, Sandstorm completed its previously announced arrangement to acquire all the issued and ordinary share capital of Mariana Resources Ltd. (“Mariana”) (that Sandstorm did not already own) (the “Arrangement”). Under the terms of the Arrangement and as consideration for the acquisition, the Company issued 32,685,228 common shares and paid an additional $47.3 million in cash. The highlights of the transaction and the addition of the 30% Hot Maden interest to the Company’s portfolio include:
|
|
|
|
|
|
|
100% increase in expected future production for 19% dilution;
|
|
|
|
|
|
|
o
|
Hot Maden is an anchor asset that is expected to increase the Company’s attributable gold equivalent ounces to approximately 130,000 in 2022.
|
|
|
|
|
|
|
|
Hot Maden is a high-grade, low-cost asset with significant exploration upside;
|
|
|
|
|
|
|
o
|
The Preliminary Economic Assessment (effective date of March 1, 2017) demonstrated robust estimated economics with estimated all-in-sustaining costs of less than $400 per gold equivalent ounce. The high-grade nature of the orebody and the wide intercepts of mineralization provide the potential for low-cost mining methods.
|
|
|
|
|
|
|
o
|
Total land package is 74 square kilometers in size with the current focus being a 7.0 kilometer long north-south alteration zone. The majority of the exploration drilling has been within a 1.0 kilometer strike length of this alteration zone with several exploration targets identified along strike and parallel to the identified orebody.
|
|
|
|
|
|
|
|
Majority operator Lydia is a strong local partner with experience exploring, developing, permitting and operating projects in Turkey.
|
|
|
|
|
|
|
o
|
Lidya is part of a large Turkish conglomerate called Çalik Holding and is currently partnered with Alacer Gold Corp. on several projects in Turkey including the producing Çöpler mine and the development-stage Gediktepe and Kartaltepe projects.
|
|
|
|
|
|
|
|
Acquisition of Mariana includes exploration properties in Côte d’Ivoire, Turkey, and Argentina. Sandstorm has begun the process to sell the exploration properties and expects to retain NSR royalties as well as equity in the spin-out.
|
|
|
|
|
Aurizona Gold Royalty
|
TREK MINING INC.
|
The Company has a 3% – 5% sliding scale NSR on the production from Trek Mining Inc.’s (“Trek”) open-pit Aurizona mine, located in Brazil (“Aurizona” or the “Aurizona Mine”). At gold prices less than or equal to $1,500 per ounce, the royalty is a 3% NSR. In addition, Sandstorm holds a 2% NSR on Trek’s 190,073 hectares of greenfields exploration ground. At any time prior to the commencement of commercial production, Trek has the ability to purchase one-half of the greenfields NSR for a cash payment of $10 million.
On July 31, 2017, Trek released results of a feasibility study including proven and probable mineral reserves of 971,000 ounces of gold (contained in 19.8 million tonnes at 1.5 grams per tonne gold with a cut-off grade of 0.4 grams per tonne from Boa Esperanza and 0.6 grams per tonne from Piaba) with expected annual production of 136,000 ounces. Trek recently announced that it had intersected two new zones of gold mineralization at the near mine target of Genipapo. In addition, Trek has commenced a second phase of exploration drilling at Aurizona with five diamond drill rigs working to complete a 12,000 meter drill campaign. The focus of the campaign is to test several near mine targets including follow-up drilling at Genipapo and additional infill drilling at Piaba West. For more information refer to www.trekmining.com . Trek also has an exploration agreement with AngloGold covering the greenfields exploration property. Sandstorm holds a right of first refusal on any future streams or royalties on the Aurizona project and greenfields property.
On March 31, 2017, Luna Gold Inc. (“Luna”) completed its previously announced merger with JDL Gold Corp creating Trek, a new multi-asset company with over C$110 million in cash. Concurrent with the closing of the transaction, the term debt facility that was owed to Sandstorm, in the amount of $20 million plus accrued interest, was settled in the equity of Trek. The Company recognized a gain of $1.8 million on the settlement of the debt. On October 25, 2017, Trek announced that it had entered into an agreement to acquire NewCastle Gold Ltd. and Anfield Gold Corp. The combined entity intends to operate under the name Equinox Gold Corp. and will be led by Mr. Ross Beaty as Chairman. The announced combination is an encouraging development for Sandstorm shareholders as Sandstorm has existing royalties on properties that would be part of the Equinox Gold Corp entity and the combined company would be well financed to advance their assets into production. In conjunction with the transaction, Sandstorm agreed to sell $18.2 million in debt and equity securities of Trek to Mr. Ross Beaty. The sale is conditional upon the closing of the announced business combination between Trek, NewCastle Gold Ltd. and Anfield Gold Corp. The monetization of a significant portion of Sandstorm’s debt and equity investments is a part of the Company’s strategy of selling non-core assets and using the capital raised to continue growing the stream and royalty portfolio.
|
|
|
|
Hugo North Extension & Heruga Gold Stream
|
ENTRÉE RESOURCES LTD
|
The Company has a Gold Stream with Entrée Resources Ltd. (“Entrée”) to purchase an amount equal to 5.62% and 4.26% of the gold and silver by-products produced from the Hugo North Extension and Heruga deposits located in Mongolia, (the “Hugo North Extension” and “Heruga”, respectively) for per ounce cash payments equal to the lesser of $220 per ounce of gold and $5 per ounce of silver and the then prevailing market price of gold and silver, respectively. Additionally, Sandstorm has a copper stream to purchase an amount equal to 0.42% of the copper produced from Hugo North Extension and Heruga for per pound cash payments equal to the lesser of $0.50 per pound of copper and the then prevailing market price of copper.
The Company is not required to contribute any further capital, exploration, or operating expenditures to Entrée.
The Hugo North Extension is a rich copper-gold porphyry deposit and Heruga is a copper-gold-molybdenum porphyry deposit. Both projects are located in the South Gobi desert of Mongolia, approximately 570 kilometers south of the capital city of Ulaanbaatar and 80 kilometers north of the border with China. The Hugo North Extension and Heruga are part of the Oyu Tolgoi mining complex and are managed by Oyu Tolgoi LLC, a subsidiary of Turquoise Hill Resources Ltd. (“Turquoise Hill”) and the Government of Mongolia, and its project manager Rio Tinto PLC. Entrée retains a 20% interest in the resource deposits of the Hugo North Extension and Heruga.
Entrée recently announced that a 43-101 technical report relating to its interests in the Hugo North Extension and Heruga is underway and expected to be released in 2018. Once completed, the report will allow Entrée to discuss preliminary economics for the potential future phases of the Oyu Tolgoi mine, beyond Lift 1, including Lift 2 and Heruga.
|
|
|
|
Hackett River Royalty
|
GLENCORE PLC
|
The Company has a 2% NSR on the Hackett River property located in Nunavut, Canada (the “Hackett River Project” or “Hackett River”) which is owned by a subsidiary of Glencore.
Hackett River is a silver-rich volcanogenic massive sulphide deposit and is one of the largest undeveloped projects of its kind. The property contains four massive sulphide bodies that occur over a 6.6 kilometer strike length. A preliminary economic assessment updated in 2010 evaluated a possible large-scale open pit and underground operation, processing up to 17,000 tonnes per day. The most recent technical report, completed in 2013, reported 25.0 million tonnes of indicated resources containing 4.2% zinc and 130.0 grams per tonne silver plus 57.0 million tonnes of inferred resources with 3.0% zinc and 100.0 grams per tonne silver. For more information refer to the technical reports dated July 26, 2010 and July 31, 2013 under Sabina Gold & Silver Corp’s profile on www.sedar.com. Glencore has recently disclosed that a pre-feasibility study is currently underway and that they are revisiting both the mining methods and boundaries between open pit and underground.
|
|
|
|
Lobo-Marte Royalty
|
KINROSS GOLD CORP.
|
The Company has a 1.05% NSR on production from the Lobo-Marte project located in the Maricunga gold district of Chile (the “Lobo-Marte Project” or “Lobo-Marte”) which is owned by Kinross Gold Corp. (“Kinross”).
Kinross completed a pre-feasibility study at Lobo-Marte that contemplated an open-pit/ heap-leach operation. As a result of changes in the plan of operations and other factors, Kinross withdrew its previously submitted permit application. Future development and operations at Lobo-Marte will require the re-initiation of the permitting process. For more information refer to www.kinross.com.
|
|
|
|
Agi Dagi & Kirazli Royalty
|
ALAMOS GOLD INC.
|
The Company has a $10 per ounce royalty based on the production from the Agi Dagi and the Kirazli gold development projects located in the Çanakkale Province of northwestern Turkey (“Agi Dagi” and “Kirazli”, respectively) which are both owned by Alamos Gold Inc. (“Alamos Gold”). The royalty is payable by Newmont and is subject to a maximum of 600,000 ounces from Agi Dagi and a maximum of 250,000 ounces from Kirazli.
A 2017 feasibility study on Agi Dagi and a 2017 feasibility study on Kirazli contemplated both projects as stand-alone open-pit, heap-leach operations. Under the respective studies, Agi Dagi is expected to produce an average of 177,600 ounces of gold per year over a 6 year mine life while Kirazli is expected to produce an average of 104,000 ounces of gold per year over a 5 year mine life. For more information refer to www.alamosgold.com.
|
|
|
|
Prairie Creek Royalty
|
CANADIAN ZINC CORPORATION
|
The Company has a 1.2% NSR on the Prairie Creek project (the “Prairie Creek Project”) located in the Northwest Territories, Canada and owned by Canadian Zinc Corporation (“Canadian Zinc”). The Prairie Creek Project is a zinc, silver and lead project that is 100%-owned by Canadian Zinc and based on a recently announced feasibility study has a proven and probable mineral reserve of 8.1 million tonnes containing 8.6% zinc, 124.2 grams per tonne silver and 8.1% lead. Canadian Zinc recently announced that the Mackenzie Valley Environmental Impact Review Board had recommended approval for the proposed all season road at the Prairie Creek Project. Development of the all season road will enable the transportation of concentrates and supplies throughout the year. For more information, refer to www.canadianzinc.com.
|
|
|
|
Mt. Hamilton Royalty
|
WATERTON PRECIOUS METALS FUND II CAYMAN, LP
|
The Company has a 2.4% NSR on the Mt. Hamilton gold project (the "Mt. Hamilton Project"). The Mt. Hamilton Project is located in White Pine County, Nevada, U.S.A. and is owned by Waterton Precious Metals Fund II Cayman, LP (“Waterton”).
Sandstorm holds a right of first refusal on any future royalty or gold stream financing for the Mt. Hamilton Project.
IMPAIRMENT
While assessing whether any indications of impairment exist for mineral interests and royalties, consideration is given to both external and internal sources of information. A reduction in the mineral resource estimate for the Coringa gold project prompted the Company to evaluate the carrying value of its royalty investment. During the three months ended June 30, 2017 and as a result of this review, the Company recorded an impairment charge of $4.5 million.
OTHER
Under the Company’s normal course issuer bid (“NCIB”), the Company is able until April 4, 2018, to purchase up to 7.6 million common shares. The NCIB provides the Company with the option to purchase its common shares from time to time. During the nine months ended September 30, 2017 and pursuant to the NCIB, the Company purchased and cancelled approximately 3.3 million common shares.
On January 26, 2017, Orezone Gold Corporation (“Orezone”) exercised its option to repurchase the royalty on the Bomboré gold project for $3.6 million, representing a 20% premium to the original upfront payment. Sandstorm retains a right of first refusal on any future stream or royalty financings related to the Bomboré gold project.
SUMMARY OF QUARTERLY RESULTS
Quarters Ended
|
|
|
|
|
|
|
|
|
|
|
|
|
|
|
|
|
|
|
|
|
|
|
|
|
|
|
|
|
In $000s
|
|
Sep. 30, 2017
|
|
Jun. 30, 2017
|
|
Mar. 31, 2017
|
|
Dec. 31, 2016
|
|
Total revenue
|
|
$
|
17,939
|
|
$
|
16,066
|
|
$
|
18,824
|
|
$
|
16,463
|
|
Attributable Gold Equivalent ounces sold 1
|
|
|
14,293
|
|
|
12,750
|
|
|
15,558
|
|
|
13,245
|
|
Sales
|
|
$
|
11,534
|
|
$
|
11,835
|
|
$
|
12,861
|
|
$
|
10,970
|
|
Royalty revenue
|
|
|
6,405
|
|
|
4,231
|
|
|
5,963
|
|
|
5,493
|
|
Average realized gold price per attributable ounce 1
|
|
|
1,255
|
|
|
1,260
|
|
|
1,210
|
|
|
1,243
|
|
Average cash cost per attributable ounce 1
|
|
|
246
|
|
|
290
|
|
|
258
|
|
|
250
|
|
Cash flows from operating activities
|
|
|
11,864
|
|
|
11,112
|
|
|
11,938
|
|
|
10,058
|
|
Net income (loss)
|
|
|
4,773
|
|
|
(1,909)
|
|
|
6,964
|
|
|
(19)
|
|
Basic income (loss) per share
|
|
|
0.03
|
|
|
(0.01)
|
|
|
0.05
|
|
|
(0.00)
|
|
Diluted income (loss) per share
|
|
|
0.02
|
|
|
(0.01)
|
|
|
0.04
|
|
|
(0.00)
|
|
Total assets
|
|
|
667,185
|
|
|
545,557
|
|
|
550,342
|
|
|
534,882
|
|
Total long-term liabilities
|
|
|
2,915
|
|
|
2,969
|
|
|
3,197
|
|
|
3,288
|
|
|
|
|
|
|
|
|
|
|
|
|
|
|
|
|
|
|
|
|
|
|
|
|
|
|
|
|
|
In $000s
|
|
Sep. 30, 2016
|
|
Jun. 30, 2016
|
|
Mar. 31, 2016
|
|
Dec. 31, 2015
|
|
Total revenue
|
|
$
|
16,815
|
|
$
|
15,709
|
|
$
|
13,384
|
|
$
|
9,863
|
|
Attributable Gold Equivalent ounces sold 1
|
|
|
12,588
|
|
|
12,517
|
|
|
11,381
|
|
|
8,951
|
|
Sales
|
|
$
|
11,302
|
|
$
|
10,858
|
|
$
|
8,504
|
|
$
|
6,604
|
|
Royalty revenue
|
|
|
5,513
|
|
|
4,851
|
|
|
4,880
|
|
|
3,259
|
|
Average realized gold price per attributable ounce 1
|
|
|
1,336
|
|
|
1,255
|
|
|
1,176
|
|
|
1,102
|
|
Average cash cost per attributable ounce 1
|
|
|
255
|
|
|
261
|
|
|
267
|
|
|
258
|
|
Cash flows from operating activities
|
|
|
10,313
|
|
|
8,935
|
|
|
9,685
|
|
|
4,987
|
|
Net income (loss)
|
|
|
6,915
|
|
|
5,199
|
|
|
13,159
|
|
|
(24,960)
|
|
Basic income (loss) per share
|
|
|
0.05
|
|
|
0.04
|
|
|
0.10
|
|
|
(0.20)
|
|
Diluted income (loss) per share
|
|
|
0.04
|
|
|
0.04
|
|
|
0.10
|
|
|
(0.20)
|
|
Total assets
|
|
|
540,419
|
|
|
525,353
|
|
|
531,160
|
|
|
496,873
|
|
Total long-term liabilities
|
|
|
3,320
|
|
|
62,854
|
|
|
80,130
|
|
|
86,779
|
|
|
|
|
1.
|
Refer to section on non-IFRS and other measures of this MD&A.
|
|
|
|
Attributable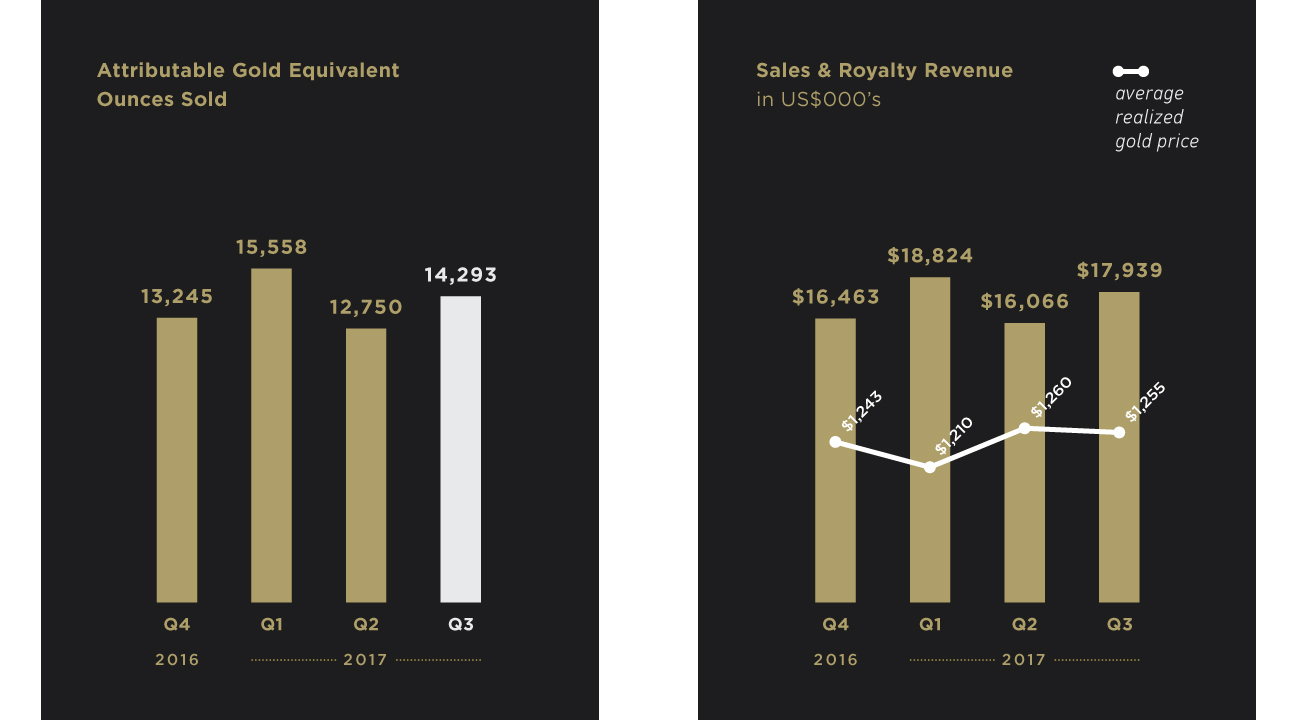 Gold Equivalent Ounces Sold Sales & Royalty Revenue in US$000’s average realized gold price 13,245 15,558 12,750 14,293 Q4 Q1 Q2 Q3 2016 1027 $16,463 $18,824 $16,066 $17,939 $1,243 $1,210 $1,260 $1,255 Gold Equivalent Ounces Sold Sales & Royalty Revenue in US$000’s average realized gold price 13,245 15,558 12,750 14,293 Q4 Q1 Q2 Q3 2016 1027 $16,463 $18,824 $16,066 $17,939 $1,243 $1,210 $1,260 $1,255
|
Changes in sales, net income and cash flow from operating activities from quarter to quarter are affected primarily by fluctuations in production at the mines, the timing of shipments, changes in the price of commodities, as well as acquisitions of Streams and royalty agreements and the commencement of operations of mines under construction. For more information refer to the quarterly commentary discussed below.
The Company’s operating segments for the three months ended
September 30, 2017 are summarized in the table below:
|
|
|
|
|
|
|
|
|
|
|
|
|
|
|
|
|
|
|
|
|
|
|
In 000s
|
|
Attributable Gold Equivalent ounces sold
|
|
Sales and
royalty
revenues
|
|
Cost of sales, excluding depletion
|
|
Depletion expense
|
|
Impairment of mineral, royalty
and other interests
|
|
Income (loss)
before taxes
|
|
Cash flow
from operating
activities
|
|
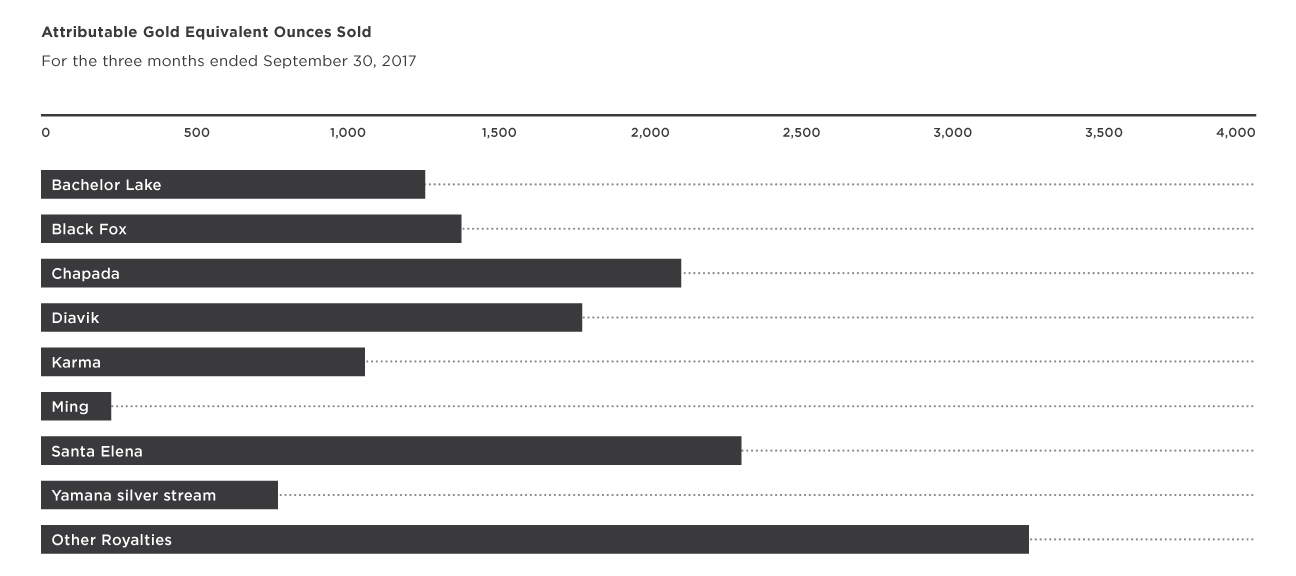
Bachelor Lake
|
|
1,264
|
|
$
|
1,578
|
|
$
|
599
|
|
$
|
973
|
|
$
|
-
|
|
$
|
6
|
|
$
|
861
|
|
Black Fox
|
|
1,383
|
|
|
1,716
|
|
|
735
|
|
|
653
|
|
|
-
|
|
|
328
|
|
|
1,115
|
|
Chapada
|
|
2,107
|
|
|
2,644
|
|
|
774
|
|
|
931
|
|
|
-
|
|
|
939
|
|
|
1,870
|
|
Diavik
|
|
1,785
|
|
|
2,240
|
|
|
-
|
|
|
1,244
|
|
|
-
|
|
|
996
|
|
|
1,840
|
|
Karma
|
|
1,068
|
|
|
1,351
|
|
|
268
|
|
|
671
|
|
|
-
|
|
|
412
|
|
|
974
|
|
Ming
|
|
237
|
|
|
291
|
|
|
-
|
|
|
125
|
|
|
-
|
|
|
166
|
|
|
291
|
|
Santa Elena
|
|
2,307
|
|
|
2,922
|
|
|
840
|
|
|
265
|
|
|
-
|
|
|
1,817
|
|
|
2,013
|
|
Yamana silver stream
|
|
781
|
|
|
981
|
|
|
285
|
|
|
561
|
|
|
-
|
|
|
135
|
|
|
695
|
|
Other Royalties
|
|
3,253
|
|
|
4,082
|
|
|
-
|
|
|
1,704
|
|
|
-
|
|
|
2,378
|
|
|
3,818
|
|
Other
|
|
108
|
|
|
134
|
|
|
11
|
|
|
42
|
|
|
-
|
|
|
81
|
|
|
124
|
|
Corporate
|
|
-
|
|
|
-
|
|
|
-
|
|
|
-
|
|
|
-
|
|
|
(464)
|
|
|
(1,737)
|
|
Consolidated
|
|
14,293
|
|
$
|
17,939
|
|
$
|
3,512
|
|
$
|
7,169
|
|
$
|
-
|
|
$
|
6,794
|
|
$
|
11,864
|
The Company’s operating segments for the three months ended
September 30, 2016 are summarized in the table below:
|
|
|
|
|
|
|
|
|
|
|
|
|
|
|
|
|
|
|
|
|
|
|
In 000s
|
|
Attributable Gold Equivalent ounces sold
|
|
Sales and
royalty
revenues
|
|
Cost of sales,
excluding depletion
|
|
Depletion expense
|
|
Impairment of mineral, royalty
and other interests
|
|
Income (loss)
before taxes
|
|
Cash flow
from operating activities
|
|
Bachelor Lake
|
|
1,988
|
|
$
|
2,657
|
|
$
|
958
|
|
$
|
1,023
|
|
$
|
-
|
|
$
|
676
|
|
$
|
1,898
|
|
Black Fox
|
|
983
|
|
|
1,314
|
|
|
515
|
|
|
439
|
|
|
-
|
|
|
360
|
|
|
578
|
|
Chapada
|
|
1,230
|
|
|
1,643
|
|
|
489
|
|
|
707
|
|
|
-
|
|
|
447
|
|
|
1,154
|
|
Diavik
|
|
1,175
|
|
|
1,570
|
|
|
-
|
|
|
1,070
|
|
|
-
|
|
|
500
|
|
|
1,670
|
|
Karma
|
|
1,250
|
|
|
1,669
|
|
|
333
|
|
|
785
|
|
|
-
|
|
|
551
|
|
|
1,336
|
|
Ming
|
|
598
|
|
|
802
|
|
|
-
|
|
|
282
|
|
|
-
|
|
|
520
|
|
|
802
|
|
Santa Elena
|
|
1,951
|
|
|
2,601
|
|
|
704
|
|
|
359
|
|
|
-
|
|
|
1,538
|
|
|
1,897
|
|
Yamana silver stream
|
|
533
|
|
|
712
|
|
|
212
|
|
|
306
|
|
|
-
|
|
|
194
|
|
|
500
|
|
Other Royalties
|
|
2,880
|
|
|
3,847
|
|
|
-
|
|
|
2,354
|
|
|
1,139
|
|
|
354
|
|
|
3,595
|
|
Corporate
|
|
-
|
|
|
-
|
|
|
-
|
|
|
-
|
|
|
-
|
|
|
3,282
|
|
|
(3,117)
|
|
Consolidated
|
|
12,588
|
|
$
|
16,815
|
|
$
|
3,211
|
|
$
|
7,325
|
|
$
|
1,139
|
|
$
|
8,422
|
|
$
|
10,313
|
|
|
|
Attributable Gold Equivalent Ounces Sold For the three months ended September 30, 2017 0 500 1,000 1,500 2,000 2,500 3,000 3,500 4,000 Bachelor Lak Black Fox Chapada Diavik Karma Min Santa Elena Yamana Silver stream Other Royalties
|
|
|
|
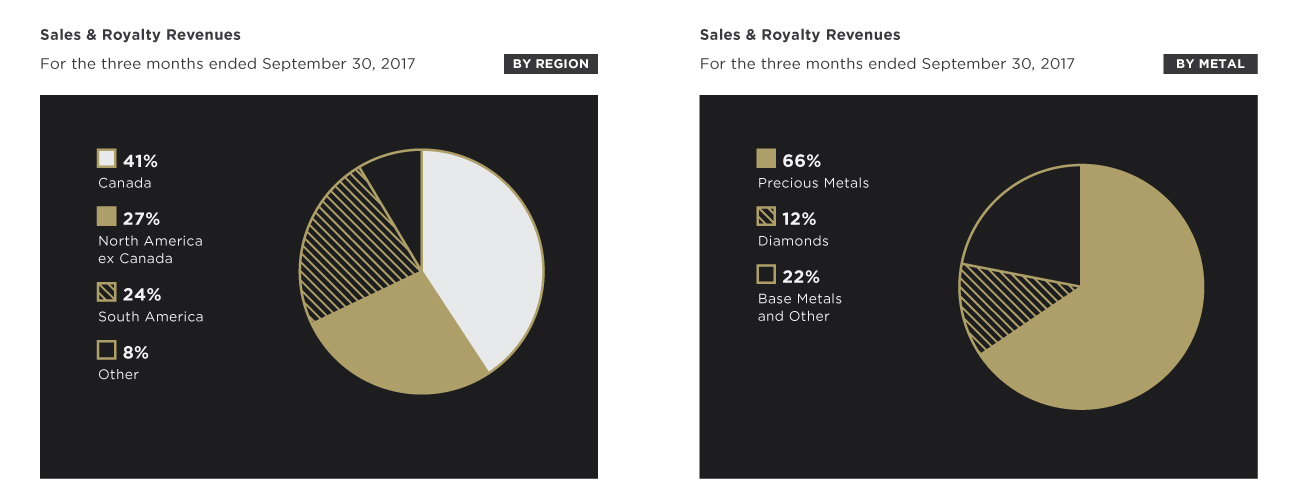
Sales & Royalty Revenues For the three months ended September 30, 2017 By Region By Metal 41% Canada 27% North America ex Canada 24% South America 8% Other 66% Precious Metals 12% Diamonds 22% Base Metals and Other
|
THREE MONTHS ENDED SEPTEMBER 30, 2017
COMPARED TO THE THREE MONTHS ENDED SEPTEMBER 30, 2016
For the three months ended September 30, 2017, net income and cash flow from operating activities were $4.8 million and $11.9 million, respectively, compared with net income and cash flow from operating activities of $6.9 million and $10.3 million for the comparable period in 2016. The change is attributable to a combination of factors including:
|
NSR
|
|
|
|
A $3.4 million gain primarily resulting from the Bachelor Lake Gold Stream amendment for which Sandstorm received consideration consisting of $2.0 million in the common shares of Metanor and a 3.9% NSR on Metanor’s Barry project;
|
|
|
|
|
|
|
|
An increase of $0.8 million in administration expenses partly driven by the acquisition of Mariana and related operating costs. The Company expects these costs to decline as it executes on its strategy of selling the exploration properties which were acquired as part of the Mariana acquisition; and
|
|
|
|
|
|
|
|
|
|
|
|
Certain items recognized during the three months ended September 30, 2016 did not occur during the three months ended September 30, 2017 including a $5.8 million gain on the revaluation of the Company’s investments largely driven by the change in fair value of the Trek convertible debenture and Trek warrants; partially offset by a $1.1 million non-cash impairment charge relating to certain of the Company’s mineral interests.
|
For the three months ended September 30, 2017, revenue was $17.9 million compared with $16.8 million for the comparable period in 2016. The increase is largely attributed to a number of factors including:
|
|
|
|
|
|
|
14% increase in the number of Attributable Gold Equivalent ounces sold consisting of:
|
|
|
|
|
|
|
i.
|
An additional 1,125 Attributable Gold Equivalent ounces sold from the Company’s Yamana silver stream and Chapada copper stream. The increase was largely related to the timing of shipments; whereby, under the terms of the agreements, the time period over which the calculation of the maximum thresholds for deliveries was revised. These revisions resulted in the production thresholds being calculated on a quarterly basis as opposed to a monthly basis; thereby, reducing the variability of deliveries and annual true ups;
|
|
|
|
|
|
|
ii.
|
An increase in the number gold ounces sold from the Santa Elena Mine; and
|
|
|
|
|
|
|
iii.
|
An increase in the number of gold ounces sold from the Black Fox Mine;
|
|
|
|
|
|
Partially offset by:
|
|
|
|
|
|
|
|
|
|
|
|
|
|
|
|
|
|
|
A 6% decrease in the average realized selling price of gold.
|
NINE MONTHS ENDED SEPTEMBER 30, 2017
COMPARED TO THE NINE MONTHS ENDED SEPTEMBER 30, 2016
For the nine months ended September 30, 2017, net income and cash flow from operating activities were $9.8 million and $34.9 million, respectively, compared with net income and cash flow from operating activities of $25.3 million and $28.9 million for the comparable period in 2016. The change is attributable to a combination of factors including:
|
|
|
|
|
|
|
|
|
|
|
|
|
|
|
A $5.6 million gain primarily consisting of (i) $3.0 million, which was recognized during the three months ended September 30, 2017, arising from the Bachelor Lake Gold Stream amendment; (ii) a $1.8 million gain relating to the settlement of the Trek (previously Luna) debt and a $0.6 million gain relating to the 20% premium associated with Orezone exercising its option to repurchase the royalty on the Bomboré gold project, both of which were recognized during the three months ended March 31, 2017;
|
|
|
|
|
|
|
|
|
|
|
|
|
|
|
|
During the three months ended June 30, 2017, the Company recognized a $1.9 million foreign exchange gain primarily driven from currency trades and the resulting cash held in escrow which were required to meet the cash commitments under Sandstorm’s bid to acquire Mariana; and
|
|
|
|
|
|
|
|
|
|
|
|
During the nine months ended September 30, 2017, the Company recognized a $0.6 million decrease in project evaluation costs primarily driven by cost reduction strategies;
|
Offset by:
|
|
|
|
|
|
|
The recognition of a $4.5 million non-cash impairment charge, during the three months ended June 30, 2017, relating to the Company’s royalty on the Coringa gold project;
|
|
|
|
|
|
|
|
During the nine months ended September 30, 2017, the Company recognized a $3.4 million increase in depletion expense largely driven by an increase in the number of Attributable Gold Equivalent ounces sold;
|
|
|
|
|
|
|
|
During the nine months ended September 30, 2017, the Company recognized an increase of $1.2 million in administration expenses partly driven by the acquisition of Mariana and related operating costs. The Company expects these costs to decline as it executes on its strategy of selling the exploration properties which were acquired as part of the Mariana acquisition; and
|
|
|
|
|
|
|
|
A decrease in the gains recognized on the revaluation of the Company’s investments; whereby, a gain of $1.4 million was recognized during the nine months ended September 30, 2017 which was $23.8 million less when compared to the nine months ended September 30, 2016.
|
For the nine months ended September 30, 2017, revenue was $52.8 million compared with $45.9 million for the comparable period in 2016. The increase is largely attributed to a 17% increase in the number of Attributable Gold Equivalent ounces sold, due to:
|
|
|
|
|
|
i.
|
An additional 4,107 Attributable Gold Equivalent ounces sold from the Company’s Yamana silver stream and Chapada copper stream. The increase was largely related to the timing of shipments; whereby, under the terms of the agreements, the time period over which the calculation of the maximum thresholds for deliveries was revised. These revisions resulted in the production thresholds being calculated on a quarterly basis as opposed to a monthly basis; thereby, reducing the variability of deliveries and annual true ups;
|
|
|
|
|
|
|
ii.
|
An additional 1,484 gold ounces sold from the Karma Mine, which announced its first gold production in April 2016;
|
|
|
|
|
|
|
iii.
|
A 23% increase in gold ounces sold from the Black Fox Mine largely driven by increased gold production from the mine in 2017. In addition, the Company received 887 gold ounces by September 30, 2017 that were not sold until after quarter end.
|
Partially offset by:
|
|
|
|
|
|
iv.
|
A 13% decrease in gold ounces sold from the Santa Elena Mine primarily related to the timing of shipments whereby 1,335 ounces were received by September 30, 2017, but were sold subsequent to quarter end.
|
THREE MONTHS ENDED SEPTEMBER 30, 2017
COMPARED TO THE OTHER QUARTERS PRESENTED
When comparing net income of $4.8 million and cash flow from operating activities of $11.9 million for the three months ended September 30, 2017 with net income/loss and operating cash flow for the remaining quarters, the following items impact comparability of analysis:
|
|
|
|
|
|
|
|
|
|
|
|
|
A $3.0 million gain resulting from the Bachelor Lake Gold Stream amendment for which Sandstorm received consideration consisting of $2.0 million in the common shares of Metanor and a 3.9% NSR on Metanor’s Barry project was recognized during the three months ended September 30, 2017;
|
|
|
|
|
|
|
|
A $4.5 million non-cash impairment charge relating to the Company’s royalty on the Coringa gold project was recognized during the three months ended June 30, 2017;
|
|
|
|
|
|
|
|
The Company recognized gains and losses with respect to the revaluation of its investments, which were primarily driven by changes in the fair value of the Trek (previously Luna) convertible debenture. For the three months ended September 30, 2017 and the three months ended June 30, 2017, these losses amounted to $0.5 million and $0.9 million, respectively, while for the three months ended March 31, 2017 these gains amounted to $2.7 million. In the first three quarters of 2016 these gains amounted to $13.4 million, $6.0 million and $5.8 million, respectively and in the fourth quarter of 2016, the Company recognized a loss of $3.1 million on revaluation;
|
|
|
|
|
|
|
|
During the three months ended March 31, 2017, the Company recognized a $2.2 million gain primarily resulting from (i) the settlement of the Trek (previously Luna) debt and (ii) the 20% premium associated with Orezone exercising its option to repurchase the royalty on the Bomboré gold project;
|
|
|
|
|
|
|
|
Non-cash impairment charges of $1.4 million and $1.1 million were recorded during the three months ended March 31, 2016 and the three months ended September 30, 2016, respectively;
|
|
|
|
|
|
|
|
A general decrease in finance expenses when compared to previous quarters primarily driven by the repayment of revolving credit facility; and
|
|
|
|
|
|
|
|
Overall, Gold Attributable Equivalent ounces sold have increased over the course of the last three years as a result of the acquisition of various assets including the Teck Resources Limited (“Teck”) royalty package which consists of 52 royalties and was purchased during the three months ended March 31, 2016.
|
CHANGE IN TOTAL ASSETS
Total assets increased by $121.6 million from June 30, 2017 to September 30, 2017 primarily resulting from the acquisition of Mariana and operating cash flow; partially offset by depletion expense. Total assets decreased by $4.8 million from March 31, 2017 to June 30, 2017 primarily resulting from a decrease in the value of the Company’s investments and a non-cash impairment charge relating to the Company’s royalty on the Coringa gold project; partially offset by operating cash flow. Total assets increased by $15.5 million from December 31, 2016 to March 31, 2017 primarily resulting from an increase in the value of the Company’s investments and operating cash flow; partially offset by depletion expense. Total assets decreased by $5.5 million from September 30, 2016 to December 31, 2016 primarily resulting from depletion expense and a decrease in the value of the Company’s investments; partially offset by operating cash flow. Total assets increased by $15.1 million from June 30, 2016 to September 30, 2016 primarily resulting from operating cash flow and an increase in the value of the Company’s investments; partially offset by depletion expense. Total assets decreased by $5.8 million from March 31, 2016 to June 30, 2016 primarily resulting from depletion expense; partially offset by an increase in the value of the Company’s investments. Total assets increased by $34.3 million from December 31, 2015 to March 31, 2016 primarily resulting from the acquisition of the Teck royalty package and an increase in the fair value of the Company’s investments, partially offset by depletion expense and a non-cash impairment charge on certain mineral interests.
NON-IFRS AND OTHER MEASURES
The Company has included, throughout this document, certain performance measures, including (i) average cash cost per attributable ounce and (ii) average realized gold price per attributable ounce. The presentation of these non-IFRS measures is intended to provide additional information and should not be considered in isolation or as a substitute for measures of performance prepared in accordance with IFRS. These non-IFRS measures do not have any standardized meaning prescribed by IFRS, and other companies may calculate these measures differently.
|
|
|
|
|
|
i.
|
Average cash cost per attributable ounce is calculated by dividing the Company’s cost of sales, excluding depletion by the number of Attributable Gold Equivalent ounces sold. The Company presents average cash cost per ounce as it believes that certain investors use this information to evaluate the Company’s performance in comparison to other streaming companies in the precious metals mining industry who present results on a similar basis. Figure 1.1 provides a reconciliation of average cash cost of gold on a per ounce basis.
|
Figure 1.1
|
|
|
|
|
|
|
|
|
|
|
|
|
|
|
|
|
|
|
|
|
|
|
|
|
|
|
|
|
|
|
3 Months Ended
|
|
3 Months Ended
|
|
9 Months Ended
|
|
9 Months Ended
|
|
|
|
September 30, 2017
|
|
September 30, 2016
|
|
September 30, 2017
|
|
September 30, 2016
|
|
Cost of Sales, excluding depletion1
|
|
$
|
3,512
|
|
$
|
3,211
|
|
$
|
11,230
|
|
$
|
9,518
|
|
|
|
|
|
|
|
|
|
|
|
|
|
|
|
Cash cost of sales is comprised of:
|
|
|
|
|
|
|
|
|
|
|
|
|
|
Total cash cost of gold sold
|
|
$
|
3,512
|
|
$
|
3,211
|
|
$
|
11,230
|
|
$
|
9,518
|
|
Divided by:
|
|
|
|
|
|
|
|
|
|
|
|
|
|
Total Attributable Gold Equivalent ounces sold 2
|
|
|
14,293
|
|
|
12,588
|
|
|
42,601
|
|
|
36,486
|
|
Equals:
|
|
|
|
|
|
|
|
|
|
|
|
|
|
Average cash cost of gold (per attributable ounce)
|
|
$
|
246
|
|
$
|
255
|
|
$
|
264
|
|
$
|
261
|
|
|
|
|
1.
|
Cost of Sales, excluding depletion, includes cash payments made for Gold Equivalent ounces associated with commodity streams.
|
|
2.
|
The Company’s royalty and other commodity stream income is converted to an Attributable Gold Equivalent ounce basis by dividing the royalty and other commodity income for that period by the average realized gold price per ounce from the Company’s Gold Streams for the same respective period. These Attributable Gold Equivalent ounces when combined with the gold ounces sold from the Company’s Gold Streams equal total Attributable Gold Equivalent ounces sold.
|
|
|
|
|
|
|
ii.
|
Average realized gold price per attributable ounce is calculated by dividing the Company’s sales by the number of Attributable Gold Equivalent ounces sold. The Company presents average realized gold price per attributable ounce as it believes that certain investors use this information to evaluate the Company’s performance in comparison to other streaming companies in the precious metals mining industry that present results on a similar basis. Figure 1.2 provides a reconciliation of average realized gold price per ounce.
|
Figure 1.2
|
|
|
|
|
|
|
|
|
|
|
|
|
|
|
|
|
|
|
|
|
|
|
|
|
|
|
|
|
|
|
3 Months Ended
|
|
3 Months Ended
|
|
9 Months Ended
|
|
9 Months Ended
|
|
|
|
September 30, 2017
|
|
September 30, 2016
|
|
September 30, 2017
|
|
September 30, 2016
|
|
Total Revenue
|
|
$
|
17,939
|
|
$
|
16,815
|
|
$
|
52,829
|
|
$
|
45,908
|
|
|
|
|
|
|
|
|
|
|
|
|
|
|
|
Divided by:
|
|
|
|
|
|
|
|
|
|
|
|
|
|
Total Attributable Gold Equivalent ounces sold
|
|
|
14,293
|
|
|
12,588
|
|
|
42,601
|
|
|
36,486
|
|
Equals:
|
|
|
|
|
|
|
|
|
|
|
|
|
|
Average realized gold price (per attributable ounce)
|
|
$
|
1,255
|
|
$
|
1,336
|
|
$
|
1,240
|
|
$
|
1,258
|
LIQUIDITY AND CAPITAL RESOURCES
As of September 30, 2017, the Company had cash and cash equivalents of $6.1 million (December 31, 2016 – $21.4 million) and working capital of $20.4 million (December 31, 2016 – $23.8 million). In addition, the Company has an undrawn $110 million revolving credit facility available for future acquisitions.
During the nine months ended September 30, 2017, the Company generated cash flows from operating activities of $34.9 million compared with $28.9 million during the comparable period in 2016, with the increase being primarily attributable to an increase in the number of Attributable Gold Equivalent ounces sold.
During the nine months ended September 30, 2017, the Company had net cash outflows from investing activities of $38.3 million which were primarily the result of: (i) $48.3 million in cash outflows relating to the Mariana acquisition which included the cash consideration of the transaction and associated acquisition costs, which were partially offset by the cash Mariana had on acquisition; (ii) the acquisition of investments and other assets; and (iii) $3.6 million in payments related to the acquisition of royalty interests; partially offset by: (i) $13.8 million of cash inflows largely resulting from the sale of investments as the Company continues to monetize its non-core investments and (ii) $3.6 million relating to Orezone exercising its option to repurchase its royalty on the Bomboré gold project. During the nine months ended September 30, 2016, the Company had net cash inflows from investing activities of $0.9 million which were primarily the result of: (i) $18.4 million cash inflow largely consisting of the disposition of a portion of the Company’s investments and the receipt of $5.5 million related to the Company’s amendment of the Entrée commodity streams; which were partially offset by (ii) the acquisition of investments and other assets; (iii) the payment of $4.0 million and $5.2 million in connection with the Yamana commodity streams and the Karma Gold Stream, respectively; and (iv) a $1.4 million payment related to the Teck royalty transaction.
During the nine months ended September 30, 2017, the Company drew down $16 million on its revolving credit facility to fund a portion of the cash consideration required for the Mariana acquisition. The $16 million drawn down was subsequently repaid within the same period utilizing cash flow from operating activities and the proceeds from the sale of non-core investments. In addition, the Company had cash out flows of $14.2 million related to the redemption of the Company’s common shares under the NCIB. During the nine months ended September 30, 2016, the Company had net cash outflows from financing activities of $25.3 million largely related to $83.5 million in the repayment of debt under the Company’s revolving credit facility; partially offset by (i) $57.5 million raised in gross proceeds from the Company’s July 2016 equity financing and (ii) $5.1 million in proceeds from the exercise of stock options.
CONTRACTUAL OBLIGATIONS
In connection with its commodity streams, the Company has committed to purchase the following:
|
|
|
|
|
|
|
|
|
|
|
|
|
Stream
|
|
% of Life of Mine Gold
or Relevant Commodity 5,6,7,8,9
|
|
Per Ounce Cash Payment:
lesser of amount below and the then prevailing market price of the commodity (unless otherwise noted) 1, 2, 3, 4
|
|
Bachelor Lake
|
|
20%
|
|
$500
|
|
Black Fox
|
|
8%
|
|
$531
|
|
Chapada
|
|
4.2%
|
|
30% of copper spot price
|
|
Entrée
|
|
5.62% on Hugo North Extension
and 4.26% on Heruga
|
|
$220
|
|
Karma
|
|
26,875 ounces over 5 years
and 1.625% thereafter
|
|
20% of gold spot price
|
|
Ming
|
|
25% of the first 175,000 ounces of gold produced, and 12% thereafter
|
|
$nil
|
|
Santa Elena
|
|
20%
|
|
$450
|
|
Yamana silver stream
|
|
Varies
|
|
30% of silver spot price
|
|
|
|
|
1.
|
Subject to an annual inflationary adjustment except for Ming.
|
|
2.
|
For the Entrée Gold Stream, after approximately 8.6 million ounces of gold have been produced from the joint venture property, the price increases to $500 per gold ounce.
|
|
3.
|
For the Entrée silver stream, percentage of life of mine is 5.62% on Hugo North Extension and 4.26% on Heruga which the Company can purchase for the lesser of the prevailing market price and $5 per ounce of silver until 40.3 million ounces of silver have been produced from the entire joint venture property. Thereafter, the purchase price will increase to the lesser of the prevailing market price and $10 per ounce of silver.
|
|
4.
|
For the Santa Elena Gold Stream, the Company can purchase gold for a per ounce cash payment equal to the lesser of $450 and the then prevailing market price of gold.
|
|
5.
|
For the Entrée Gold and silver stream, percentage of life of mine is 5.62% on Hugo North Extension and 4.26% on Heruga if the minerals produced are contained below 560 meters in depth.
|
|
6.
|
For the Entrée Gold and silver stream, percentage of life of mine is 8.43% on Hugo North Extension and 6.39% on Heruga if the minerals produced are contained above 560 meters in depth.
|
|
7.
|
For the Entrée copper stream, the Company has committed to purchase an amount equal to 0.42% of the copper produced from the Hugo North Extension and Heruga deposits. If the minerals produced are contained above 560 meters in depth, then the commitment increases to 0.62% for both the Hugo North Extension and Heruga deposits. Sandstorm will make ongoing per pound cash payments equal to the lesser of $0.50 and the then prevailing market price of copper, until 9.1 billion pounds of copper have been produced from the entire joint venture property. Thereafter, the on-going per pound payments will increase to the lesser of $1.10 and the then prevailing market price of copper.
|
|
8.
|
For the Chapada copper stream, the Company has committed to purchase an amount equal to 4.2% of the copper produced (up to an annual maximum of 3.9 million pounds of copper) until Yamana has delivered 39 million pounds of copper to Sandstorm; then 3.0% of the copper produced until, on a cumulative basis, Yamana has delivered 50 million pounds of copper to Sandstorm; then 1.5% of the copper produced thereafter, for the life of the mine. If Cerro Moro has not achieved the Commencement of Production and Sandstorm has not received cumulative pre-tax cash flow equal to $70 million from the Yamana silver stream, then the First Chapada Delivery Threshold and the Second Chapada Delivery Threshold will cease to be in effect and Sandstorm will continue to purchase 4.2% of Chapada’s payable copper production (up to an annual maximum of 3.9 million pounds of copper), until such time as Sandstorm has received cumulative pre-tax cash flow equal to $70 million, or Cerro Moro has achieved the Commencement of Production.
|
|
9.
|
Under the terms of the Yamana silver stream, Sandstorm has agreed to purchase an amount of silver from Cerro Moro equal to 20% of the silver produced (up to an annual maximum of 1.2 million ounces of silver), until Yamana has delivered to Sandstorm 7.0 million ounces of silver; then 9.0% of the silver produced thereafter. As part of the Yamana silver stream, through 2018, Sandstorm has also agreed to purchase an amount of silver from: (i) the Minera Florida mine in Chile equal to 38% of the silver produced (up to an annual maximum of 200,000 ounces of silver); and (ii) the Chapada mine in Brazil equal to 52% of the silver produced (up to an annual maximum of 100,000 ounces of silver).
|
SHARE CAPITAL
As of November 1, 2017, the Company had 182,397,096 common shares outstanding. As disclosed previously, the funds from the issuance of share capital have been used to finance the acquisition of Gold Streams and royalties (recent acquisitions are described earlier in greater detail), with the net proceeds of the 2016 equity financings used to reduce the balance of the Company’s revolving credit facility.
A summary of the Company’s share purchase options
as of November 1, 2017 are as follows:
|
|
|
|
|
|
|
|
|
|
|
|
|
|
Year of expiry
|
|
Number
outstanding
|
|
Vested
|
|
Exercise price per share (range) (CAD$)
|
|
Weighted average exercise price per share (CAD$) 1
|
|
2017
|
|
557,983
|
|
557,983
|
|
C$
|
|
0.96 - 18.33
|
|
C$
|
15.14
|
|
2018
|
|
175,072
|
|
175,072
|
|
|
|
2.88 - 11.31
|
|
|
5.21
|
|
2019
|
|
3,769,286
|
|
2,523,472
|
|
|
|
1.44 - 6.03
|
|
|
2.68
|
|
2020
|
|
1,284,000
|
|
428,005
|
|
|
|
3.60 - 3.64
|
|
|
3.61
|
|
2021
|
|
1,405,740
|
|
69,740
|
|
|
|
2.61 - 4.96
|
|
|
2.61
|
|
2022
|
|
839,130
|
|
839,130
|
|
|
|
4.79 - 15.00
|
|
|
4.82
|
|
|
|
8,031,211
|
|
4,593,402
|
|
|
|
|
|
C$
|
4.77
|
|
|
|
|
1.
|
Weighted average exercise price of options that are exercisable
|
A summary of the Company’s warrants
as of November 1, 2017 are as follows:
|
|
|
|
|
|
|
|
Number
outstanding
|
|
Exercise Price
per Share (CAD$)
|
|
Expiry Date
|
|
1,248,186
|
|
C$
|
1.20
|
|
May 6, 2018
|
|
3,000,000
|
|
|
4.50
|
|
March 23, 2020
|
|
15,000,000
|
|
|
3.50
|
|
October 27, 2020
|
|
5,043,900
|
|
|
4.00
|
|
November 3, 2020
|
|
24,292,086
|
|
|
|
|
|
The Company has 1,896,805 Restricted Share Rights (“RSRs”) outstanding as at November 1, 2017.
KEY MANAGEMENT PERSONNEL COMPENSATION
The remuneration of directors and those persons having authority and responsibility for planning, directing and controlling activities of the Company are as follows:
|
|
|
|
|
|
|
|
|
|
|
|
|
|
|
|
|
|
|
|
|
|
|
|
|
|
|
|
|
|
|
3 Months Ended
|
|
3 Months Ended
|
|
9 Months Ended
|
|
9 Months Ended
|
|
In $000s
|
|
September 30, 2017
|
|
September 30, 2016
|
|
September 30, 2017
|
|
September 30, 2016
|
|
Employee salaries and benefits
|
|
$
|
300
|
|
$
|
284
|
|
$
|
864
|
|
$
|
840
|
|
Share-based payments
|
|
|
651
|
|
|
517
|
|
|
1,939
|
|
|
1,546
|
|
Total key management compensation expense
|
|
$
|
951
|
|
$
|
801
|
|
$
|
2,803
|
|
$
|
2,386
|
FINANCIAL INSTRUMENTS
The fair value of the Company's financial instruments which include cash and cash equivalents, trade receivables and other, receivables and other, and trade and other payables approximate their carrying values at September 30, 2017. All financial instruments are initially recorded at fair value.
Credit Risk
The Company’s credit risk is limited to cash and cash equivalents, trade receivables and other, and receivables and other in the ordinary course of business. The Company’s trade receivables and other is subject to the credit risk of the counterparties who own and operate the mines underlying Sandstorm’s royalty portfolio. The Company’s convertible debenture due from Trek is subject to Trek’s credit risk, the Company’s ability to realize on its security, and the risk that the value of Trek’s equity decreases below the puttable price of the instrument.
Currency Risk
Financial instruments that impact the Company’s net income or other comprehensive income due to currency fluctuations include: cash and cash equivalents, trade receivables and other, investments and trade and other payables denominated in Canadian dollars. Based on the Company's Canadian dollar denominated monetary assets and monetary liabilities at September 30, 2017 a 10% increase (decrease) of the value of the Canadian dollar relative to the United States dollar would increase (decrease) net income by $0.5 million and other comprehensive income by $2.7 million, respectively.
Other Risks
Sandstorm holds common shares, convertible debentures, and warrants of other companies with a combined fair market value as at September 30, 2017 of $66.9 million (December 31, 2016 – $61.3 million). The daily exchange traded volume of these shares, including the shares underlying the warrants, may not be sufficient for the Company to liquidate its position in a short period of time without potentially affecting the market value of the shares. The Company is subject to default risk with respect to any debt instruments. The Company is exposed to equity price risk as a result of holding these investments in other mining companies. The Company does not actively trade these investments. Based on the Company's long-term investments held as at September 30, 2017 a 10% increase (decrease) in the equity prices of these investments would increase (decrease) net income by $1.7 million and other comprehensive income by $3.8 million.
RISKS TO SANDSTORM
The primary risk factors affecting the Company are set forth below. For additional discussion of risk factors, please refer to the Company’s annual information form dated March 29, 2017, which is available on www.sedar.com .
Risks Relating To Mineral Projects
To the extent that they relate to the production of gold or applicable commodity from, or the operation of, the Chapada Mine, the Cerro Moro Project, the Diavik Mine, the Aurizona Mine, the Santa Elena Mine, the Karma Mine, the Ming Mine, the Black Fox Mine, the Bachelor Lake Mine, the Hugo North Extension and Heruga deposits, the Mt. Hamilton Project, the Gualcamayo Mine, the Emigrant Springs Mine, MWS, the San Andres Mine, the Prairie Creek Project, the Bracemac-McLeod Mine, the Hot Maden Project, the Hackett River Project, the Lobo-Marte Project, Agi Dagi and Kirazli or other royalties, interests or commodity streams in Sandstorm’s portfolio (the “Mines”), the Company will be subject to the risk factors applicable to the operators of such Mines. Whether the Mines will be commercially viable depends on a number of factors, including cash costs associated with extraction and processing, the particular attributes of the deposit, such as size, grade and proximity to infrastructure, as well as metal prices which are highly cyclical and government regulations, including regulations relating to prices, taxes, royalties, land tenure, land use, importing and exporting of minerals and environmental protection. The Mines are also subject to other risks that could lead to their shutdown and closure including flooding and weather related events, the failure to receive permits or having existing permits revoked, collapse of mining infrastructure including tailings pond, as well as community or social related issues. The exact effect of these factors cannot be accurately predicted, but the combination of these factors may result in the Mines becoming uneconomic resulting in their shutdown and closure. The Company is not entitled to purchase gold, other commodities, receive royalties or receive economic benefit from its interest in the Hot Maden Project, if no gold or applicable commodity is produced from the Mines.
No Control Over Mining Operations
The Company has no contractual rights relating to the operation or development of the Mines. Except for any payments which may be payable in accordance with applicable completion guarantees or cash flow guarantees, the Company will not be entitled to any material compensation if these mining operations do not meet their forecasted gold or other production targets in any specified period or if the Mines shut down or discontinue their operations on a temporary or permanent basis. The Mines may not commence commercial production within the time frames anticipated, if at all, and there can be no assurance that the gold or other production from such properties will ultimately meet forecasts or targets. At any time, any of the operators of the Mines or their successors may decide to suspend or discontinue operations. The Company is subject to the risk that the Mines shut down on a temporary or permanent basis due to issues including, but not limited to economics, lack of financial capital, floods, fire, mechanical malfunctions, social unrest, expropriation and other risks. There are no guarantees the Mines will achieve commercial production, ramp-up targets or complete expansion plans. These issues are common in the mining industry and can occur frequently.
Government Regulations
The Mines are subject to various foreign laws and regulations governing prospecting, exploration, development, production, exports, taxes, labour standards, waste disposal, protection and remediation of the environment, reclamation, historic and cultural resources preservation, mine safety and occupation health, handling, storage and transportation of hazardous substances and other matters. It is possible that the risks of expropriation, cancellation or dispute of licenses could result in substantial costs, losses and liabilities in the future. The costs of discovering, evaluating, planning, designing, developing, constructing, operating and closing the Mines in compliance with such laws and regulations are significant. It is possible that the costs and delays associated with compliance of such laws and regulations could become such that the owners or operators of the Mines would not proceed with the development of or continue to operate the Mines. Moreover, it is possible that future regulatory developments, such as increasingly strict environmental protection laws, regulations and enforcement policies thereunder, and claims for damages to property and persons resulting from the Mines could result in substantial costs and liabilities in the future.
International Operations
The Chapada Mine and the Aurizona Mine are located in Brazil, the Santa Elena Mine is located in Mexico, the Emigrant Springs Mine and the Mt. Hamilton Project are located in the United States of America, the Gualcamayo Mine and the Cerro Moro Project are located in Argentina, MWS is located in South Africa, the Hugo North Extension and Heruga projects are located in Mongolia, the Karma Mine is located in Burkina Faso, the San Andres Mine is located in Honduras, the Hot Maden Project, Agi Dagi and Kirazli are located in Turkey, the Lobo-Marte Project is located in Chile, and each of the Diavik Mine, the Ming Mine, the Black Fox Mine, Bachelor Lake Mine, Prairie Creek Project, the Hackett River Project and the Bracemac-McLeod Mine are located in Canada and as such, the Mines are exposed to various levels of political, economic and other risks and uncertainties. These risks and uncertainties include, but are not limited to, terrorism, international sanctions, hostage taking, military repression, crime, political instability, currency controls, extreme fluctuations in currency exchange rates, high rates of inflation, labour unrest, the risks of war or civil unrest, expropriation and nationalization, renegotiation or nullification of existing concessions, licenses, permits, approvals and contracts, illegal mining, changes in taxation policies, restrictions on foreign exchange and repatriation, and changing political conditions, and governmental regulations. Changes, if any, in mining or investment policies or shifts in political attitude in Mexico, Brazil, Mongolia, the United States of America, Burkina Faso, Argentina, Honduras, French Guiana, Chile, Turkey or Canada may adversely affect the operations or profitability of the Mines in these countries. Operations may be affected in varying degrees by government regulations with respect to, but not limited to, restrictions on production, price controls, export controls, currency remittance, income taxes, expropriation of property, foreign investment, maintenance of claims, environmental legislation, land use, land claims of local people, water use, mine safety and the rewarding of contracts to local contractors or require foreign contractors to employ citizens of, or purchase supplies from, a particular jurisdiction. Any adverse developments with respect to Lidya, its cooperation or in its exploration, development, permitting and operation of the Hot Maden Project in Turkey may adversely affect the Company’s 30% interest in the project. There are no assurances that the Company will be able to successfully convert its 30% interest in the Hot Maden Project into a commodity stream or royalty. Any changes or unfavorable assessments with respect to (i) the validity, ownership or existence of the Entrée concessions; as well as (ii) the validity or enforceability of Entrée’s joint venture agreement with Oyu Tolgoi LLC may adversely affect the Company’s profitability or profits realized under the Entrée Stream. A failure to comply strictly with applicable laws, regulations and local practices relating to mineral right applications and tenure, could result in loss, reduction or expropriation of entitlements, or the imposition of additional local or foreign parties as joint venture partners with carried or other interests. The occurrence of these various factors and uncertainties cannot be accurately predicted and could have an adverse effect on the Mines.
Income Taxes
The Company has a subsidiary in Barbados, Sandstorm Gold (Barbados) Limited, which entered into Gold Streams in connection with the Aurizona, Karma, and Santa Elena transactions. No assurance can be given that new taxation rules will not be enacted or that existing rules will not be applied in a manner which could result in the Company’s past and future profits being subject to increased levels of income tax. The Company’s international transactions have not yet been audited by the Canada Revenue Agency, and should such transactions be audited, no assurances can be given that the tax matters will be resolved favorably. The Company’s commodity streams and royalties in connection with Chapada, Cerro Moro, Diavik, Black Fox, Ming, Hugo North Extension and Heruga, MWS, Bachelor Lake, Mt. Hamilton, Prairie Creek, San Andres, Hot Maden Project, Hackett River Project, Lobo-Marte Project, Agi Dagi, Kirazli and Bracemac-McLeod transactions have been entered into directly by Canadian based subsidiaries and will therefore, be subject to Canadian, and/or U.S./Turkish/international taxation, as the case may be. The Gualcamayo NSR was entered into through an Argentinian subsidiary and therefore, may be subject to Canadian, and/or Argentinian taxation, as the case may be. The Emigrant Springs NSR was entered into through a US subsidiary and therefore, may be subject to Canadian, and/or US taxation, as the case may be.
Gold and Silver Prices
The price of the common shares, warrants, and the Company’s financial results may be significantly adversely affected by a decline in the price of gold and silver. The price of gold and silver fluctuates widely, especially in recent years, and is affected by numerous factors beyond the Company’s control, including but not limited to, the sale or purchase of gold and silver by various central banks and financial institutions, interest rates, exchange rates, inflation or deflation, fluctuation in the value of the U.S. dollar and foreign currencies, global and regional supply and demand, and the political and economic conditions of major gold and silver producing countries throughout the world. In the event that the prevailing market price of gold is less than $531 per ounce in the case of the Black Fox Gold Stream, $500 per ounce in the case of the Bachelor Lake Gold Stream, $450 per ounce in the case of the Santa Elena Gold Stream, and $220 per ounce in the case of the Hugo North Extension and Heruga Gold Stream, the purchase price will be the then prevailing market price per ounce of gold and the Company will not generate positive cash flow or earnings on those Gold Streams. Furthermore, if the gold or silver price drops below the cost of producing gold or silver at the Mines, then the Mines may not produce any gold or silver. As a result, the Company will not be entitled to purchase any gold or silver or receive an economic benefit.
Diamond Prices and Demand for Diamonds
The price of the common shares, warrants, and the Company’s financial results may be significantly adversely affected by a decline in the price and demand for diamonds. Diamond prices fluctuate and are affected by numerous factors beyond the control of the Company, including worldwide economic trends, worldwide levels of diamond discovery and production, and the level of demand for, and discretionary spending on, luxury goods such as diamonds. Low or negative growth in the worldwide economy, renewed or additional credit market disruptions, natural disasters or the occurrence of terrorist attacks or similar activities creating disruptions in economic growth could result in decreased demand for luxury goods such as diamonds, thereby negatively affecting the price of diamonds. Similarly, a substantial increase in the worldwide level of diamond production or the release of stocks held back during recent periods of lower demand could also negatively affect the price of diamonds. In each case, such developments could have a material adverse effect on the Company’s results of operations.
Copper Prices
The price of the common shares, warrants, and the Company’s financial results may be significantly adversely affected by a decline in the price of copper. Copper prices fluctuate widely and are affected by numerous factors beyond the Company’s control, including global supply and demand, expectations with respect to the rate of inflation, the exchange rates of the U.S. dollar to other currencies, interest rates, forward selling by producers, central bank sales and purchases, production and cost levels in major producing regions, global or regional political, economic or financial situations and a number of other factors. Furthermore, if the copper price drops below the cost of producing copper at the Mines, then the Mines may not produce any copper. As a result, the Company will not be entitled to purchase any copper or receive an economic benefit.
Solvency Risk of Counterparties
The price of the common shares and the Company’s financial results may be significantly affected by the Mines operators’ ability to continue as a going concern and have access to capital. The lack of access to capital could result in these companies entering bankruptcy proceedings and as a result, Sandstorm may not be able to realize any value from its respective streams or royalties.
OTHER
Critical Accounting Estimates
The preparation of consolidated financial statements in conformity with IFRS requires management to make estimates and assumptions that affect the reported amount of assets and liabilities and disclosure of contingent liabilities at the date of the consolidated financial statements, and the reported amounts of revenues and expenditures during the periods presented. Notes 2 and 4 of the Company’s 2016 annual consolidated financial statements describes all of the significant accounting policies as well as the significant judgments and estimates.
Disclosure Controls and Procedures
Disclosure controls and procedures are designed to provide reasonable assurance that all relevant information is gathered and reported to senior management, including the Company’s Chief Executive Officer and the Chief Financial Officer, on a timely basis so that appropriate decisions can be made regarding public disclosure. The Company’s system of disclosure controls and procedures includes, but is not limited to, the Disclosure Policy, the Code of Conduct, the Stock Trading Policy, Corporate Governance, the effective functioning of the Audit Committee and procedures in place to systematically identify matters warranting consideration of disclosure by the Audit Committee.
Management’s Report on Internal Control Over Financial Reporting
Management of the Company is responsible for establishing and maintaining effective internal control over financial reporting as such term is defined in the rules of the National Instrument 52-109 in Canada (“NI 52-109”) and under the Securities Exchange Act of 1934, as amended, in the United States. The Company’s internal control over financial reporting is designed to provide reasonable assurance regarding the reliability of the Company’s financial reporting for external purposes in accordance with IFRS as issued by the IASB.
The Company’s internal control over financial reporting includes:
|
|
|
|
|
|
|
maintaining records, that in reasonable detail, accurately and fairly reflect our transactions and dispositions of the assets of the Company;
|
|
|
|
|
|
|
|
providing reasonable assurance that transactions are recorded as necessary for preparation of the consolidated financial statements in accordance with IFRS as issued by the IASB;
|
|
|
|
|
|
|
|
providing reasonable assurance that receipts and expenditures are made in accordance with authorizations of management and the directors of the Company; and
|
|
|
|
|
|
|
|
providing reasonable assurance that unauthorized acquisition, use or disposition of Company assets that could have a material effect on the Company’s consolidated financial statements would be prevented or detected on a timely basis.
|
The Company’s internal control over financial reporting may not prevent or detect all misstatements because of inherent limitations. Additionally, projections of any evaluation of effectiveness to future periods are subject to the risk that controls may become inadequate because changes in conditions or deterioration in the degree of compliance with the Company’s policies and procedures. Management assessed the effectiveness of the Company's internal control over financial reporting as of September 30, 2017 based on the criteria set forth in Internal Control — Integrated Framework (2013) issued by the Committee of Sponsoring Organizations of the Treadway Commission (COSO). Based on this assessment, management has concluded that, as of September 30, 2017, the Company's internal control over financial reporting is effective and no material weaknesses were identified.
Changes in Internal Controls
Except for controls that were implemented in relation to the Mariana acquisition, there were no changes in internal controls of the Company during the three months ended September 30, 2017 that has materially affected, or is likely to materially affect, the Company’s internal control over financial reporting or disclosure controls and procedures.
Limitations of Controls and Procedures
The Company’s management, including the Chief Executive Officer and the Chief Financial Officer, believe that any disclosure controls and procedures or internal controls over financial reporting, no matter how well conceived and operated, can provide only reasonable, not absolute, assurance that the objectives of the control system are met. Further, the design of a control system must reflect the fact that there are resource constraints, and the benefits of controls must be considered relative to their costs. Because of the inherent limitations in all control systems, they cannot provide absolute assurance that all control issues and instances of fraud, if any, within the Company have been prevented or detected. These inherent limitations include the realities that judgments in decision-making can be faulty, and that breakdowns can occur because of simple error or mistake. Additionally, controls can be circumvented by the individual acts of some persons, by collusion of two or more people, or by unauthorized override of the control. The design of any systems of controls also is based in part upon certain assumptions about the likelihood of future events, and there can be no assurance that any design will succeed in achieving its stated goals under all potential future conditions. Accordingly, because of the inherent limitations in a cost effective control system, misstatements due to error or fraud may occur and not be detected.
FORWARD LOOKING STATEMENTS
This MD&A and any exhibits attached hereto and incorporated herein, if any, contain “forward-looking statements”, within the meaning of the U.S. Securities Act of 1933, as amended, the U.S. Securities exchange Act of 1934, as amended, the United States Private Securities Litigation Reform Act of 1995, and applicable Canadian and other securities legislation, concerning the business, operations and financial performance and condition of Sandstorm. Forward-looking information is provided as of the date of this MD&A and Sandstorm does not intend, and does not assume any obligation, to update this forward-looking information, except as required by law.
Generally, forward-looking information can be identified by the use of forward-looking terminology such as “plans”, “expects” or “does not expect”, “is expected”, “budget”, “scheduled”, “estimates”, “forecasts”, “intends”, “anticipates” or “does not anticipate”, or “believes”, or variations of such words and phrases or statements that certain actions, events or results “may”, “could”, “would”, “might” or “will be taken”, “occur” or “be achieved”. Forward-looking information is based on reasonable assumptions that have been made by Sandstorm as at the date of such information and is subject to known and unknown risks, uncertainties and other factors that may cause the actual results, level of activity, performance or achievements of Sandstorm to be materially different from those expressed or implied by such forward-looking information, including but not limited to: the impact of general business and economic conditions; the Chapada Mine, the Cerro Moro Project, the Ming Mine, the Gualcamayo Mine, the Karma Mine, the Emigrant Springs Mine, MWS, the Hugo North Extension and Heruga deposits, the mines underlying the Sandstorm portfolio of royalties, the Bachelor Lake Mine, the Diavik Mine, the Mt. Hamilton mine, the Prairie Creek Project, the San Andres Mine, the Hot Maden Project, the Hackett River Project, the Lobo-Marte Project, Agi Dagi and Kirazli or the Bracemac-McLeod Mine; the absence of control over mining operations from which Sandstorm will purchase gold and risks related to those mining operations, including risks related to international operations, government and environmental regulation, actual results of current exploration activities, conclusions of economic evaluations and changes in project parameters as plans continue to be refined; problems inherent to the marketability of minerals; industry conditions, including fluctuations in the price of metals, fluctuations in foreign exchange rates and fluctuations in interest rates; government entities interpreting existing tax legislation or enacting new tax legislation in a way which adversely affects Sandstorm; stock market volatility; competition; as well as those factors discussed in the section entitled “Risks to Sandstorm” herein and those risks described in the section entitled “Risk Factors” contained in Sandstorm’s most recent Annual Information Form for the year ended December 31, 2016 available at www.sedar.com and www.sec.gov and incorporated by reference herein.
Forward-looking information in this MD&A includes, among other things, disclosure regarding: Sandstorm’s existing Gold Streams and royalties as well as its future outlook, the mineral reserve and mineral resource estimates for each of the Chapada Mine, the Cerro Moro Project, the Diavik Mine, the Aurizona Mine, the Gualcamayo Mine, the Emigrant Springs Mine, MWS, the Santa Elena Mine, the Ming Mine, the Black Fox Mine, the Hugo North Extension and Heruga deposits, the Karma Mine, the mines underlying the Sandstorm portfolio of royalties, the Bachelor Lake Mine, the Mt. Hamilton Mine, the Prairie Creek Project, the San Andres Mine, the Hot Maden Project, the Hackett River Project, the Lobo-Marte Project, Agi Dagi and Kirazli and the Bracemac-McLeod Mine. Forward-looking information is based on assumptions management believes to be reasonable, including but not limited to the continued operation of the mining operations from which Sandstorm will purchase gold, other commodity or receive royalties from, no material adverse change in the market price of commodities, that the mining operations will operate in accordance with their public statements and achieve their stated production outcomes, and such other assumptions and factors as set out therein.
Although Sandstorm has attempted to identify important factors that could cause actual actions, events or results to differ materially from those contained in forward-looking information, there may be other factors that cause actions, events or results not to be as anticipated, estimated or intended. There can be no assurance that such information will prove to be accurate, as actual results and future events could differ materially from those anticipated in such information. Accordingly, readers should not place undue reliance on forward-looking information.
SANDSTORM GOLD LTD.
CONDENSED CONSOLIDATED INTERIM FINANCIAL STATEMENTS (UNAUDITED)
Q3 2017
|
|
|
|
Condensed Consolidated Interim
Statements of Financial Position
|
(unaudited)
Expressed in U.S. dollars ($000s)
|
|
|
|
|
|
|
|
|
|
|
|
|
|
|
|
|
|
|
|
|
|
ASSETS
|
|
Note
|
|
September 30, 2017
|
|
December 31, 2016
|
|
Current
|
|
|
|
|
|
|
|
|
|
Cash and cash equivalents
|
|
|
|
$
|
6,087
|
|
$
|
21,434
|
|
Short-term investments
|
|
6
|
|
|
12,197
|
|
|
-
|
|
Trade receivables and other
|
|
|
|
|
7,667
|
|
|
6,663
|
|
|
|
|
|
$
|
25,951
|
|
$
|
28,097
|
|
Non-current
|
|
|
|
|
|
|
|
|
|
Mineral, royalty and other interests
|
|
4
|
|
$
|
375,016
|
|
$
|
402,785
|
|
Hot Maden interest
|
|
5
|
|
|
190,861
|
|
|
-
|
|
Investments
|
|
6
|
|
|
54,656
|
|
|
61,293
|
|
Deferred income tax assets
|
|
|
|
|
13,652
|
|
|
16,934
|
|
Exploration assets
|
|
5
|
|
|
4,610
|
|
|
-
|
|
Deferred financing costs
|
|
|
|
|
1,533
|
|
|
1,935
|
|
Receivables and other
|
|
|
|
|
906
|
|
|
481
|
|
Loan receivable
|
|
6
|
|
|
-
|
|
|
23,357
|
|
Total assets
|
|
|
|
$
|
667,185
|
|
$
|
534,882
|
|
|
|
|
|
|
|
|
|
|
|
LIABILITIES
|
|
|
|
|
|
|
|
|
|
Current
|
|
|
|
|
|
|
|
|
|
Trade and other payables
|
|
|
|
$
|
5,502
|
|
$
|
4,289
|
|
|
|
|
|
|
|
|
|
|
|
Non-current
|
|
|
|
|
|
|
|
|
|
Deferred income tax liabilities
|
|
|
|
|
2,915
|
|
|
3,288
|
|
|
|
|
|
$
|
2,915
|
|
$
|
3,288
|
|
|
|
|
|
$
|
8,417
|
|
$
|
7,577
|
|
|
|
|
|
|
|
|
|
|
|
EQUITY
|
|
|
|
|
|
|
|
|
|
Share capital
|
|
|
|
$
|
683,638
|
|
$
|
573,085
|
|
Reserves
|
|
|
|
|
33,790
|
|
|
23,915
|
|
Deficit
|
|
|
|
|
(25,844)
|
|
|
(35,672)
|
|
Accumulated other comprehensive loss
|
|
|
|
|
(32,816)
|
|
|
(34,023)
|
|
|
|
|
|
$
|
658,768
|
|
$
|
527,305
|
|
Total liabilities and equity
|
|
|
|
$
|
667,185
|
|
$
|
534,882
|
Subsequent event (Note 14)
ON BEHALF OF THE BOARD:
|
|
|
|
“Nolan Watson”, Director
|
“David De Witt”, Director
|
- The accompanying notes are an integral part of these condensed consolidated interim financial statements -
|
|
|
|
Condensed Consolidated Interim
Statements of Income
|
(unaudited)
Expressed in U.S. dollars ($000s)
|
|
|
|
|
|
|
|
|
|
|
|
|
|
|
|
|
|
|
|
|
|
|
|
|
|
|
|
|
|
|
|
|
|
|
|
|
|
3 Months Ended
|
|
3 Months Ended
|
|
9 Months Ended
|
|
9 Months Ended
|
|
|
|
Note
|
|
September 30, 2017
|
|
September 30, 2016
|
|
September 30, 2017
|
|
September 30, 2016
|
|
Sales
|
|
13
|
|
$
|
11,534
|
|
$
|
11,302
|
|
$
|
36,230
|
|
$
|
30,664
|
|
Royalty revenue
|
|
13
|
|
|
6,405
|
|
|
5,513
|
|
|
16,599
|
|
|
15,244
|
|
|
|
|
|
$
|
17,939
|
|
$
|
16,815
|
|
$
|
52,829
|
|
$
|
45,908
|
|
|
|
|
|
|
|
|
|
|
|
|
|
|
|
|
|
Cost of sales, excluding depletion
|
|
|
|
$
|
3,512
|
|
$
|
3,211
|
|
$
|
11,230
|
|
$
|
9,518
|
|
Depletion
|
|
|
|
|
7,169
|
|
|
7,325
|
|
|
23,115
|
|
|
19,751
|
|
Total cost of sales
|
|
|
|
$
|
10,681
|
|
$
|
10,536
|
|
$
|
34,345
|
|
$
|
29,269
|
|
|
|
|
|
|
|
|
|
|
|
|
|
|
|
|
|
Gross profit
|
|
|
|
$
|
7,258
|
|
$
|
6,279
|
|
$
|
18,484
|
|
$
|
16,639
|
|
|
|
|
|
|
|
|
|
|
|
|
|
|
|
|
|
Expenses and other (income)
|
|
|
|
|
|
|
|
|
|
|
|
|
|
|
|
Administration expenses 1
|
|
9
|
|
$
|
1,866
|
|
$
|
1,086
|
|
$
|
4,749
|
|
$
|
3,571
|
|
Project evaluation 1
|
|
|
|
|
1,086
|
|
|
1,408
|
|
|
3,399
|
|
|
3,950
|
|
Foreign exchange (gain) loss
|
|
|
|
|
(89)
|
|
|
8
|
|
|
(2,073)
|
|
|
(7)
|
|
Loss (gain) on revaluation of investments
|
|
6
|
|
|
452
|
|
|
(5,785)
|
|
|
(1,415)
|
|
|
(25,253)
|
|
Finance income
|
|
|
|
|
(14)
|
|
|
(632)
|
|
|
(695)
|
|
|
(1,874)
|
|
Finance expenses and other
|
|
|
|
|
527
|
|
|
633
|
|
|
1,633
|
|
|
3,644
|
|
Mineral, royalty and other interests impairments
|
|
4 (c)
|
|
|
-
|
|
|
1,139
|
|
|
4,534
|
|
|
2,507
|
|
Gain on mineral interest disposal and other
|
|
|
|
|
(3,364)
|
|
|
-
|
|
|
(5,574)
|
|
|
-
|
|
Income before taxes
|
|
|
|
$
|
6,794
|
|
$
|
8,422
|
|
$
|
13,926
|
|
$
|
30,101
|
|
|
|
|
|
|
|
|
|
|
|
|
|
|
|
|
|
Current income tax expense
|
|
8
|
|
$
|
588
|
|
$
|
56
|
|
$
|
1,187
|
|
$
|
374
|
|
Deferred income tax expense
|
|
8
|
|
|
1,433
|
|
|
1,451
|
|
|
2,911
|
|
|
4,454
|
|
|
|
|
|
|
2,021
|
|
|
1,507
|
|
|
4,098
|
|
|
4,828
|
|
Net income for the period
|
|
|
|
$
|
4,773
|
|
$
|
6,915
|
|
$
|
9,828
|
|
$
|
25,273
|
|
|
|
|
|
|
|
|
|
|
|
|
|
|
|
|
|
Basic earnings per share
|
|
|
|
$
|
0.03
|
|
$
|
0.05
|
|
$
|
0.06
|
|
$
|
0.18
|
|
Diluted earnings per share
|
|
|
|
$
|
0.02
|
|
$
|
0.04
|
|
$
|
0.06
|
|
$
|
0.17
|
|
|
|
|
|
|
|
|
|
|
|
|
|
|
|
|
|
Weighted average number of common shares outstanding
|
|
|
|
|
|
|
|
|
|
|
|
|
|
|
|
Basic
|
|
7 (e)
|
|
|
182,242,318
|
|
|
150,392,588
|
|
|
162,170,852
|
|
|
141,444,093
|
|
Diluted
|
|
7 (e)
|
|
|
191,109,190
|
|
|
161,215,546
|
|
|
168,839,728
|
|
|
146,944,614
|
|
1 Equity settled stock based compensation (a non-cash item) is included in administration expenses and project evaluation
|
|
|
|
$
|
946
|
|
$
|
789
|
|
$
|
2,837
|
|
$
|
2,345
|
- The accompanying notes are an integral part of these condensed consolidated interim financial statements -
|
|
|
|
Condensed Consolidated Interim
Statements of Comprehensive Income
|
(unaudited)
Expressed in U.S. dollars ($000s)
|
|
|
|
|
|
|
|
|
|
|
|
|
|
|
|
|
|
|
|
|
|
|
|
|
|
|
|
|
|
|
|
|
|
|
|
|
|
3 Months Ended
|
|
3 Months Ended
|
|
9 Months Ended
|
|
9 Months Ended
|
|
|
|
Note
|
|
September 30, 2017
|
|
September 30, 2016
|
|
September 30, 2017
|
|
September 30, 2016
|
|
Net income for the period
|
|
|
|
$
|
4,773
|
|
$
|
6,915
|
|
$
|
9,828
|
|
$
|
25,273
|
|
|
|
|
|
|
|
|
|
|
|
|
|
|
|
|
|
Other comprehensive (loss) income for the period
|
|
|
|
|
|
|
|
|
|
|
|
|
|
|
|
Items that may subsequently be re-classified to net income:
|
|
|
|
|
|
|
|
|
|
|
|
|
|
|
|
Currency translation differences
|
|
|
|
$
|
(1,020)
|
|
$
|
(13)
|
|
$
|
(873)
|
|
$
|
127
|
|
Items that will not subsequently be re-classified to net income:
|
|
|
|
|
|
|
|
|
|
|
|
|
|
|
|
Gain on FVTOCI investments
|
|
6
|
|
|
1,019
|
|
|
6,312
|
|
|
2,350
|
|
|
21,897
|
|
Tax (expense) recovery on FVTOCI investments
|
|
|
|
|
(593)
|
|
|
70
|
|
|
(270)
|
|
|
925
|
|
Total other comprehensive (loss) income for the period
|
|
|
|
$
|
(594)
|
|
$
|
6,369
|
|
$
|
1,207
|
|
$
|
22,949
|
|
Total comprehensive income for the period
|
|
|
|
$
|
4,179
|
|
$
|
13,284
|
|
$
|
11,035
|
|
$
|
48,222
|
- The accompanying notes are an integral part of these condensed consolidated interim financial statements -
|
|
|
|
Condensed Consolidated Interim
Statements of Cash Flows
|
(unaudited)
Expressed in U.S. dollars ($000s)
|
|
|
|
|
|
|
|
|
|
|
|
|
|
|
|
|
|
|
|
|
|
|
|
|
|
|
|
|
|
|
|
|
|
|
|
|
|
3 Months Ended
|
|
3 Months Ended
|
|
9 Months Ended
|
|
9 Months Ended
|
|
Cash flow from (used in):
|
|
Note
|
|
September 30, 2017
|
|
September 30, 2016
|
|
September 30, 2017
|
|
September 30, 2016
|
|
Operating activities
|
|
|
|
|
|
|
|
|
|
|
|
|
|
|
|
· Net income for the period
|
|
|
|
$
|
4,773
|
|
$
|
6,915
|
|
$
|
9,828
|
|
$
|
25,273
|
|
Items not affecting cash:
|
|
|
|
|
|
|
|
|
|
|
|
|
|
|
|
· Depletion and depreciation and financing amortization
|
|
|
|
|
7,341
|
|
|
7,526
|
|
|
23,831
|
|
|
20,361
|
|
· Mineral, royalty and other interests impairments
|
|
|
|
|
-
|
|
|
1,139
|
|
|
4,534
|
|
|
2,507
|
|
· Deferred income tax expense
|
|
|
|
|
1,433
|
|
|
1,451
|
|
|
2,911
|
|
|
4,454
|
|
· Share-based payments
|
|
|
|
|
946
|
|
|
789
|
|
|
2,837
|
|
|
2,345
|
|
· Loss (gain) on revaluation of investments
|
|
|
|
|
452
|
|
|
(5,785)
|
|
|
(1,415)
|
|
|
(25,253)
|
|
· Unrealized foreign exchange gain
|
|
|
|
|
-
|
|
|
-
|
|
|
(2,006)
|
|
|
-
|
|
· Interest on loan receivable
|
|
|
|
|
-
|
|
|
(394)
|
|
|
(409)
|
|
|
(1,126)
|
|
· (Gain) loss on restructuring of mineral interest and loan receivable and other
|
|
|
|
|
(3,862)
|
|
|
125
|
|
|
(5,742)
|
|
|
952
|
|
· Changes in non-cash working capital
|
|
10
|
|
|
781
|
|
|
(1,453)
|
|
|
545
|
|
|
(580)
|
|
|
|
|
|
$
|
11,864
|
|
$
|
10,313
|
|
$
|
34,914
|
|
$
|
28,933
|
|
Investing activities
|
|
|
|
|
|
|
|
|
|
|
|
|
|
|
|
· Acquisition of Mariana Resources Limited
|
|
|
|
$
|
(48,299)
|
|
$
|
-
|
|
$
|
(48,299)
|
|
$
|
-
|
|
· Transfers of Restricted Cash
|
|
|
|
|
51,928
|
|
|
-
|
|
|
-
|
|
|
-
|
|
· Proceeds from disposal of investments and other
|
|
|
|
|
2,206
|
|
|
-
|
|
|
13,797
|
|
|
-
|
|
· Proceeds from disposal of mineral, royalty and other interests
|
|
|
|
|
-
|
|
|
-
|
|
|
3,600
|
|
|
18,371
|
|
· Acquisition of mineral, royalty and other interests
|
|
4 (b)
|
|
|
(1,587)
|
|
|
(49)
|
|
|
(3,558)
|
|
|
(10,753)
|
|
· Investment in Hot Maden interest
|
|
|
|
|
(285)
|
|
|
-
|
|
|
(285)
|
|
|
-
|
|
· Acquisition of investments and other assets
|
|
|
|
|
(99)
|
|
|
(1,120)
|
|
|
(3,505)
|
|
|
(5,719)
|
|
· Loan Issuance
|
|
|
|
|
-
|
|
|
(1,000)
|
|
|
-
|
|
|
(1,000)
|
|
|
|
|
|
$
|
3,864
|
|
$
|
(2,169)
|
|
$
|
(38,250)
|
|
$
|
899
|
|
Financing activities
|
|
|
|
|
|
|
|
|
|
|
|
|
|
|
|
· Redemption of common shares (normal course issuer bid)
|
|
|
|
$
|
(14,204)
|
|
$
|
(413)
|
|
$
|
(14,204)
|
|
$
|
(413)
|
|
· Bank debt drawn
|
|
|
|
|
-
|
|
|
-
|
|
|
16,000
|
|
|
-
|
|
· Bank debt repaid
|
|
|
|
|
-
|
|
|
(59,500)
|
|
|
(16,000)
|
|
|
(83,500)
|
|
· Proceeds on exercise of warrants, options and other
|
|
|
|
|
367
|
|
|
4,281
|
|
|
386
|
|
|
5,070
|
|
· Proceeds from issuance of common shares net of financing costs
|
|
|
|
|
-
|
|
|
54,436
|
|
|
-
|
|
|
53,584
|
|
|
|
|
|
$
|
(13,837)
|
|
$
|
(1,196)
|
|
$
|
(13,818)
|
|
$
|
(25,259)
|
|
|
|
|
|
|
|
|
|
|
|
|
|
|
|
|
|
Effect of exchange rate changes on cash and cash equivalents
|
|
|
|
$
|
(374)
|
|
$
|
(16)
|
|
$
|
1,807
|
|
$
|
127
|
|
Net increase (decrease) in cash and cash equivalents
|
|
|
|
|
1,517
|
|
|
6,932
|
|
|
(15,347)
|
|
|
4,700
|
|
Cash and cash equivalents – beginning of the period
|
|
|
|
|
4,570
|
|
|
3,114
|
|
|
21,434
|
|
|
5,346
|
|
Cash and cash equivalents – end of the period
|
|
|
|
$
|
6,087
|
|
$
|
10,046
|
|
$
|
6,087
|
|
$
|
10,046
|
Supplemental cash flow information (Note 10)
- The accompanying notes are an integral part of these condensed consolidated interim financial statements -
|
|
|
|
Condensed Consolidated Interim
Statements of Changes in Equity
|
(unaudited)
Expressed in U.S. dollars ($000s)
|
|
|
|
|
|
|
|
|
|
|
|
|
|
|
|
|
|
|
|
|
|
|
|
|
|
|
|
|
|
Share Capital
|
|
Reserves
|
|
|
|
|
|
|
|
|
|
|
|
Note
|
|
Number
|
|
Amount
|
|
Share Options and Restricted Stock Rights
|
|
Share Purchase Warrants
|
|
Deficit
|
|
Accumulated Other Comprehensive Loss
|
|
Total
|
|
At January 1, 2016
|
|
|
|
128,880,314
|
|
$
|
491,769
|
|
$
|
10,351
|
|
$
|
13,017
|
|
$
|
(60,926)
|
|
$
|
(51,560)
|
|
$
|
402,651
|
|
Shares issued
|
|
|
|
12,921,400
|
|
|
57,500
|
|
|
-
|
|
|
-
|
|
|
-
|
|
|
-
|
|
|
57,500
|
|
Options exercised
|
|
7 (b)
|
|
1,359,735
|
|
|
7,143
|
|
|
(2,076)
|
|
|
-
|
|
|
-
|
|
|
-
|
|
|
5,067
|
|
Vesting of restricted stock rights
|
|
|
|
1,159
|
|
|
13
|
|
|
(13)
|
|
|
-
|
|
|
-
|
|
|
-
|
|
|
-
|
|
Acquisition and cancellation of common shares (normal course issuer bid)
|
|
|
|
(69,211)
|
|
|
(413)
|
|
|
-
|
|
|
-
|
|
|
-
|
|
|
-
|
|
|
(413)
|
|
Shares issued for acquisition of royalties and other
|
|
|
|
9,149,196
|
|
|
20,892
|
|
|
-
|
|
|
-
|
|
|
-
|
|
|
-
|
|
|
20,892
|
|
Share issuance costs
|
|
|
|
-
|
|
|
(3,599)
|
|
|
-
|
|
|
-
|
|
|
-
|
|
|
-
|
|
|
(3,599)
|
|
Share based payments
|
|
|
|
-
|
|
|
-
|
|
|
2,345
|
|
|
-
|
|
|
-
|
|
|
-
|
|
|
2,345
|
|
Total comprehensive income
|
|
|
|
-
|
|
|
-
|
|
|
-
|
|
|
-
|
|
|
25,273
|
|
|
22,949
|
|
|
48,222
|
|
At September 30, 2016
|
|
|
|
152,242,593
|
|
$
|
573,305
|
|
$
|
10,607
|
|
$
|
13,017
|
|
$
|
(35,653)
|
|
$
|
(28,611)
|
|
$
|
532,665
|
|
Options exercised
|
|
7 (b)
|
|
156,667
|
|
|
466
|
|
|
(123)
|
|
|
-
|
|
|
-
|
|
|
-
|
|
|
343
|
|
Vesting of restricted stock rights
|
|
|
|
78,699
|
|
|
347
|
|
|
(347)
|
|
|
-
|
|
|
-
|
|
|
-
|
|
|
-
|
|
Acquisition and cancellation of common shares (normal course issuer bid)
|
|
|
|
(550,788)
|
|
|
(1,867)
|
|
|
-
|
|
|
-
|
|
|
-
|
|
|
-
|
|
|
(1,867)
|
|
Share issuance costs (net of deferred tax of $1.0 million)
|
|
|
|
-
|
|
|
792
|
|
|
-
|
|
|
-
|
|
|
-
|
|
|
-
|
|
|
792
|
|
Shares issued for acquisition of royalties and other
|
|
|
|
4,111
|
|
|
42
|
|
|
-
|
|
|
-
|
|
|
-
|
|
|
-
|
|
|
42
|
|
Share based payments
|
|
|
|
-
|
|
|
-
|
|
|
761
|
|
|
-
|
|
|
-
|
|
|
-
|
|
|
761
|
|
Total comprehensive loss
|
|
|
|
-
|
|
|
-
|
|
|
-
|
|
|
-
|
|
|
(19)
|
|
|
(5,412)
|
|
|
(5,431)
|
|
At December 31, 2016
|
|
|
|
151,931,282
|
|
$
|
573,085
|
|
$
|
10,898
|
|
$
|
13,017
|
|
$
|
(35,672)
|
|
$
|
(34,023)
|
|
$
|
527,305
|
|
Options exercised
|
|
7 (b)
|
|
65,176
|
|
|
227
|
|
|
(137)
|
|
|
-
|
|
|
-
|
|
|
-
|
|
|
90
|
|
Warrants exercised
|
|
7 (c)
|
|
503,816
|
|
|
1,769
|
|
|
-
|
|
|
(1,426)
|
|
|
-
|
|
|
-
|
|
|
343
|
|
Vesting of restricted stock rights
|
|
|
|
48,013
|
|
|
184
|
|
|
(184)
|
|
|
-
|
|
|
-
|
|
|
-
|
|
|
-
|
|
Acquisition and cancellation of common shares (normal course issuer bid)
|
|
|
|
(3,299,772)
|
|
|
(14,204)
|
|
|
-
|
|
|
-
|
|
|
-
|
|
|
-
|
|
|
(14,204)
|
|
Shares issued for acquisition of Mariana Resources Ltd.
|
|
5
|
|
32,685,228
|
|
|
122,569
|
|
|
-
|
|
|
-
|
|
|
-
|
|
|
-
|
|
|
122,569
|
|
Issuance of Mariana Resources Ltd. replacement equity awards
|
|
5
|
|
-
|
|
|
-
|
|
|
3,207
|
|
|
5,578
|
|
|
-
|
|
|
-
|
|
|
8,785
|
|
Financing costs and other
|
|
|
|
-
|
|
|
8
|
|
|
-
|
|
|
-
|
|
|
-
|
|
|
-
|
|
|
8
|
|
Share based payments
|
|
|
|
-
|
|
|
-
|
|
|
2,837
|
|
|
-
|
|
|
-
|
|
|
-
|
|
|
2,837
|
|
Total comprehensive income
|
|
|
|
-
|
|
|
-
|
|
|
-
|
|
|
-
|
|
|
9,828
|
|
|
1,207
|
|
|
11,035
|
|
At September 30, 2017
|
|
|
|
181,933,743
|
|
$
|
683,638
|
|
$
|
16,621
|
|
$
|
17,169
|
|
$
|
(25,844)
|
|
$
|
(32,816)
|
|
$
|
658,768
|
- The accompanying notes are an integral part of these condensed consolidated interim financial statements –
Notes to the Unaudited Condensed Consolidated
Interim Financial Statements
September 30, 2017
Expressed in U.S. dollars
|
|
|
|
|
|
1.
|
NATURE OF OPERATIONS
|
Sandstorm Gold Ltd. was incorporated under the Business Corporations Act of British Columbia on March 23, 2007. Sandstorm Gold Ltd. and its subsidiary entities (collectively "Sandstorm", “Sandstorm Gold” or the "Company") is a resource-based company that seeks to acquire gold and other metals purchase agreements (“Gold Streams” or “Streams”) and royalties from companies that have advanced stage development projects or operating mines. In return for making an upfront payment to acquire a Gold Stream or royalty, Sandstorm receives the right to purchase, at a fixed price per unit or at a variable price based on spot, a percentage of a mine’s production for the life of the mine (in the case of a stream) or a portion of the revenue generated from the mine (in the case of a royalty).
The head office, principal address and registered office of the Company are located at Suite 1400, 400 Burrard Street, Vancouver, British Columbia, V6C 3A6.
These condensed consolidated interim financial statements were authorized for issue by the Board of Directors of the Company on November 1, 2017.
|
|
|
|
|
|
2.
|
SUMMARY OF SIGNIFICANT ACCOUNTING POLICIES
|
|
|
|
|
|
|
A.
|
Statement of Compliance
|
These condensed consolidated interim financial statements, including comparatives, have been prepared in accordance with International Financial Reporting Standards (“IFRS”) as issued by the International Accounting Standards Board (“IASB”), applicable to preparation of interim financial statements including International Accounting Standard 34—Interim Financial Reporting ("IAS 34"). Accordingly, certain disclosures included in annual financial statements prepared in accordance with IFRS as issued by the IASB have been condensed or omitted. These unaudited condensed consolidated interim financial statements should be read in conjunction with the Company’s audited consolidated financial statements for the year ended December 31, 2016.
The accounting policies applied in the preparation of these condensed consolidated interim financial statements are consistent with those applied and disclosed in the Company’s audited consolidated financial statements for the year ended December 31, 2016 with the exception of new accounting policies described in note 2 (b). The Company’s interim results are not necessarily indicative of its results for a full year.
|
|
|
|
|
|
B.
|
New Accounting Policies
|
Investment in Associate
An associate is an entity over which the Company has significant influence, and is neither a subsidiary nor a joint arrangement. The Company has significant influence when it has the power to participate in the financial and operating policy decisions of the associate but does not have control or joint control over those policies. The Hot Maden interest on the Company’s Consolidated Statements of Financial Position represents an investment in an associate.
The Company accounts for its investment in an associate using the equity method. Under the equity method, the Company’s investment in an associate is initially recognized at cost when acquired and subsequently increased or decreased to recognize the Company's share of net income and losses of the associate, after any adjustments necessary to give effect to uniform accounting policies, any other movement in the associate’s reserves, and for impairment losses after the initial recognition date. The Company's share of income and losses of associates is recognized in net income during the period. Dividends received from an associate are accounted for as a reduction in the carrying amount of the Company’s investment.
|
|
|
|
|
|
C.
|
Basis of Presentation
|
These condensed consolidated interim financial statements have been prepared on a historical cost basis except for certain financial instruments which are measured at fair value.
The condensed consolidated interim financial statements are presented in United States dollars, and all values are rounded to the nearest thousand except as otherwise indicated.
|
|
|
|
|
|
D.
|
Future Changes in Accounting Policies
|
IFRS 15 Revenue from Contracts with Customers— The final standard on revenue from contracts with customers was issued on May 28, 2014 and is effective for annual reporting periods beginning after January 1, 2018 for public entities with early application permitted. Entities have the option of using either a full retrospective or a modified retrospective approach to adopt the guidance. The Company is well underway in its assessment of the impact of the new standard on its future financial statements. The process has included a review of all material contracts as well as the nature and type of the various Streams and royalties that the Company holds. This assessment has also included identifying the contract with the customer, the separate performance obligations contained therein and the appropriate transaction price. The Company does not currently anticipate any material changes to the Company’s sub processes or IT controls as a result of the adoption of the new standard.
|
|
|
|
|
|
3.
|
FINANCIAL INSTRUMENTS
|
|
|
|
|
|
|
A.
|
Fair Value Estimation
|
The fair value hierarchy establishes three levels to classify the inputs of valuation techniques used to measure fair value. The three levels of the fair value hierarchy are described below:
Level 1 | Unadjusted quoted prices in active markets that are accessible at the measurement date for identical, unrestricted assets or liabilities. Investments in common shares and warrants held that have direct listings on an exchange are classified as Level 1.
Level 2 | Quoted prices in markets that are not active, quoted prices for similar assets or liabilities in active markets, or inputs that are observable, either directly or indirectly, for substantially the full term of the asset or liabilities. Investments in warrants and convertible debt instruments held that are not listed on an exchange are classified as Level 2.
Level 3 | Prices or valuation techniques that require inputs that are both significant to fair value measurement and unobservable (supported by little or no market activity).
The following table sets forth the Company's financial assets and liabilities measured at fair value on a recurring basis by level within the fair value hierarchy as at September 30, 2017 and December 31, 2016. As required by IFRS 13, assets and liabilities are classified in their entirety based on the lowest level of input that is significant to the fair value measurement.
As at September 30, 2017:
|
|
|
|
|
|
|
|
|
|
|
|
|
|
|
In $000s
|
|
|
Total
|
|
Quoted prices in active markets for identical assets (Level 1)
|
|
Significant other observable inputs
(Level 2)
|
|
Unobservable inputs (Level 3)
|
|
Short-term investments
|
|
|
|
|
|
|
|
|
|
|
|
|
|
Convertible debt
|
|
$
|
12,197
|
|
$
|
-
|
|
$
|
12,197
|
|
$
|
-
|
|
Long-term investments
|
|
|
|
|
|
|
|
|
|
|
|
|
|
Common shares held
|
|
$
|
38,332
|
|
$
|
38,332
|
|
$
|
-
|
|
$
|
-
|
|
Warrants
|
|
|
2,531
|
|
|
-
|
|
|
2,531
|
|
|
-
|
|
Convertible debt
|
|
|
13,793
|
|
|
-
|
|
|
13,793
|
|
|
-
|
|
|
|
$
|
66,853
|
|
$
|
38,332
|
|
$
|
28,521
|
|
$
|
-
|
As at December 31, 2016:
|
|
|
|
|
|
|
|
|
|
|
|
|
|
|
In $000s
|
|
|
Total
|
|
Quoted prices in active markets for identical assets (Level 1)
|
|
Significant other observable inputs
(Level 2)
|
|
Unobservable inputs (Level 3)
|
|
Long-term investments
|
|
|
|
|
|
|
|
|
|
|
|
|
|
Common shares held
|
|
$
|
28,850
|
|
$
|
28,850
|
|
$
|
-
|
|
$
|
-
|
|
Warrants
|
|
|
3,404
|
|
|
-
|
|
|
3,404
|
|
|
-
|
|
Convertible debt
|
|
|
29,039
|
|
|
-
|
|
|
29,039
|
|
|
-
|
|
|
|
$
|
61,293
|
|
$
|
28,850
|
|
$
|
32,443
|
|
$
|
-
|
The fair value of the Company's financial instruments which include cash and cash equivalents, trade receivables and other, receivables and other, and trade and other payables approximate their carrying values at September 30, 2017.
The Company’s credit risk is limited to cash and cash equivalents, trade receivables and other, and receivables and other in the ordinary course of business. The Company’s trade receivables and other is subject to the credit risk of the counterparties who own and operate the mines underlying Sandstorm’s royalty portfolio. In order to mitigate its exposure to credit risk, the Company closely monitors its financial assets and maintains its cash deposits in several high-quality financial institutions. The Company’s convertible debenture due from Trek Mining Inc. (“Trek”) is subject to Trek’s credit risk and the Company’s ability to realize on its security.
Financial instruments that impact the Company’s net income or other comprehensive income due to currency fluctuations include: cash and cash equivalents, trade receivables and other, investments and trade and other payables denominated in Canadian dollars. Based on the Company's Canadian dollar denominated monetary assets and monetary liabilities at September 30, 2017 a 10% increase (decrease) of the value of the Canadian dollar relative to the United States dollar would increase (decrease) net income by $0.5 million and other comprehensive income by $2.7 million, respectively.
The Company has in place a planning and budgeting process to help determine the funds required to support the Company’s normal operating requirements on an ongoing basis. In managing liquidity risk, the Company takes into account the entire $110 million of available undrawn balance on its revolving credit facility, anticipated cash flows from operations and its holding of cash and cash equivalents. As at September 30, 2017, the Company had cash and cash equivalents of $6.1 million (December 31, 2016 – $21.4 million). Sandstorm holds common shares, convertible debentures, and warrants of other companies with a combined fair market value as at September 30, 2017, of $66.9 million (December 31, 2016 – $61.3 million). The daily exchange traded volume of these shares, including the shares underlying the warrants, may not be sufficient for the Company to liquidate its position in a short period of time without potentially affecting the market value of the shares.
The Company is exposed to equity price risk as a result of holding short and long-term investments in other mining companies. The Company does not actively trade these investments. The equity prices of these investments are impacted by various underlying factors including commodity prices. Based on the Company's short and long-term investments held as at September 30, 2017 a 10% increase (decrease) in the equity prices of these investments would increase (decrease) net income by $1.7 million (December 31, 2016- $1.2 million) and other comprehensive income by $3.8 million (December 31, 2016- $2.9 million).
|
|
|
|
|
|
4.
|
MINERAL, ROYALTY AND OTHER INTERESTS
|
As of and for the nine months ended September 30, 2017:
|
|
|
|
|
|
|
|
|
|
|
|
|
|
|
|
|
|
|
|
|
|
|
|
|
|
|
|
|
|
|
|
|
|
|
|
|
|
|
|
|
|
|
|
|
|
|
|
|
|
|
|
|
|
|
|
|
|
|
|
|
|
|
Cost
|
Accumulated Depletion
|
|
|
|
In $000s
|
|
|
Opening
|
|
Net Additions
(disposals)
|
|
Ending
|
Opening
|
|
Depletion1
|
|
Inventory depletion adjustment
|
|
Impairment
|
|
Ending
|
|
Carrying Amount
|
|
Aurizona
|
BRA
|
|
$
|
11,033
|
|
$
|
-
|
|
$
|
11,033
|
|
$
|
310
|
|
$
|
-
|
|
$
|
-
|
|
$
|
-
|
|
$
|
310
|
|
$
|
10,723
|
|
Bachelor Lake
|
CAN
|
|
|
23,972
|
|
|
34
|
|
|
24,006
|
|
|
19,339
|
|
|
3,428
|
|
|
334
|
|
|
-
|
|
|
23,101
|
|
|
905
|
|
Black Fox
|
CAN
|
|
|
37,761
|
|
|
19
|
|
|
37,780
|
|
|
24,395
|
|
|
1,601
|
|
|
419
|
|
|
-
|
|
|
26,415
|
|
|
11,365
|
|
Chapada
|
BRA
|
|
|
69,528
|
|
|
-
|
|
|
69,528
|
|
|
2,737
|
|
|
2,830
|
|
|
-
|
|
|
-
|
|
|
5,567
|
|
|
63,961
|
|
Diavik
|
CAN
|
|
|
53,111
|
|
|
-
|
|
|
53,111
|
|
|
11,792
|
|
|
4,093
|
|
|
-
|
|
|
-
|
|
|
15,885
|
|
|
37,226
|
|
Hugo North Extension and Heruga
|
MNG
|
|
|
35,351
|
|
|
-
|
|
|
35,351
|
|
|
-
|
|
|
-
|
|
|
-
|
|
|
-
|
|
|
-
|
|
|
35,351
|
|
Karma
|
BFA
|
|
|
26,289
|
|
|
-
|
|
|
26,289
|
|
|
2,619
|
|
|
1,980
|
|
|
671
|
|
|
-
|
|
|
5,270
|
|
|
21,019
|
|
Ming
|
CAN
|
|
|
20,068
|
|
|
2
|
|
|
20,070
|
|
|
8,585
|
|
|
185
|
|
|
-
|
|
|
-
|
|
|
8,770
|
|
|
11,300
|
|
Santa Elena
|
MEX
|
|
|
23,342
|
|
|
-
|
|
|
23,342
|
|
|
19,308
|
|
|
708
|
|
|
153
|
|
|
-
|
|
|
20,169
|
|
|
3,173
|
|
Yamana silver stream
|
ARG
|
|
|
74,234
|
|
|
2
|
|
|
74,236
|
|
|
1,427
|
|
|
1,635
|
|
|
-
|
|
|
-
|
|
|
3,062
|
|
|
71,174
|
|
Royalties 2
|
|
|
|
227,915
|
|
|
1,357
|
|
|
229,272
|
|
|
115,492
|
|
|
5,262
|
|
|
-
|
|
|
4,534
|
|
|
125,288
|
|
|
103,984
|
|
Other 3
|
|
|
|
10,725
|
|
|
(1,264)
|
|
|
9,461
|
|
|
4,540
|
|
|
76
|
|
|
10
|
|
|
-
|
|
|
4,626
|
|
|
4,835
|
|
Total 4
|
|
|
$
|
613,329
|
|
$
|
150
|
|
$
|
613,479
|
|
$
|
210,544
|
|
$
|
21,798
|
|
$
|
1,587
|
|
$
|
4,534
|
|
$
|
238,463
|
|
$
|
375,016
|
|
|
|
|
1.
|
Depletion during the period in the Condensed Consolidated Interim Statements of Income of $23.1 million is comprised of depletion expense for the period of $21.8 million, and $1.3 million from the Inventory depletion adjustment as at December 31, 2016.
|
|
2.
|
Includes Bracemac-McLeod, Coringa, Mt. Hamilton, Paul Isnard, Prairie Creek, Ann Mason, Gualcamayo, Emigrant Springs, Mine Waste Solutions, San Andres, Sao Francisco, Thunder Creek, the Early Gold Deposit, Hot Maden, Hackett River, Lobo-Marte, Agi Dagi & Kirazli, Forrestania and other.
|
|
3.
|
Includes Trek Mining (previously JDL) Stream and other.
|
|
4.
|
Total mineral interest and royalties includes $90.1 million of assets located in Canada, $92.4 million in Argentina, $78.0 million in Brazil, $36.6 million in Mongolia, $21.0 million in Burkina Faso, $20.2 million in the United States, $10.3 million in Turkey, $4.4 million in South Africa, $3.2 million in Mexico, $5.2 million in French Guiana, $5.6 million in Peru, $3.1 million in Australia and $4.9 million in other countries.
|
As of and for the year ended December 31, 2016:
|
|
|
|
|
|
|
|
|
|
|
|
|
|
|
|
|
|
|
|
|
|
|
|
|
|
|
|
|
|
|
|
|
|
|
|
|
|
|
|
|
|
|
|
|
|
|
|
|
|
|
|
|
|
|
|
|
|
|
|
|
|
|
Cost
|
Accumulated Depletion
|
|
|
|
In $000s
|
|
|
Opening
|
|
Net Additions (disposals)
|
|
Ending
|
Opening
|
|
Depletion
|
|
Inventory depletion adjustment
|
|
Impairment
|
|
Ending
|
|
Carrying Amount
|
|
Aurizona
|
BRA
|
|
$
|
11,000
|
|
$
|
33
|
|
$
|
11,033
|
|
$
|
310
|
|
$
|
-
|
|
$
|
-
|
|
$
|
-
|
|
$
|
310
|
|
$
|
10,723
|
|
Bachelor Lake
|
CAN
|
|
|
22,671
|
|
|
1,301
|
|
|
23,972
|
|
|
14,678
|
|
|
4,411
|
|
|
250
|
|
|
-
|
|
|
19,339
|
|
|
4,633
|
|
Black Fox
|
CAN
|
|
|
37,758
|
|
|
3
|
|
|
37,761
|
|
|
22,117
|
|
|
2,011
|
|
|
267
|
|
|
-
|
|
|
24,395
|
|
|
13,366
|
|
Chapada
|
BRA
|
|
|
69,520
|
|
|
8
|
|
|
69,528
|
|
|
-
|
|
|
2,737
|
|
|
-
|
|
|
-
|
|
|
2,737
|
|
|
66,791
|
|
Diavik
|
CAN
|
|
|
53,111
|
|
|
-
|
|
|
53,111
|
|
|
6,273
|
|
|
5,519
|
|
|
-
|
|
|
-
|
|
|
11,792
|
|
|
41,319
|
|
Hugo North Extension and Heruga
|
MNG
|
|
|
42,493
|
|
|
(7,142)
|
|
|
35,351
|
|
|
-
|
|
|
-
|
|
|
-
|
|
|
-
|
|
|
-
|
|
|
35,351
|
|
Karma
|
BFA
|
|
|
21,174
|
|
|
5,115
|
|
|
26,289
|
|
|
-
|
|
|
2,095
|
|
|
524
|
|
|
-
|
|
|
2,619
|
|
|
23,670
|
|
Ming
|
CAN
|
|
|
20,068
|
|
|
-
|
|
|
20,068
|
|
|
7,622
|
|
|
792
|
|
|
171
|
|
|
-
|
|
|
8,585
|
|
|
11,483
|
|
Santa Elena
|
MEX
|
|
|
23,342
|
|
|
-
|
|
|
23,342
|
|
|
17,202
|
|
|
2,001
|
|
|
105
|
|
|
-
|
|
|
19,308
|
|
|
4,034
|
|
Yamana silver stream
|
ARG
|
|
|
74,229
|
|
|
5
|
|
|
74,234
|
|
|
-
|
|
|
1,427
|
|
|
-
|
|
|
-
|
|
|
1,427
|
|
|
72,807
|
|
Royalties 1
|
|
|
|
206,724
|
|
|
21,191
|
|
|
227,915
|
|
|
106,393
|
|
|
6,592
|
|
|
-
|
|
|
2,507
|
|
|
115,492
|
|
|
112,423
|
|
Other 2
|
|
|
|
11,339
|
|
|
(614)
|
|
|
10,725
|
|
|
4,471
|
|
|
69
|
|
|
-
|
|
|
-
|
|
|
4,540
|
|
|
6,185
|
|
Total 3
|
|
|
$
|
593,429
|
|
$
|
19,900
|
|
$
|
613,329
|
|
$
|
179,066
|
|
$
|
27,654
|
|
$
|
1,317
|
|
$
|
2,507
|
|
$
|
210,544
|
|
$
|
402,785
|
|
|
|
|
1.
|
Includes Bracemac-McLeod, Coringa, Mt. Hamilton, Paul Isnard, Prairie Creek, Ann Mason, Gualcamayo, Emigrant Springs, Mine Waste Solutions, San Andres, Sao Francisco, Thunder Creek, Bomboré, the Early Gold Deposit, Hot Maden, Hackett River, Lobo-Marte, Agi Dagi & Kirazli, Forrestania and others.
|
|
2.
|
Includes Trek Mining (previously JDL) Stream and other.
|
|
3.
|
Total Mineral, royalty and other interests includes $99.7 million of assets located in Canada, $95.2 million in Argentina, $85.4 million in Brazil, $36.6 million in Mongolia, $26.8 million in Burkina Faso, $21.4 million in the United States, $10.3 million in Turkey, $4.1 million in South Africa, $4.0 million in Mexico, $5.2 million in French Guiana, $4.9 million in Peru, $3.3 million in Australia and $5.9 million in other countries.
|
UPDATE | Orezone
On January 26, 2017, Orezone Gold Corporation exercised its option to repurchase the royalty on the Bomboré gold project for $3.6 million, representing a 20% premium to the original upfront payment.
UPDATE | Bachelor Lake Stream
On September 29, 2017, the Company amended its Gold Stream with Metanor Resources Inc (“Metanor”). Beginning October 1, 2017, Sandstorm will purchase 20% of the gold produced from Metanor’s Bachelor Lake gold mine for a per ounce cash payment equal to the lesser of $500 and the then prevailing market price of gold, until 12,000 ounces of gold have been purchased by the Company at which time the Gold Stream will convert into a 3.9% net smelter returns (“NSR”) royalty. As part of the amendment, Metanor has agreed it will sell a minimum of 1,500 ounces of gold to Sandstorm on a quarterly basis until the 12,000 ounce threshold has been reached. Under the previous Gold Stream, there were no requirements for minimum deliveries nor was there a subsequent conversion of the Gold Stream into a NSR royalty. In consideration for entering into the amendment, Sandstorm received:
|
o
| |
a 3.9% NSR royalty on Metanor’s Barry project; and |
|
o
| |
$2.0 million in the common shares of Metanor. |
Metanor may elect to reduce the 3.9% NSR royalty on the Bachelor Lake or Barry projects by making a $2.0 million payment to Sandstorm in each case (the “Purchase Option”). Upon exercising either of the Purchase Options, the respective Sandstorm NSR royalty will decrease to 1.8%. In addition to the Gold Stream, Sandstorm has an already existing 1% NSR royalty on the Bachelor Lake gold mine, which remains unaffected by the amendment. In connection with the partial disposition of the stream, the Company recognized a $3.0 million gain in other income during the three months ended September 30, 2017.
A reduction in the mineral resource estimate for the Coringa gold project announced during the period prompted the Company to evaluate the carrying value of its royalty investment. As a result of this review, the Company recorded an impairment charge of $4.5 million. The recoverable amount of $3.4 million was determined using a discounted cash flow model in estimating the fair value less costs of disposal. Key assumptions used in the cash flow forecast were: a 5 year mine life, a long term gold price of $1,300 and a 6% discount rate.
|
|
|
|
5.
|
ACQUISITION OF MARIANA RESOURCES LIMITED
|
On July 3, 2017, Sandstorm completed its previously announced arrangement to acquire all the issued and ordinary shares of Mariana Resources Ltd. (that Sandstorm did not already own) (“Mariana”) (the “Arrangement”). Under the terms of the Arrangement and as consideration for the acquisition, the Company issued 32,685,228 common shares and paid an additional $47.3 million in cash. In addition, all outstanding stock options and warrant holders of Mariana received 0.3487 Sandstorm stock option or warrant for each Mariana stock option or warrant previously held. The transaction was accounted for as an asset acquisition, with the capitalized costs of $199.6 million being determined by reference to the fair value of the net assets acquired.
As part of the transaction, the Company acquired a 30% interest in the Hot Maden gold-copper project, located in the Artvin Province, northeastern Turkey (“Hot Maden”). The project is operated and co-owned by a Turkish partner, Lidya Madencilik Sanayi ve Ticaret A.S. (“Lydia”), who owns the remaining 70% interest in the project. On acquisition, the fair value ascribed to the interest was $190.7 million. In determining the fair value of the Company’s interest in Hot Maden, a discounted cash flow model was utilized. Key assumptions used in the analysis were a 7% discount rate, a long term gold price of $1,300 and an estimated mine life of 12-14 years.
In addition, the acquisition of Mariana included exploration properties in Côte d’Ivoire, Turkey, and Argentina. Sandstorm intends on selling the exploration properties and expects to retain NSR royalties as well as equity in the eventual spin-out. The fair value of $5.0 million ascribed to these assets was determined based on management’s best estimate of the recoverable value and took into consideration the exploration expenditures at the respective properties. The other assets acquired in the transaction included cash and other assets of approximately $5.0 million and accounts payable and accrued liabilities of approximately $1.1 million. Other key assumptions utilized in the fair value assessment of the replacement warrants and options included a risk-free annual interest rate of approximately 1%, an expected volatility of up to 30% and an expected average life of up to 1.6 years.
The Company’s 30% interest in Hot Maden represents an investment in an associate and will be accounted for in accordance with IAS 28 - Investments in associates and joint ventures.
As of and for the nine months ended September 30, 2017:
|
|
|
|
|
|
|
|
|
|
|
|
|
|
|
|
|
|
|
|
Fair Value
|
|
Net Additions
|
|
|
|
Fair Value
|
|
Fair Value
|
|
In $000s
|
|
January 1, 2017
|
|
(Disposals)
|
|
Transfers
|
|
Adjustment
|
|
September 30, 2017
|
|
Short-term investments
|
|
|
|
|
|
|
|
|
|
|
|
|
|
|
|
|
Convertible debt instruments2
|
|
$
|
-
|
|
$
|
-
|
|
$
|
12,153
|
|
$
|
44
|
|
$
|
12,197
|
|
Total short-term investments
|
|
$
|
-
|
|
$
|
-
|
|
$
|
12,153
|
|
$
|
44
|
|
$
|
12,197
|
|
Non-current investments
|
|
|
|
|
|
|
|
|
|
|
|
|
|
|
|
|
Common shares1
|
|
$
|
28,850
|
|
$
|
7,132
|
|
$
|
-
|
|
$
|
2,350
|
|
$
|
38,332
|
|
Warrants2
|
|
|
3,404
|
|
|
(1,995)
|
|
|
-
|
|
|
1,122
|
|
|
2,531
|
|
Convertible debt instruments2
|
|
|
29,039
|
|
|
(3,342)
|
|
|
(12,153)
|
|
|
249
|
|
|
13,793
|
|
Total non-current investments
|
|
$
|
61,293
|
|
$
|
1,795
|
|
$
|
(12,153)
|
|
$
|
3,721
|
|
$
|
54,656
|
|
|
|
|
|
|
|
|
|
|
|
|
|
|
|
|
|
|
Total Investments
|
|
$
|
61,293
|
|
$
|
1,795
|
|
$
|
-
|
|
$
|
3,765
|
|
$
|
66,853
|
|
|
|
|
1.
2.
|
Fair value adjustment recorded within Other Comprehensive Income for the period
Fair value adjustment recorded within Net Income for the period
|
On March 31, 2017, Luna Gold Corp (“Luna”) completed its previously announced merger with JDL Gold Corp creating Trek, a new multi-asset mining company. Concurrent with the closing of the transaction, the Loan Receivable that was owed by Luna to Sandstorm, in the amount of $20 million plus accrued interest, was settled in common shares and warrants in Trek. The Company recognized a gain of $1.8 million on the settlement of the debt.
As of and for the nine months ended September 30, 2016:
|
|
|
|
|
|
|
|
|
|
|
|
|
|
|
|
|
|
|
|
Fair Value
|
|
Net Additions
|
|
|
|
Fair Value
|
|
Fair Value
|
|
In $000s
|
|
January 1, 2016
|
|
(Disposals)
|
|
Transfers
|
|
Adjustment
|
|
September 30, 2016
|
|
Common shares1
|
|
$
|
14,990
|
|
$
|
(3,041)
|
|
$
|
-
|
|
$
|
21,897
|
|
$
|
33,846
|
|
Warrants2
|
|
|
35
|
|
|
(1,240)
|
|
|
-
|
|
|
5,624
|
|
|
4,419
|
|
Convertible debt instruments2
|
|
|
11,555
|
|
|
-
|
|
|
-
|
|
|
19,629
|
|
|
31,184
|
|
Total
|
|
$
|
26,580
|
|
$
|
(4,281)
|
|
$
|
-
|
|
$
|
47,150
|
|
$
|
69,449
|
|
|
|
|
1.
2.
|
Fair value adjustment recorded within Other Comprehensive Income for the period
Fair value adjustment recorded within Net Income for the period
|
|
|
|
|
|
|
7.
|
SHARE CAPITAL AND RESERVES
|
The Company is authorized to issue an unlimited number of common shares without par value.
Under the Company’s normal course issuer bid (“NCIB”), the Company is able until April 4, 2018, to purchase up to 7,597,730 common shares. The NCIB provides the Company with the option to purchase its common shares from time to time. During the nine months ended September 30, 2017 and pursuant to the NCIB, the Company purchased and cancelled approximately 3.3 million common shares.
|
|
|
|
|
|
B.
|
Stock Options of the Company
|
The Company has an incentive stock option plan (the “Option Plan”) whereby the Company may grant share options to eligible employees, officers, directors and consultants at an exercise price, expiry date, and vesting conditions to be determined by the Board of Directors. The maximum expiry date is five years from the grant date. All options are equity settled. The Option Plan permits the issuance of options which, together with the Company's other share compensation arrangements, may not exceed 8.5% of the Company’s issued common shares as at the date of the grant.
A summary of the Company’s options and the
changes for the period are as follows:
|
|
|
|
|
|
|
|
Note
|
Number of Options
|
|
Weighted Average Exercise Price (CAD$)
|
|
Options outstanding at December 31, 2015
|
|
6,855,582
|
|
C$ 5.45
|
|
Granted
|
|
1,336,000
|
|
4.96
|
|
Exercised
|
|
(1,516,402)
|
|
(4.63)
|
|
Expired unexercised
|
|
(440,000)
|
|
(6.35)
|
|
Options outstanding at December 31, 2016
|
|
6,235,180
|
|
4.71
|
|
Mariana Resources Ltd. replacement options
|
5
|
2,078,248
|
|
3.36
|
|
Exercised
|
|
(65,176)
|
|
(1.81)
|
|
Expired unexercised
|
|
(27,000)
|
|
(18.33)
|
|
Options outstanding at September 30, 2017
|
|
8,221,252
|
|
C$ 4.68
|
The weighted-average share price, at the time of exercise, for those shares that were exercised during the nine months ended September 30, 2017 was C$5.32 per share (C$7.16 – year ended December 31, 2016). The weighted average remaining contractual life of the options as at September 30, 2017 was 2.63 years (3.35 years – as at December 31, 2016).
A summary of the Company’s share purchase options
as of September 30, 2017 is as follows:
|
|
|
|
|
|
|
|
|
|
|
|
|
|
Year of expiry
|
|
Number
outstanding
|
|
Vested
|
|
Exercise price per share (range) (CAD$)
|
|
Weighted average exercise price per share (CAD$)1
|
|
2017
|
|
557,983
|
|
557,983
|
|
C$
|
|
0.96 - 18.33
|
|
C$
|
15.14
|
|
2018
|
|
199,481
|
|
199,481
|
|
|
|
2.88 - 11.31
|
|
|
4.99
|
|
2019
|
|
3,934,918
|
|
2,689,104
|
|
|
|
1.44 - 6.03
|
|
|
2.67
|
|
2020
|
|
1,284,000
|
|
428,005
|
|
|
|
3.60 - 3.64
|
|
|
3.61
|
|
2021
|
|
1,405,740
|
|
69,740
|
|
|
|
2.61 - 4.96
|
|
|
2.61
|
|
2022
|
|
839,130
|
|
839,130
|
|
|
|
4.79 - 15.00
|
|
|
4.82
|
|
|
|
8,221,252
|
|
4,783,443
|
|
|
|
|
|
|
4.68
|
|
|
|
|
1.
|
Weighted average exercise price of options that are exercisable
|
|
|
|
|
|
|
C.
|
Share Purchase Warrants
|
A summary of the Company’s warrants and the changes
for the period are as follows:
|
|
|
|
|
|
|
|
Note
|
Number of Warrants
|
|
Shares to be Issued Upon Exercise of the Warrants
|
|
Warrants outstanding at December 31, 2015
|
|
29,307,173
|
|
29,307,173
|
|
Expired unexercised
|
|
(1,256,662)
|
|
(1,256,662)
|
|
Exercised
|
|
(4,111)
|
|
(4,111)
|
|
Warrants outstanding at December 31, 2016
|
|
28,046,400
|
|
28,046,400
|
|
Mariana Resources Ltd. replacement warrants
|
5
|
2,025,314
|
|
2,025,314
|
|
Exercised
|
|
(503,816)
|
|
(503,816)
|
|
Expired unexercised
|
|
(5,002,500)
|
|
(5,002,500)
|
|
Warrants outstanding at September 30, 2017
|
|
24,565,398
|
|
24,565,398
|
A summary of the Company’s warrants as of
September 30, 2017 are as follows:
|
|
|
|
|
|
|
|
Number outstanding
|
|
Exercise Price per Share (CAD$)
|
|
Expiry Date
|
|
1,521,498
|
|
C$
|
1.20
|
|
May 6, 2018
|
|
3,000,000
|
|
|
4.50
|
|
March 23, 2020
|
|
15,000,000
|
|
|
3.50
|
|
October 27, 2020
|
|
5,043,900
|
|
|
4.00
|
|
November 3, 2020
|
|
24,565,398
|
|
|
|
|
|
|
|
|
|
|
|
D.
|
Restricted Share Rights
|
The Company has a restricted share plan (the “Restricted Share Plan”) whereby the Company may grant restricted share rights (“RSRs”) to eligible employees, officers, directors and consultants at an expiry date to be determined by the Board of Directors. Each restricted share right entitles the holder to receive a common share of the Company without any further consideration. The Restricted Share Plan permits the issuance of up to a maximum of 3,800,000 restricted share rights.
As at September 30, 2017, the Company had 1,896,805 RSRs outstanding.
|
|
|
|
|
|
E.
|
Diluted Earnings Per Share
|
Diluted earnings per share is calculated
based on the following:
|
|
|
|
|
|
|
|
|
|
|
|
|
|
|
|
|
3 Months Ended
|
|
3 Months Ended
|
|
9 Months Ended
|
|
9 Months Ended
|
|
In $000s
|
|
September 30, 2017
|
|
September 30, 2016
|
|
September 30, 2017
|
|
September 30, 2016
|
|
Net income for the period
|
|
$
|
4,773
|
|
$
|
6,915
|
|
$
|
9,828
|
|
$
|
25,273
|
|
|
|
|
|
|
|
|
|
|
|
|
|
|
|
Basic weighted average number of shares
|
|
|
182,242,318
|
|
|
150,392,588
|
|
|
162,170,852
|
|
|
141,444,093
|
|
Basic earnings per share
|
|
$
|
0.03
|
|
$
|
0.05
|
|
$
|
0.06
|
|
$
|
0.18
|
|
|
|
|
|
|
|
|
|
|
|
|
|
|
|
Effect of dilutive securities
|
|
|
|
|
|
|
|
|
|
|
|
|
|
Stock options
|
|
|
2,555,706
|
|
|
2,554,324
|
|
|
1,985,912
|
|
|
1,928,680
|
|
Warrants
|
|
|
4,767,350
|
|
|
7,080,078
|
|
|
3,141,447
|
|
|
2,474,666
|
|
Restricted share rights
|
|
|
1,543,816
|
|
|
1,188,556
|
|
|
1,541,517
|
|
|
1,097,175
|
|
Diluted weighted average number of common shares
|
|
|
191,109,190
|
|
|
161,215,546
|
|
|
168,839,728
|
|
|
146,944,614
|
|
Diluted earnings per share
|
|
$
|
0.02
|
|
$
|
0.04
|
|
$
|
0.06
|
|
$
|
0.17
|
The following table lists the number of stock options, warrants and RSRs excluded from the computation of diluted earnings per share because the exercise prices exceeded the average market value of the common shares of C$5.47 during the nine months ended September 30, 2017 (September 30, 2016 — C$5.46) or C$5.48 during the three months ended September 30, 2017 (September 30, 2016 – C$7.32) or because a performance obligation had not been met as at September 30, 2017:
|
|
|
|
|
|
|
|
|
|
|
|
|
|
|
|
|
3 Months Ended
|
|
3 Months Ended
|
|
9 Months Ended
|
|
9 Months Ended
|
|
|
|
September 30, 2017
|
|
September 30, 2016
|
|
September 30, 2017
|
|
September 30, 2016
|
|
Stock Options
|
|
|
2,024,770
|
|
|
614,108
|
|
|
1,968,800
|
|
|
2,079,836
|
|
Warrants
|
|
|
6,697,500
|
|
|
9,158,373
|
|
|
7,562,720
|
|
|
9,203,018
|
|
RSRs
|
|
|
-
|
|
|
-
|
|
|
-
|
|
|
9,231
|
The income tax expense differs from the amount that would result from applying the federal and provincial income tax rate to the net income before income taxes.
These differences result from the following items:
|
|
|
|
|
|
|
|
|
|
|
|
|
|
|
|
|
|
|
|
|
|
|
|
|
|
|
|
|
|
|
3 Months Ended
|
|
3 Months Ended
|
|
9 Months Ended
|
|
9 Months Ended
|
|
In $000s
|
|
September 30, 2017
|
|
September 30, 2016
|
|
September 30, 2017
|
|
September 30, 2016
|
|
Income before income taxes
|
|
$
|
6,794
|
|
$
|
8,422
|
|
$
|
13,926
|
|
$
|
30,101
|
|
Canadian federal and provincial income tax rates
|
|
|
26.0%
|
|
|
26.0%
|
|
|
26.0%
|
|
|
26.0%
|
|
Income tax expense based on the above rates
|
|
$
|
1,766
|
|
$
|
2,190
|
|
$
|
3,621
|
|
$
|
7,826
|
|
Increase (decrease) due to:
|
|
|
|
|
|
|
|
|
|
|
|
|
|
Non-deductible expenses and permanent differences
|
|
$
|
247
|
|
$
|
207
|
|
$
|
741
|
|
$
|
617
|
|
Change in deductible temporary differences
|
|
|
-
|
|
|
233
|
|
|
-
|
|
|
554
|
|
Change in unrecognized temporary differences
|
|
|
(23)
|
|
|
(525)
|
|
|
(58)
|
|
|
(2,167)
|
|
Non-taxable portion of capital gain or loss
|
|
|
(478)
|
|
|
(664)
|
|
|
(948)
|
|
|
(3,195)
|
|
Difference between statutory and foreign tax rates
|
|
|
228
|
|
|
-
|
|
|
573
|
|
|
-
|
|
Other
|
|
|
281
|
|
|
66
|
|
|
169
|
|
|
1,193
|
|
Income tax expense
|
|
$
|
2,021
|
|
$
|
1,507
|
|
$
|
4,098
|
|
$
|
4,828
|
|
|
|
|
|
|
9.
|
ADMINISTRATION EXPENSES
|
The administration expenses for the Company
are as follows:
|
|
|
|
|
|
|
|
|
|
|
|
|
|
|
|
|
|
|
|
|
|
|
|
|
|
|
|
|
|
|
3 Months Ended
|
|
3 Months Ended
|
|
9 Months Ended
|
|
9 Months Ended
|
|
In $000s
|
|
September 30, 2017
|
|
September 30, 2016
|
|
September 30, 2017
|
|
September 30, 2016
|
|
Corporate administration
|
|
$
|
650
|
|
$
|
243
|
|
$
|
1,394
|
|
$
|
1,017
|
|
Employee benefits and salaries
|
|
|
439
|
|
|
290
|
|
|
1,154
|
|
|
1,003
|
|
Professional fees
|
|
|
218
|
|
|
223
|
|
|
478
|
|
|
562
|
|
Depreciation
|
|
|
20
|
|
|
52
|
|
|
103
|
|
|
155
|
|
Administration expenses before share based compensation
|
|
$
|
1,327
|
|
$
|
808
|
|
$
|
3,129
|
|
$
|
2,737
|
|
|
|
|
|
|
|
|
|
|
|
|
|
|
|
Equity settled share based compensation
(a non-cash expense)
|
|
|
539
|
|
|
278
|
|
|
1,620
|
|
|
834
|
|
Total administration expenses
|
|
$
|
1,866
|
|
$
|
1,086
|
|
$
|
4,749
|
|
$
|
3,571
|
|
|
|
|
|
|
10.
|
SUPPLEMENTAL CASH FLOW INFORMATION
|
|
|
|
|
|
|
|
|
|
|
|
|
|
|
|
|
|
|
|
|
|
|
|
|
|
|
|
|
|
|
|
3 Months Ended
|
|
3 Months Ended
|
|
9 Months Ended
|
|
9 Months Ended
|
|
In $000s
|
|
September 30, 2017
|
|
September 30, 2016
|
|
September 30, 2017
|
|
September 30, 2016
|
|
Change in non-cash working capital:
|
|
|
|
|
|
|
|
|
|
|
|
|
|
Trade receivables and other
|
|
$
|
112
|
|
$
|
(472)
|
|
$
|
(488)
|
|
$
|
(1,009)
|
|
Trade and other payables
|
|
|
669
|
|
|
(981)
|
|
|
1,033
|
|
|
429
|
|
Net increase (decrease) in cash
|
|
$
|
781
|
|
$
|
(1,453)
|
|
$
|
545
|
|
$
|
(580)
|
|
Significant non-cash transactions:
|
|
|
|
|
|
|
|
|
|
|
|
|
|
Shares and replacement equity awards issued for Mariana acquisition
|
|
$
|
131,354
|
|
$
|
-
|
|
$
|
131,354
|
|
$
|
-
|
|
Shares issued for acquisition of mineral, royalty and other interests
|
|
|
-
|
|
|
3,500
|
|
|
-
|
|
|
20,892
|
|
|
|
|
|
|
11.
|
KEY MANAGEMENT COMPENSATION
|
The remuneration of directors and those persons having authority and responsibility for planning, directing and controlling activities of the Company are as follows:
|
|
|
|
|
|
|
|
|
|
|
|
|
|
|
|
|
|
|
|
|
|
|
|
|
|
|
|
|
|
|
3 Months Ended
|
|
3 Months Ended
|
|
9 Months Ended
|
|
9 Months Ended
|
|
In $000s
|
|
September 30, 2017
|
|
September 30, 2016
|
|
September 30, 2017
|
|
September 30, 2016
|
|
Employee salaries and benefits
|
|
$
|
300
|
|
$
|
284
|
|
$
|
864
|
|
$
|
840
|
|
Share-based payments
|
|
|
651
|
|
|
517
|
|
|
1,939
|
|
|
1,546
|
|
Total key management compensation expense
|
|
$
|
951
|
|
$
|
801
|
|
$
|
2,803
|
|
$
|
2,386
|
|
|
|
|
|
|
12.
|
CONTRACTUAL OBLIGATIONS
|
In connection with its commodity streams, the Company has committed to purchase the following:
|
|
|
|
|
|
|
|
|
|
|
|
|
Stream
|
|
% of Life of Mine Gold
or Relevant Commodity 5,6,7,8,9
|
|
Per Ounce Cash Payment:
lesser of amount below and the then prevailing market price of the commodity (unless otherwise noted) 1, 2, 3, 4
|
|
Bachelor Lake
|
|
20%
|
|
$500
|
|
Black Fox
|
|
8%
|
|
$531
|
|
Chapada
|
|
4.2%
|
|
30% of copper spot price
|
|
Entrée
|
|
5.62% on Hugo North Extension
and 4.26% on Heruga
|
|
$220
|
|
Karma
|
|
26,875 ounces over 5 years
and 1.625% thereafter
|
|
20% of gold spot price
|
|
Ming
|
|
25% of the first 175,000 ounces of gold produced, and 12% thereafter
|
|
$nil
|
|
Santa Elena
|
|
20%
|
|
$450
|
|
Yamana silver stream
|
|
Varies
|
|
30% of silver spot price
|
|
|
|
|
1.
|
Subject to an annual inflationary adjustment except for Ming
|
|
2.
|
For the Entrée Gold stream, after approximately 8.6 million ounces of gold have been produced from the joint venture property, the price increases to $500 per gold ounce.
|
|
3.
|
For the Entrée silver stream, percentage of life of mine is 5.62% on Hugo North Extension and 4.26% on Heruga which the Company can purchase for the lesser of the prevailing market price and $5 per ounce of silver until 40.3 million ounces of silver have been produced from the entire joint venture property. Thereafter, the purchase price will increase to the lesser of the prevailing market price and $10 per ounce of silver.
|
|
4.
|
For the Santa Elena Gold Stream, the Company can purchase gold for a per ounce cash payment equal to the lesser of $450 and the then prevailing market price of gold.
|
|
5.
|
For the Entrée Gold and silver stream, percentage of life of mine is 5.62% on Hugo North Extension and 4.26% on Heruga if the minerals produced are contained below 560 meters in depth.
|
|
6.
|
For the Entrée Gold and silver stream, percentage of life of mine is 8.43% on Hugo North Extension and 6.39% on Heruga if the minerals produced are contained above 560 meters in depth.
|
|
7.
|
For the Entrée copper stream, the Company has committed to purchase an amount equal to 0.42% of the copper produced from the Hugo North Extension and Heruga deposits. If the minerals produced are contained above 560 meters in depth, then the commitment increases to 0.62% for both the Hugo North Extension and Heruga deposits. Sandstorm will make ongoing per pound cash payments equal to the lesser of $0.50 and the then prevailing market price of copper, until 9.1 billion pounds of copper have been produced from the entire joint venture property. Thereafter, the on-going per pound payments will increase to the lesser of $1.10 and the then prevailing market price of copper.
|
|
8.
|
For the Chapada copper stream, the Company has committed to purchase an amount equal to 4.2% of the copper produced (up to an annual maximum of 3.9 million pounds of copper) until Yamana has delivered 39 million pounds of copper to Sandstorm; then 3.0% of the copper produced until, on a cumulative basis, Yamana has delivered 50 million pounds of copper to Sandstorm; then 1.5% of the copper produced thereafter, for the life of the mine. If Cerro Moro has not achieved the Commencement of Production and Sandstorm has not received cumulative pre-tax cash flow equal to $70 million from the Yamana silver stream, then the First Chapada Delivery Threshold and the Second Chapada Delivery Threshold will cease to be in effect and Sandstorm will continue to purchase 4.2% of Chapada’s payable copper production (up to an annual maximum of 3.9 million pounds of copper), until such time as Sandstorm has received cumulative pre-tax cash flow equal to $70 million, or Cerro Moro has achieved the Commencement of Production.
|
|
9.
|
Under the terms of the Yamana silver stream, Sandstorm has agreed to purchase an amount of silver from Cerro Moro equal to 20% of the silver produced (up to an annual maximum of 1.2 million ounces of silver), until Yamana has delivered to Sandstorm 7.0 million ounces of silver; then 9.0% of the silver produced thereafter. As part of the Yamana silver stream, through 2018, Sandstorm has also agreed to purchase an amount of silver from: (i) the Minera Florida mine in Chile equal to 38% of the silver produced (up to an annual maximum of 200,000 ounces of silver); and (ii) the Chapada mine in Brazil equal to 52% of the silver produced (up to an annual maximum of 100,000 ounces of silver).
|
|
|
|
|
|
|
13.
|
SEGMENTED INFORMATION
|
The Company’s reportable operating segments, which are components of the Company’s business where separate financial information is available and which are evaluated on a regular basis by the Company’s Chief Executive Officer, who is the Company’s chief operating decision maker, for the purpose of assessing performance, are summarized in the tables below:
For the three months ended September 30, 2017
|
|
|
|
|
|
|
|
|
|
|
|
|
|
|
|
|
|
|
|
|
|
|
|
In $000s
|
|
Sales
|
|
Royalty revenue
|
|
Cost of sales, excluding depletion
|
|
Depletion
|
|
Impairment of mineral, royalty and other interests
|
|
Income (loss) before taxes
|
|
Cash flow
from operating
activities
|
|
Bachelor Lake, Canada
|
|
$
|
1,495
|
|
$
|
83
|
|
$
|
599
|
|
$
|
973
|
|
$
|
-
|
|
$
|
6
|
|
$
|
861
|
|
Black Fox, Canada
|
|
|
1,716
|
|
|
-
|
|
|
735
|
|
|
653
|
|
|
-
|
|
|
328
|
|
|
1,115
|
|
Chapada, Brazil
|
|
|
2,644
|
|
|
-
|
|
|
774
|
|
|
931
|
|
|
-
|
|
|
939
|
|
|
1,870
|
|
Diavik, Canada
|
|
|
-
|
|
|
2,240
|
|
|
-
|
|
|
1,244
|
|
|
-
|
|
|
996
|
|
|
1,840
|
|
Karma, Burkina Faso
|
|
|
1,351
|
|
|
-
|
|
|
268
|
|
|
671
|
|
|
-
|
|
|
412
|
|
|
974
|
|
Ming, Canada
|
|
|
291
|
|
|
-
|
|
|
-
|
|
|
125
|
|
|
-
|
|
|
166
|
|
|
291
|
|
Santa Elena, Mexico
|
|
|
2,922
|
|
|
-
|
|
|
840
|
|
|
265
|
|
|
-
|
|
|
1,817
|
|
|
2,013
|
|
Yamana silver stream, Argentina
|
|
|
981
|
|
|
-
|
|
|
285
|
|
|
561
|
|
|
-
|
|
|
135
|
|
|
695
|
|
Other Royalties 1
|
|
|
-
|
|
|
4,082
|
|
|
-
|
|
|
1,704
|
|
|
-
|
|
|
2,378
|
|
|
3,818
|
|
Other
|
|
|
134
|
|
|
-
|
|
|
11
|
|
|
42
|
|
|
-
|
|
|
81
|
|
|
124
|
|
Corporate
|
|
|
-
|
|
|
-
|
|
|
-
|
|
|
-
|
|
|
-
|
|
|
(464)
|
|
|
(1,737)
|
|
Consolidated
|
|
$
|
11,534
|
|
$
|
6,405
|
|
$
|
3,512
|
|
$
|
7,169
|
|
$
|
-
|
|
$
|
6,794
|
|
$
|
11,864
|
|
|
|
|
1.
|
Where a mineral interest represents less than 10% of the Company’s sales, gross margin or aggregate asset book value and represents a royalty on gold, silver or other metal, the royalty interest has been summarized under Other Royalties. Other Royalties includes royalty revenue from Bracemac-McLeod, Gualcamayo, Emigrant Springs, Mine Waste Solutions, San Andres, Thunder Creek, Forrestania and Sheerness. Includes royalty revenue from royalty interests located in Canada of $1.5 million, in the United States of $1.3 million, in South and Central America of $1.1 million and other of $0.2 million.
|
For the three months ended September 30, 2016
|
|
|
|
|
|
|
|
|
|
|
|
|
|
|
|
|
|
|
|
|
|
|
|
In $000s
|
|
Sales
|
|
Royalty revenue
|
|
Cost of sales, excluding depletion
|
|
Depletion
|
|
Impairment of mineral, royalty and other interests
|
|
Income (loss) before taxes
|
|
Cash flow
from operating
activities
|
|
Bachelor Lake, Canada
|
|
$
|
2,561
|
|
$
|
96
|
|
$
|
958
|
|
$
|
1,023
|
|
$
|
-
|
|
$
|
676
|
|
$
|
1,898
|
|
Black Fox, Canada
|
|
|
1,314
|
|
|
-
|
|
|
515
|
|
|
439
|
|
|
-
|
|
|
360
|
|
|
578
|
|
Chapada, Brazil
|
|
|
1,643
|
|
|
-
|
|
|
489
|
|
|
707
|
|
|
-
|
|
|
447
|
|
|
1,154
|
|
Diavik, Canada
|
|
|
-
|
|
|
1,570
|
|
|
-
|
|
|
1,070
|
|
|
-
|
|
|
500
|
|
|
1,670
|
|
Karma, Burkina Faso
|
|
|
1,669
|
|
|
-
|
|
|
333
|
|
|
785
|
|
|
-
|
|
|
551
|
|
|
1,336
|
|
Ming, Canada
|
|
|
802
|
|
|
-
|
|
|
-
|
|
|
282
|
|
|
-
|
|
|
520
|
|
|
802
|
|
Santa Elena, Mexico
|
|
|
2,601
|
|
|
-
|
|
|
704
|
|
|
359
|
|
|
-
|
|
|
1,538
|
|
|
1,897
|
|
Yamana silver stream, Argentina
|
|
|
712
|
|
|
-
|
|
|
212
|
|
|
306
|
|
|
-
|
|
|
194
|
|
|
500
|
|
Other Royalties 1
|
|
|
-
|
|
|
3,847
|
|
|
-
|
|
|
2,354
|
|
|
1,139
|
|
|
354
|
|
|
3,595
|
|
Corporate
|
|
|
-
|
|
|
-
|
|
|
-
|
|
|
-
|
|
|
-
|
|
|
3,282
|
|
|
(3,117)
|
|
Consolidated
|
|
$
|
11,302
|
|
$
|
5,513
|
|
$
|
3,211
|
|
$
|
7,325
|
|
$
|
1,139
|
|
$
|
8,422
|
|
$
|
10,313
|
|
|
|
|
1.
|
Where a mineral interest represents less than 10% of the Company’s sales, gross margin or aggregate asset book value and represents a royalty on gold, silver or other metal, the royalty interest has been summarized under Other Royalties. Other Royalties includes royalty revenue from Bracemac-McLeod, Gualcamayo, Emigrant Springs, Mine Waste Solutions, San Andres, Thunder Creek, Copper Mountain and Sheerness. Includes royalty revenue from royalty interests located in Canada of $1.8 million, in the United States of $0.8 million, and other of $1.2 million.
|
For the nine months ended September 30, 2017
|
|
|
|
|
|
|
|
|
|
|
|
|
|
|
|
|
|
|
|
|
|
|
|
In $000s
|
|
Sales
|
|
Royalty revenue
|
|
Cost of sales, excluding depletion
|
|
Depletion
|
|
Impairment of mineral, royalty and other interests
|
|
Income (loss) before taxes
|
|
Cash flow
from operating
activities
|
|
Bachelor Lake, Canada
|
|
$
|
5,953
|
|
$
|
313
|
|
$
|
2,405
|
|
$
|
3,678
|
|
$
|
-
|
|
$
|
183
|
|
$
|
3,737
|
|
Black Fox, Canada
|
|
|
4,927
|
|
|
-
|
|
|
2,112
|
|
|
1,867
|
|
|
-
|
|
|
948
|
|
|
2,908
|
|
Chapada, Brazil
|
|
|
7,890
|
|
|
-
|
|
|
2,351
|
|
|
2,830
|
|
|
-
|
|
|
2,709
|
|
|
5,539
|
|
Diavik, Canada
|
|
|
-
|
|
|
5,403
|
|
|
-
|
|
|
4,093
|
|
|
-
|
|
|
1,310
|
|
|
5,034
|
|
Karma, Burkina Faso
|
|
|
4,940
|
|
|
-
|
|
|
983
|
|
|
2,504
|
|
|
-
|
|
|
1,453
|
|
|
3,946
|
|
Ming, Canada
|
|
|
796
|
|
|
-
|
|
|
-
|
|
|
356
|
|
|
-
|
|
|
440
|
|
|
796
|
|
Santa Elena, Mexico
|
|
|
8,408
|
|
|
-
|
|
|
2,446
|
|
|
814
|
|
|
-
|
|
|
5,148
|
|
|
5,662
|
|
Yamana silver stream, Argentina
|
|
|
3,074
|
|
|
-
|
|
|
913
|
|
|
1,635
|
|
|
-
|
|
|
526
|
|
|
2,160
|
|
Other Royalties 1
|
|
|
-
|
|
|
10,883
|
|
|
-
|
|
|
5,261
|
|
|
4,534
|
|
|
1,088
|
|
|
10,742
|
|
Other
|
|
|
242
|
|
|
-
|
|
|
20
|
|
|
77
|
|
|
-
|
|
|
145
|
|
|
219
|
|
Corporate
|
|
|
-
|
|
|
-
|
|
|
-
|
|
|
-
|
|
|
-
|
|
|
(24)
|
|
|
(5,829)
|
|
Consolidated
|
|
$
|
36,230
|
|
$
|
16,599
|
|
$
|
11,230
|
|
$
|
23,115
|
|
$
|
4,534
|
|
$
|
13,926
|
|
$
|
34,914
|
|
|
|
|
1.
|
Where a mineral interest represents less than 10% of the Company’s sales, gross margin or aggregate asset book value and represents a royalty on gold, silver or other metal, the royalty interest has been summarized under Other Royalties. Other Royalties includes royalty revenue from Bracemac-McLeod, Gualcamayo, Emigrant Springs, Mine Waste Solutions, San Andres, Thunder Creek, Copper Mountain, Forrestania and Sheerness. Includes royalty revenue from royalty interests located in Canada of $4.1 million, in the United States of $3.2 million, in South and Central America of $3.0 million and other of $0.6 million.
|
For the nine months ended September 30, 2016
|
|
|
|
|
|
|
|
|
|
|
|
|
|
|
|
|
|
|
|
|
|
|
|
In $000s
|
|
Sales
|
|
Royalty revenue
|
|
Cost of sales, excluding depletion
|
|
Depletion
|
|
Impairment of mineral, royalty and other interests
|
|
Income (loss) before taxes
|
|
Cash flow
from operating
activities
|
|
Bachelor Lake, Canada
|
|
$
|
6,486
|
|
$
|
333
|
|
$
|
2,587
|
|
$
|
2,859
|
|
$
|
-
|
|
$
|
1,373
|
|
$
|
4,106
|
|
Black Fox, Canada
|
|
|
4,022
|
|
|
-
|
|
|
1,688
|
|
|
1,443
|
|
|
-
|
|
|
891
|
|
|
1,994
|
|
Chapada, Brazil
|
|
|
3,931
|
|
|
-
|
|
|
1,192
|
|
|
1,820
|
|
|
-
|
|
|
919
|
|
|
2,739
|
|
Diavik, Canada
|
|
|
-
|
|
|
4,695
|
|
|
-
|
|
|
3,946
|
|
|
-
|
|
|
749
|
|
|
4,571
|
|
Karma, Burkina Faso
|
|
|
3,219
|
|
|
-
|
|
|
644
|
|
|
1,571
|
|
|
-
|
|
|
1,004
|
|
|
2,575
|
|
Ming, Canada
|
|
|
1,170
|
|
|
-
|
|
|
-
|
|
|
387
|
|
|
-
|
|
|
783
|
|
|
1,170
|
|
Santa Elena, Mexico
|
|
|
9,754
|
|
|
-
|
|
|
2,794
|
|
|
1,699
|
|
|
-
|
|
|
5,261
|
|
|
6,960
|
|
Yamana silver stream, Argentina
|
|
|
2,037
|
|
|
-
|
|
|
609
|
|
|
991
|
|
|
-
|
|
|
437
|
|
|
1,428
|
|
Other Royalties 1
|
|
|
-
|
|
|
10,216
|
|
|
-
|
|
|
5,020
|
|
|
2,507
|
|
|
2,689
|
|
|
10,153
|
|
Other
|
|
|
45
|
|
|
-
|
|
|
4
|
|
|
15
|
|
|
-
|
|
|
26
|
|
|
40
|
|
Corporate
|
|
|
-
|
|
|
-
|
|
|
-
|
|
|
-
|
|
|
-
|
|
|
15,969
|
|
|
(6,803)
|
|
Consolidated
|
|
$
|
30,664
|
|
$
|
15,244
|
|
$
|
9,518
|
|
$
|
19,751
|
|
$
|
2,507
|
|
$
|
30,101
|
|
$
|
28,933
|
|
|
|
|
1.
|
Where a mineral interest represents less than 10% of the Company’s sales, gross margin or aggregate asset book value and represents a royalty on gold, silver or other metal, the royalty interest has been summarized under Other Royalties. Other Royalties includes royalty revenue from Bracemac-McLeod, Gualcamayo, Emigrant Springs, Mine Waste Solutions, San Andres, Thunder Creek, Copper Mountain and Sheerness. Includes royalty revenue from royalty interests located in Canada of $3.7 million, in the United States of $1.7 million, and other of $4.8 million.
|
Total assets as of:
|
|
|
|
|
|
|
|
|
|
In $000s
|
|
September 30, 2017
|
1
|
December 31, 2016
|
1
|
|
Aurizona
|
|
$
|
10,723
|
|
$
|
10,723
|
|
|
Bachelor Lake
|
|
|
1,668
|
|
|
5,268
|
|
|
Black Fox
|
|
|
12,257
|
|
|
13,946
|
|
|
Chapada
|
|
|
63,961
|
|
|
66,791
|
|
|
Diavik
|
|
|
38,725
|
|
|
42,450
|
|
|
Entrée
|
|
|
35,351
|
|
|
35,351
|
|
|
Hot Maden
|
|
|
196,679
|
|
|
-
|
|
|
Karma
|
|
|
21,967
|
|
|
24,389
|
|
|
Ming
|
|
|
11,299
|
|
|
11,653
|
|
|
Santa Elena
|
|
|
3,831
|
|
|
4,345
|
|
|
Yamana silver stream
|
|
|
71,174
|
|
|
72,807
|
|
|
Other Royalties 2
|
|
|
100,532
|
|
|
114,662
|
|
|
Other 3
|
|
|
9,620
|
|
|
6,190
|
|
|
Corporate
|
|
|
89,398
|
|
|
126,307
|
|
|
Consolidated
|
|
$
|
667,185
|
|
$
|
534,882
|
|
|
|
|
|
1.
|
Includes related accounts receivables and payables in relation to the respective properties.
|
|
2.
|
Where a mineral interest represents less than 10% of the Company’s sales, gross margin or aggregate asset book value and represents a royalty on gold, silver or other metal, the royalty interest has been summarized under Other Royalties. Includes Bracemac-McLeod, Coringa, Mt. Hamilton, Paul Isnard, Prairie Creek, Ann Mason, Gualcamayo, Emigrant Springs, Mine Waste Solutions, San Andres, Thunder Creek, Hackett River, Lobo-Marte, Agi Dagi & Kirazli and other.
|
|
3.
|
Includes Trek Mining (previously JDL) Stream and other.
|
On October 25, 2017, the Company agreed to sell $18.2 million in debt and equity securities of Trek Mining Inc. to Mr. Ross Beaty. The sale is conditional upon the closing of the announced business combination between Trek Mining Inc., NewCastle Gold Ltd. and Anfield Gold Corp.