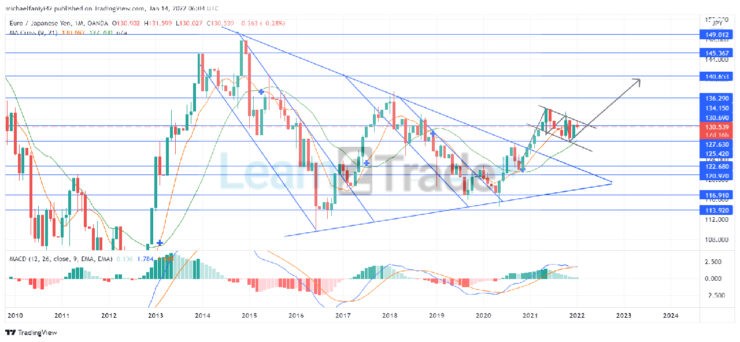
The annual forecast for EURJPY is for it to scale new heights, having conformed to a bullish flag formation. The bullish flag formation, an offshoot of the triangle pattern, began towards the tail end of 2020 as bulls began to exercise dominance in the market. The market began to recover from the 116.910 support level in May 2020. It pulled back when it first hit the upper border of its triangle pattern and surged through it at the second time of asking, thereby leading to the creation of the flag pattern.
EURJPYJPY Significant Zones
Supply Zones: 134.150, 140.650, 149.010
Demand Zones: 113.920, 116.910, 127.630
 EURJPY Long Term Plan: Bullish
A bearish impact is visible annually in the market, notably since 2013. Every time EURJPY makes a bullish move, the move is cut off prematurely and it always leads to a plunge back around the 113.920 demand level. This happened from 2013 to 2016, and then from 2017 to 2020. The result is a triangle-tapered market structure. By June 2020, the price hit the 116.910 demand level and began another ascent, but this time, it eventually broke the triangle pattern on 2021 New Year’s Day.
The flag pole was formed as the price surged from 120.920 and was stopped abruptly at 134.150. Subsequently, EURJPY began cranking through a downward channel. This continued into the year 2022. The market forecast is for an upward liquidity flow. The upward signal of the MA Cross is still very valid. Meanwhile, the Moving Average Convergence Divergence indicator is showing dwindling bullish bars. This is due to the downward ranging in the market. Its signal lines remain above the zero level.
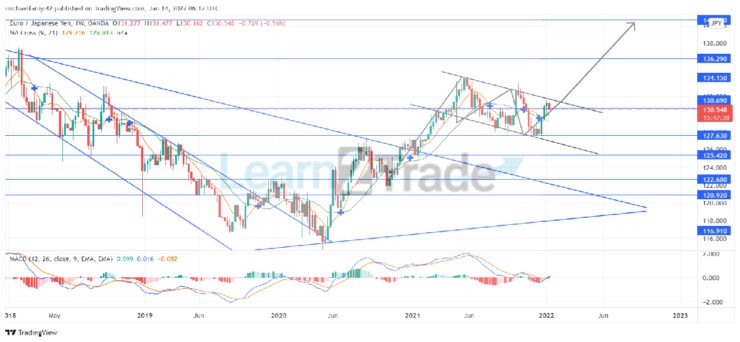 EURJPY Medium Term Plan: Bearish
In early 2022, prices are set to drop after hitting the upper border of the ranging channel. The MA Cross is directed down-sideways to show the undulating nature of the current market. The same can be said for the MACD indicator.
The annual forecast is towards the end of the year 2022 into early 2023 when the bullish flag pattern is anticipated to drive the market upward towards 140.650.
Source: https://learn2.trade