


Key Resistance Levels: 150.000, 152.000, 154.000
Key Support Levels: 146.000, 144.000, 142.000
GBP/JPY Price Long-term Trend: Bearish
GBP/JPY pair is in a downtrend. The currency price is making a series of lower highs and lower lows. Today, the pair is approaching the overbought region at level 152.06. The selling pressure will resume in the overbought region. Meanwhile, on June 21 downtrend; a retraced candle body tested the 38.2 % retracement level. The retracement indicates that the Pound will fall to level 2.618 Fibonacci extension or level 143.37.

Daily Chart Indicators Reading:
The pair is at level 47 of the Relative Strength Index period 14. This indicates that the pair is in the downtrend zone and below the centerline 50. The 21-day and 50-day SMAs are sloping downward. The price bars are below the SMAs which indicates further downside.
GBP/JPY Medium-term Trend: Bearish
On the 4-hour chart, the pair is in a downward move. The pair is presently trading in the overbought region of the market. Meanwhile, on July 8 downtrend; a retraced candle body tested the 38.2 % retracement level. The retracement indicates that the Pound will fall to level 2.618 Fibonacci extension or level 145.37.
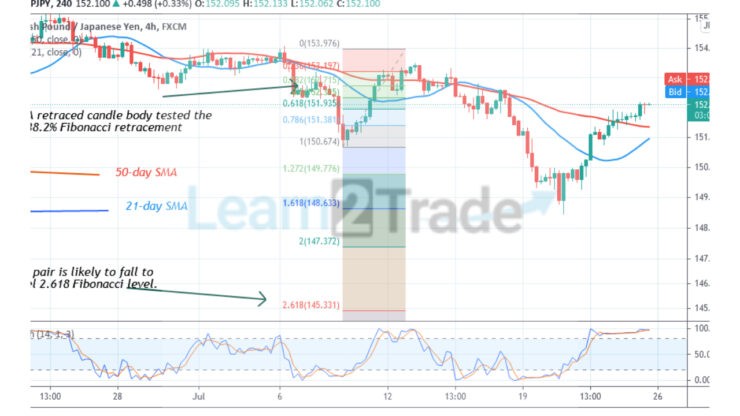
4-hour Chart Indicators Reading
The currency pair is above the 80% range of the daily stochastic. It indicates that the pair is in the overbought region of the market. The pair has been trading in the overbought region for the past three days. Sellers are likely to emerge in the overbought region to push prices down.
General Outlook for GBP/JPY
The GBP/JPY pair is in a downward move. The market is currently in the overbought region. The pair will soon resume selling pressure as the pair faces rejection at the recent high. According to the Fibonacci tool, the pair will reach the low of level 145.37.
Source: https://learn2.trade


