An increase in the bears’ pressure may penetrate the $0.21 level; the price may decrease further to $0.17 and $0.10. In case the support level of $0.21 holds, the price may reverse and the resistance levels of $0.28, $0.39, and $0.49 may be tested.
Key Levels:
Resistance levels: $0.28, $0.39, $0.49
Support levels: $0.21, $0.17, $0.10
XRP/USD Long-term Trend: Ranging
XRPUSD is on the ranging mode in the daily chart. The coin is range-bound within the resistance level of $0.28 and the support level of $0.21. XRPUSD started the ranging movement on December 30. The bears made an attempt to break down the support level of $0.21 failed due to low bearish momentum. Today, the bears try to penetrate the resistance level of $0.28 but the level holds and the price could not break it up. Ranging movement will continue until there is a breakout.
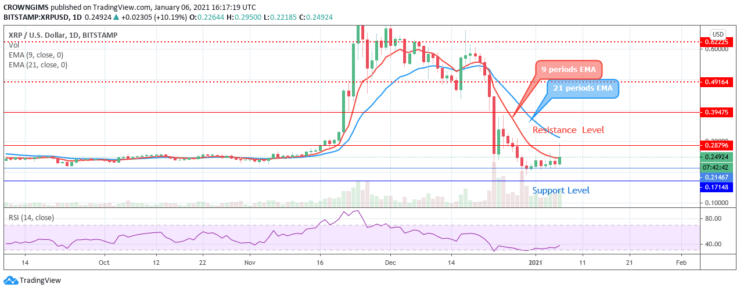
XRPUSD is struggling to breakout at the two key levels but the levels hold the price. An increase in the bears’ pressure may penetrate the $0.21 level; the price may decrease further to $0.17 and $0.10. In case the support level of $0.21 holds, the price may reverse and the resistance levels of $0.28, $0.39, and $0.49 may be tested. However, the price retains its trading below 9 periods EMA and the 21 periods EMA, the former is below the later. The relative strength index period 14 is at 25 levels bending up to indicate a buy signal.
XRP/USD Medium-term Trend: Ranging
On the medium-term outlook, XRPUSD remains in the ranging mode. The bears’ momentum and the bulls’ momentum are at equilibrium within the $0.28 and $0.21 levels. The support level of $0.21 is resisting the bears. The bears lose their momentum and the bulls’ pressure is equally weak. The price results in consolidation within $0.28 and $0.21 price levels.
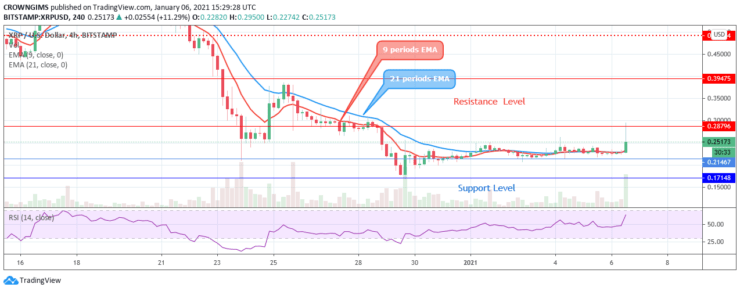
The fast-moving average is interlocked with the slow-moving average. The price is hovering over the 9 periods EMA and 21 periods EMA which indicates that consolidation is ongoing. However, the relative strength index period 14 is bending up at 60 levels to indicate a buy signal.
Source: https://learn2.trade