Ripple coin experienced a major breakout on the 8th of November after a massive liquidity purge. The lows at $0.450 were swept by the sellers. The price of the coin crashed until the downward move halted at $0.320. The market has formed a rising triangle, which shows that XRP is set for a breakout.
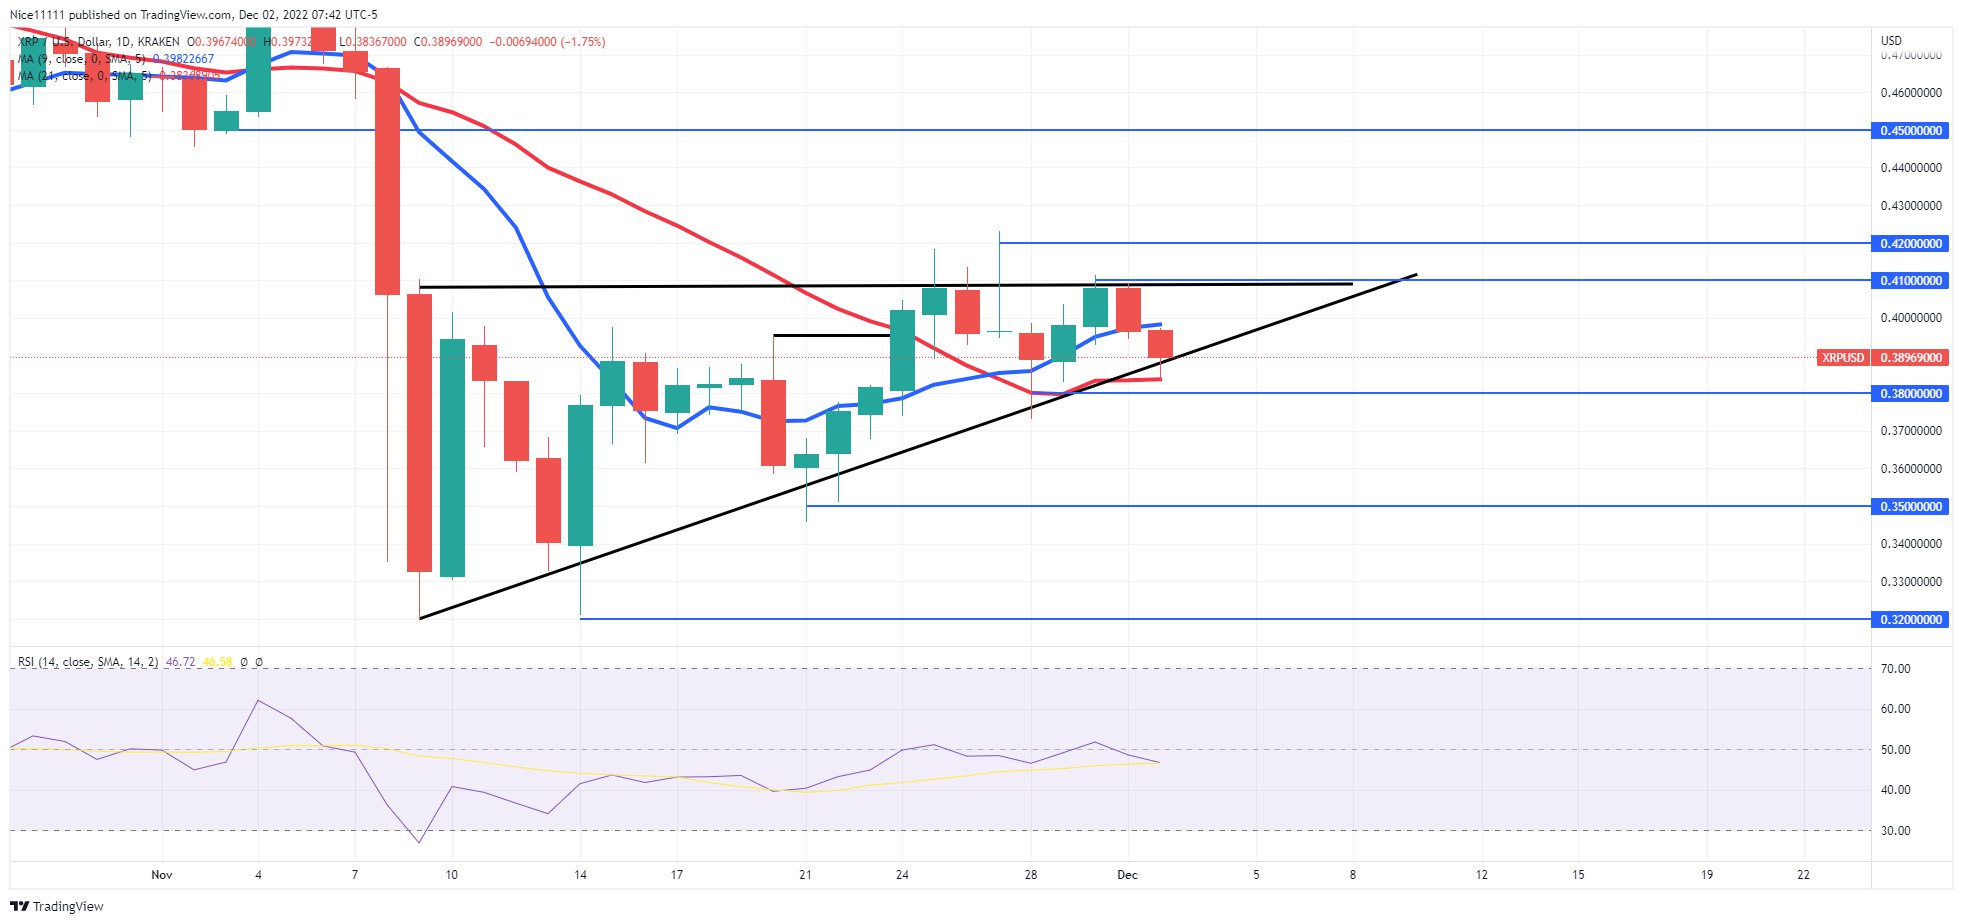
Demand Levels: $0.450, $0.420, $0.410
Supply Levels: $0.380, $0.350, $0.320
What Are the Indicators Saying?
The market is currently moving sideways. Bulls and Bears haven’t been able to create any massive displacement for several days. The Moving Averages period nine is resting above the daily candle while the Moving Average period twenty-one is resting below the daily candle. This shows the current indecisiveness of the market. The Stochastic indicator is also at equilibrium. A bullish wave is likely to be initiated if the $0.420 resistance level is broken. On the other hand, a bearish wave is likely to be initiated if the $0.350 support level is broken.
Learn from market wizards: Books to take your trading to the next level