(CSE: SPEY) (OTC:SPEYF) The Booming Lithium Market And A Small Company That Uncovered How To Tap In!
May 11 2021 - 8:00AM
InvestorsHub NewsWire

As you may know, lithium is the key
component in rechargeable lithium-ion batteries. Every smartphone
and electric vehicle in the world needs one to operate. And given
the anti-carbon fuel zeitgeist today, it's no surprise that
the demand for lithium is
booming!
In 2020, the global market size for lithium was
valued at 3.39 billion USD. By 2027, that's forecasted to grow at a
compounded annual growth rate (CAGR) of 1.9% to reach a valuation
of 4.93 billion.
All signs suggest the gains are likely to continue
into the future.

After a decade of rapidly falling costs, the rechargeable
lithium-ion battery is poised to
disrupt industries!

(CSE: SPEY) (OTC:SPEYF) Spey Resources Acquires
Tech One Lithium Resources
Corp.
Titans of the automotive industry seem to
agree. General Motors Co. has announced that
it hopes to phase out
gasoline and diesel-powered vehicles worldwide
by 2035.
As countries across the globe focus more and more
on meeting target emission standards,
the electrical
vehicles (EV) market is
expected to stimulate the demand for lithium in the coming
years.
“The planned production capacity of key Lithium ion
battery producers of the world, such as Tesla, CATL, Panasonic,
BYD, and LG Chem, is expected to be 465 GW by the end of 2020.
Moreover, for 2023, the planned capacity of Li-ion battery has
surpassed 1,000 GWh.” Meaning, the need for
lithium is projected to increase significantly by
2023.
Yet
it’s not just electric vehicles that are relying on more and more
lithium as time goes on!
In Texas, lithium batteries are
becoming more and more essential in the electric grid.
At the end of 2020, installed batteries could
deliver 215 megawatts of electricity.
And the grid operator expects that to grow to
nearly 2,000 megawatts worth of batteries by
2023.
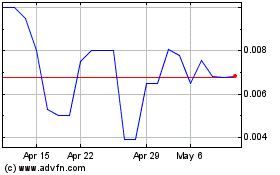
Spey Resources (QB) (USOTC:SPEYF)
Historical Stock Chart
From Mar 2024 to Apr 2024

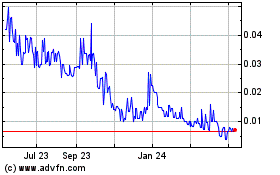
Spey Resources (QB) (USOTC:SPEYF)
Historical Stock Chart
From Apr 2023 to Apr 2024
