United States
Securities and Exchange Commission
Washington, D.C. 20549
FORM 6-K
Report of Foreign Private Issuer
Pursuant to Rule 13a-16 or 15d-16
of the
Securities Exchange Act of 1934
For the month of
December 2022
Vale S.A.
Praia de Botafogo nº 186, 18º andar,
Botafogo
22250-145 Rio de Janeiro, RJ, Brazil
(Address of principal executive office)
(Indicate by check mark whether the registrant files
or will file annual reports under cover of Form 20-F or Form 40-F.)
(Check One)
Form 20-F x Form 40-F ¨
(Indicate by check mark if the registrant is submitting the Form 6-K
in paper as permitted by Regulation S-T Rule 101(b)(1))
(Check One)
Yes ¨ No x
(Indicate by check mark if the registrant is submitting the Form 6-K
in paper as permitted by Regulation S-T Rule 101(b)(7))
(Check
One) Yes ¨ No
x
(Indicate by check mark whether the registrant by furnishing the information
contained in this Form is also thereby furnishing information to the Commission pursuant to Rule 12g3-2(b) under the Securities Exchange
Act of 1934.)
(Check One)
Yes ¨ No x
(If “Yes” is marked, indicate below the file number assigned
to the registrant in connection with Rule 12g3-2(b). 82- .)
Vale informs on estimates update
Rio de Janeiro, December 7th, 2022 - Vale
S.A. (“Vale”) informs that it has updated its estimates and that these must be considered as such:
Estimated production volumes
| Year |
2022 |
2023 |
2026 |
2030+ |
| Iron ore (Mt) |
~310 |
310-320 |
340-360 |
>360 |
| Pellets & briquettes (Mt) |
~33 |
36-40 |
50-55 |
~100 |
| Nickel (kt) |
~180 |
160-175 |
230-245¹ |
>300² |
| Copper (kt) |
~260 |
335-370 |
390-420 |
~900 |
¹Including indirect exposure to total nickel
sourced from PTVI mines for Bahodopi and Pomalaa.
²Including indirect exposure to total nickel
sourced from PTVI mines for Bahodopi, Pomalaa and Sorowako HPAL.
All-in components
| Year |
2022 |
2023 |
2026 |
2030+ |
| Iron ore Premiums¹ (US$/t) |
~7 |
~8 |
8 - 12 |
18 - 25 |
| Iron ore C1 cash cost – ex 3rd party purchase² (US$/t) |
19.5 - 20 |
20 - 21 |
- |
- |
| Iron ore All-in costs3 (US$/t) |
49 |
47 |
42 |
- |
| Nickel All-in costs4 (US$/t) |
13,000 |
13,000 |
10,000 |
- |
| Copper All-in costs5 (US$/t) |
4,000 |
3,200 |
2,600 |
- |
¹
Including iron ore fines quality adjustment and iron
ore fines pellet adjustment.
²
2022 BRL/USD exchange rate of 5.16 and 2023 BRL/USD exchange rate of 5.20.
In 2023 includes tailing filtration plants ramp-up, health & safety, dam management, geotechnics, risk and sustainability costs.
3
Approximately all-in costs after by-products before sustaining investment.
Decrease in next years considers higher premiums and share of agglomerated products, lower bunker costs, higher volumes, and fixed cost
dilution.
4
Approximately all-in costs after by-products before sustaining investment.
Decrease in next years considers higher volume of premium materials in the mix including by-products, and fixed cost dilution (VBME and
CCM 1 ramp-up), Onça Puma 2nd Furnace.
5
Approximately all-in costs after by-products before sustaining investment.
Decrease in next years considers higher volumes and fixed cost dilution, Salobo 3 ramp-up and productivity improvements.
Potential contribution of EBITDA generated by
higher Iron ore premiums and volumes
In Ferrous business, higher iron ore all-in premium
and volumes could potentially contribute with US$ 4 billion EBITDA by 2026, based on 3Q22 Iron Ore EBITDA margin of approximately US$
50/t and expected iron ore volumes of approximately 310Mt in 2022.
Mineral exploration R&D expenses
| Year |
2022 |
2023 |
2024 |
2025 |
2026 |
| Exploration (US$ million) |
~170 |
~180 |
~250 |
~300 |
~350 |
Capital expenditure (US$ billion)
| Year |
2022 |
2023 |
2024-2027
(average per year) |
| CAPEX (US$ billion) |
~5.5 |
6.0 |
6.0 – 6.5 |
Brumadinho & Mariana commitments (US$ billion)¹
| Year |
2022 |
2023 |
2024 |
2025 |
2026 |
2027+ |
| Decharacterization (US$ billion) |
0.4 |
0.4 |
0.5 |
0.5 |
0.5 |
2.44 |
| Brumadinho agreements² (US$ billion) |
1.4 |
1.1 |
0.9 |
0.6 |
0.9 |
0.0 |
| Incurred expenses (US$ billion) |
0.6 |
0.5 |
0.5 |
0.4 |
0.3 |
0.35 |
| Samarco & Renova³ (US$ billion) |
0.4 |
1.9 |
1.0 |
0.3 |
0.1 |
0.16 |
| Total (US$ billion) |
2.8 |
3.9 |
2.9 |
1.8 |
1.8 |
2.8 |
1 Amounts stated include inflation adjustments,
net of judicial deposits and without discount to present value, considering average BRL/USD exchange rate of 5.4066.
2 Includes Integral Reparation Agreement,
individual, labor and emergency indemnifications, tailing removal and containment works.
3 Includes Germano dam decharacterization
provision.
4 Related to 2027-2035.
5 Related to 2027.
6 Mainly related to 2027.
Free cash flow
Vale’s 2026 free cash flow sensitivity ranging from US$ 5.7 billion to US$ 12.4 billion, depending on the following assumptions:
(i) annual average iron ore pricing ranging from US$ 90/dmt to US$ 110/dmt; (ii) annual average nickel price (LME) ranging from US$ 7,500/t
to US$ 10,500/t; (iii) annual average copper price (LME) ranging from US$/t 20,000/t to US$ 24,000/t.
Vale informs that it has discontinued all previous
guidance.
Vale clarifies that the information provided in this
document represent only an expectation, hypothetical data that by no means constitute a promise of performance by Vale and/or its management.
The estimates presented involve market factors that are beyond Vale’s control and, therefore, can be subject to new changes. Additionally,
Vale informs that will file again in due course the item 11 of its Reference Form, in the period required by the Resolution CVM number
80.
Gustavo Duarte Pimenta
Executive Officer of Investor Relations
For further information, please contact:
Vale.RI@vale.com
Ivan Fadel: ivan.fadel@vale.com
Mariana Rocha: mariana.rocha@vale.com
Samir Bassil: samir.bassil@vale.com
This press release may include statements
that present Vale’s expectations about future events or results. All statements, when based upon expectations about the future,
involve various risks and uncertainties. Vale cannot guarantee that such statements will prove correct. These risks and uncertainties
include factors related to the following: (a) the countries where we operate, especially Brazil and Canada; (b) the global economy; (c)
the capital markets; (d) the mining and metals prices and their dependence on global industrial production, which is cyclical by nature;
and (e) global competition in the markets in which Vale operates. To obtain further information on factors that may lead to results different
from those forecast by Vale, please consult the reports Vale files with the U.S. Securities and Exchange Commission (SEC), the Brazilian
Comissão de Valores Mobiliários (CVM) and in particular the factors discussed under “Forward-Looking Statements”
and “Risk Factors” in Vale’s annual report on Form 20-F.
Signatures
Pursuant to the requirements of the Securities
Exchange Act of 1934, the registrant has duly caused this report to be signed on its behalf by the undersigned, thereunto duly authorized.
| |
Vale S.A.
(Registrant) |
| |
|
| |
By: |
/s/ Ivan Fadel |
| Date: December 07, 2022 |
|
Head of Investor Relations |
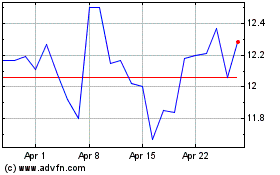
Vale (NYSE:VALE)
Historical Stock Chart
From Mar 2024 to Apr 2024

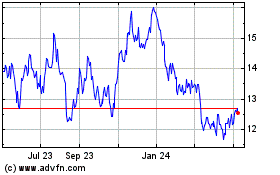
Vale (NYSE:VALE)
Historical Stock Chart
From Apr 2023 to Apr 2024
