Union Pacific Corp. Down Nearly 5%, on Pace for Largest Percent Decrease Since November 2018 -- Data Talk
July 17 2019 - 12:01PM
Dow Jones News
Union Pacific Corporation (UNP) is currently at $166.42, down
$8.73 or 4.98%
-- Would be lowest close since June 27, 2019, when it closed at
$166.01
-- On pace for largest percent decrease since Nov. 20, 2018,
when it fell 6.03%
-- CSX Corp.'s weak guidance Tuesday cast a dark cloud over
other railway companies as the sector deals with pressure from
trade tensions and weakening parts of the industrial economy
-- Executives at CSX Corp., Union Pacific Corp. and other
railroads started the year confident that a strong economy would
lead to more goods for them to move across their network. But since
then, North America's freight railroads have dealt with severe
weather and flooding, escalating trade disputes and cooling pockets
of the U.S. economy. The railroads may not have enough time in the
second half of the year to hit their earlier projected volume
goals, according to analysts
-- Down 1.59% month-to-date
-- Up 20.39% year-to-date
-- Down 7.13% from its all-time closing high of $179.20 on May
3, 2019
-- Up 17.82% from 52 weeks ago (July 18, 2018), when it closed
at $141.25
-- Down 7.13% from its 52-week closing high of $179.20 on May 3,
2019
-- Up 29.8% from its 52-week closing low of $128.21 on Dec. 25,
2018
-- Fourth-worst performer in the S&P 500 today
All data as of 11:21:53 AM
Source: Dow Jones Market Data, FactSet
(END) Dow Jones Newswires
July 17, 2019 11:46 ET (15:46 GMT)
Copyright (c) 2019 Dow Jones & Company, Inc.
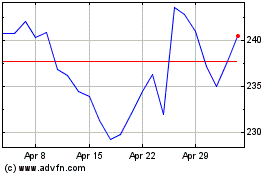
Union Pacific (NYSE:UNP)
Historical Stock Chart
From Mar 2024 to Apr 2024

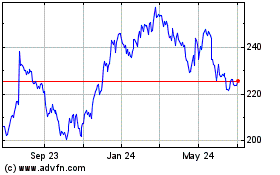
Union Pacific (NYSE:UNP)
Historical Stock Chart
From Apr 2023 to Apr 2024
