SAN DIEGO, Aug. 5, 2020 /PRNewswire/ -- Sempra
Energy (NYSE: SRE) today reported second-quarter 2020 earnings
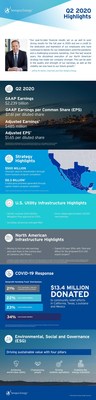
of $2.239 billion, or $7.61 per diluted share, compared to
second-quarter 2019 earnings of $354
million, or $1.26 per diluted
share. On an adjusted basis, the company's second-quarter 2020
earnings were $485 million, or
$1.65 per diluted share, compared to
$309 million, or $1.10 per diluted share, in the second quarter of
2019.
"Our year-to-date financial results set us up well to post
strong results for the full year in 2020 and are a credit to the
dedication and teamwork of our employees who have continued to
deliver for our stakeholders amid the pandemic and a challenging
economic backdrop," said Jeffrey W.
Martin, chairman and CEO of Sempra Energy. "Over the last
several years, the disciplined execution of our North American
strategy has made our company stronger. This can be seen in the
quality and strength of our earnings, as well as the visibility we
now have to our future growth."
Sempra Energy's earnings for the first six months of 2020 were
$2.999 billion, or $9.91 per diluted share, compared with earnings
of $795 million, or $2.85 per diluted share, in the first six months
of 2019. Adjusted earnings for the first six months of 2020 were
$1.417 billion, or $4.76 per diluted share, compared to $843 million, or $3.03 per diluted share, in the first six months
of 2019.
The reported financial results reflect certain significant
items, as described on an after-tax basis in the following table of
GAAP earnings, reconciled to adjusted earnings, for the second
quarter and first six months of 2020 and 2019.
|
|
|
|
|
|
|
|
|
|
|
|
|
|
|
|
|
|
|
|
|
|
|
|
|
|
|
|
Three months
ended
|
|
Six months
ended
|
|
|
|
|
|
June
30,
|
|
June
30,
|
|
|
|
(Dollars, except
EPS, and shares, in millions)
|
|
2020
|
|
2019
|
|
2020
|
|
2019
|
|
|
|
|
|
(Unaudited)
|
|
|
|
GAAP
Earnings
|
|
$
2,239
|
|
$
354
|
|
$
2,999
|
|
$
795
|
|
|
|
|
|
|
|
|
|
|
|
|
|
|
|
Gain on Sale of South
American Businesses
|
|
(1,754)
|
|
-
|
|
(1,754)
|
|
-
|
|
|
|
|
|
|
|
|
|
|
|
|
|
|
|
Losses from
Investment in RBS Sempra Commodities LLP
|
|
-
|
|
-
|
|
100
|
|
-
|
|
|
|
|
|
|
|
|
|
|
|
|
|
|
|
Impacts Associated
with Aliso Canyon Litigation
|
|
-
|
|
-
|
|
72
|
|
-
|
|
|
|
|
|
|
|
|
|
|
|
|
|
|
|
Tax Impacts from
Expected Sale of South American Businesses
|
|
-
|
|
-
|
|
-
|
|
93
|
|
|
|
|
|
|
|
|
|
|
|
|
|
|
|
Gain on Sale of U.S.
Wind Assets
|
|
-
|
|
(45)
|
|
-
|
|
(45)
|
|
|
|
|
|
|
|
|
|
|
|
|
|
|
|
Adjusted
Earnings(1)
|
|
$
485
|
|
$
309
|
|
$
1,417
|
|
$
843
|
|
|
|
|
|
|
|
|
|
|
|
|
|
|
|
|
|
|
|
|
|
|
|
|
|
|
|
GAAP Diluted
Weighted-Average Common Shares Outstanding
|
|
294
|
|
280
|
|
308
|
|
278
|
|
|
|
GAAP Earnings Per
Diluted Common Share(2)
|
|
$
7.61
|
|
$
1.26
|
|
$
9.91
|
|
$
2.85
|
|
|
|
|
|
|
|
|
|
|
|
|
|
|
|
Adjusted Diluted
Weighted-Average Common Shares Outstanding(1)
|
|
294
|
|
280
|
|
313
|
|
278
|
|
|
|
Adjusted Earnings Per
Diluted Common Share(1),(3)
|
|
$
1.65
|
|
$
1.10
|
|
$
4.76
|
|
$
3.03
|
|
|
|
|
|
|
|
|
|
|
|
|
|
|
1)
|
Represents a non-GAAP
financial measure. See Table A for information regarding non-GAAP
financial measures.
|
|
2)
|
To calculate YTD-2020
GAAP EPS, preferred dividends of $52 million are added back to
GAAP Earnings because of the dilutive effect of Series A mandatory
convertible preferred stock.
|
|
3)
|
To calculate YTD-2020
Adjusted EPS, preferred dividends of $71 million are added
back to Adjusted Earnings because of the dilutive effect of Series
A and Series B mandatory convertible preferred stock.
|
Executing on a Disciplined Strategy
Sempra Energy
completed the sales of its South American businesses in June,
marking the conclusion of its broad, two-year capital rotation
plan. The company's investments are now focused on transmission and
distribution energy infrastructure in the most attractive markets
in North America, including
California, Texas, Mexico
and North America's liquefied
natural gas (LNG) export market.
In total, including the sales of the company's South American
businesses and its U.S. renewables businesses and non-utility
natural gas storage assets, the company has generated approximately
$8.3 billion in total gross proceeds
from these divestitures. The recent sale of the company's Chilean
businesses remains subject to post-closing adjustments. Proceeds
from these transactions are being used to further bolster the
company's strong liquidity position, strengthen the balance sheet,
support the execution of its robust capital plan and return value
to shareholders.
As part of Sempra Energy's goal of returning additional value to
shareholders, the company recently completed a $500 million share buyback program. It also
received authorization from its Board of Directors to repurchase an
additional $2 billion of shares at
future dates. Sempra Energy's capital allocation strategy has
enabled the company to return approximately $13 billion to common shareholders since 2000
through cash dividends and common share repurchases.
Advancing Record Capital Plans at U.S.
Utilities
Sempra Energy, including its ownership share in
amounts funded by unconsolidated entities, is projected to invest a
record $32 billion in capital over
its 2020-2024, five-year plan with a focus on improving the safety
and reliability of its transmission and distribution utility
businesses in California and
Texas.
Both San Diego Gas & Electric Co. (SDG&E) and Southern
California Gas Co. (SoCalGas) continue to successfully execute on
their infrastructure investments. More than 80% of their
investments are allocated to enhance safety and reliability,
including wildfire mitigation programs at SDG&E.
Since 2007, SDG&E has invested over $2 billion to help mitigate wildfire risk in and
around its service territory. The utility continues to employ the
latest technologies under its Fire Safe 3.0 program – such as
artificial intelligence-based predictive models and high-speed
weather data – to help advance the safety of its communities.
SoCalGas is also investing in collaborative research and
development related to hydrogen and power-to-gas technology.
SoCalGas has already deployed a demonstration of power-to-gas
technology at the National Renewable Energy Laboratory where green
hydrogen produced from electrolysis powered by solar panels is
converted to pipeline quality methane for storage and later
use.
In Texas, Oncor Electric
Delivery Company LLC (Oncor) is executing on its capital plan.
Approximately 90% of the projects in Oncor's transmission budget
through 2021 can commence construction without any further
approvals. Oncor has connected approximately 20,000 new premises in
the second quarter. Oncor is also on pace to surpass the number of
new requests for transmission interconnections it received in 2019,
which is predominantly driven by an increase in utility scale solar
generation activity. Despite the impacts of COVID-19, Oncor
believes it will continue to have a steady increase in
interconnection requests for the remainder of 2020.
Continuing Progress on Energy Infrastructure
Projects
Phase 1 of the Cameron LNG export facility is expected to reach
full commercial operations in the coming days, marking the start of
full run-rate earnings and cash flows. The facility is expected to
generate nearly $12 billion of
after-debt-service cash flow for Sempra Energy during the 20-year
contract period. Train 3 at the Cameron LNG facility reached
substantial completion on July
31.
Sempra Energy continues to work closely with the highest levels
of the Mexican government on obtaining a 20-year export permit for
Phase 1 of the proposed Energía Costa
Azul (ECA) LNG liquefaction-export infrastructure project
under development in Baja California,
Mexico. Phase 1 of the proposed project, developed by Sempra
LNG and Infraestructura Energética Nova, S.A.B. de C.V. (IEnova),
is planned to be a single-train LNG export facility with an initial
offtake capacity of approximately 2.5 million tonnes per annum. The
project would enable the production of LNG in Baja California, with a view toward
diversifying the region's energy supplies, lowering the price of
energy and supporting strategic exports to growing Asian
markets.
Driving Sustainable Value
Sempra Energy is focused on
creating sustainable value for shareholders, employees, customers
and communities. In May, Sempra Energy published its 12th corporate
sustainability report, highlighting the company's strategies to
achieve resilient operations and continue a leadership position in
sustainable business practices. The full report is available on the
Sustainability page of the company's website.
Sempra Energy continues to prioritize the safety and well-being
of its employees, customers, partners and communities through the
COVID-19 pandemic. The company has been engaging with public health
authorities to implement health and safety guidelines for the
protection of its customers and employees who are providing
essential energy services to hospitals, healthcare facilities,
first responders and others on the frontline of the COVID-19
pandemic. Face coverings, physical distancing, increased
sanitization, temperature checks and other measures have been
implemented for employees who are currently reporting to their work
locations, and those same safety protocols will be in place when
other employees return to the office.
Earnings Guidance
Sempra Energy is updating its
full-year 2020 GAAP earnings-per-common-share (EPS) guidance range
to $12.59 to $13.19 from $12.38
to $13.32, primarily reflecting
completion of the sale of its South American businesses. The
company is also reaffirming its full-year 2020 adjusted EPS
guidance range that was increased to $7.20 to $7.80 on
June 30, 2020.
Additionally, the company is reaffirming its full-year 2021 EPS
guidance range of $7.50 to
$8.10, driven primarily by strong
execution at its U.S. utility businesses.
Non-GAAP Financial Measures
Non-GAAP financial
measures include Sempra Energy's adjusted earnings and adjusted EPS
for the second quarters and first six months of 2020 and 2019, and
full-year 2020 adjusted EPS guidance. See Table A for additional
information regarding these non-GAAP financial measures.
Internet Broadcast
Sempra Energy will broadcast a live
discussion of its earnings results over the Internet today at
12 p.m. ET with senior management of
the company. Access is available by logging onto the website at
www.sempra.com. For those unable to log on to the live webcast, the
teleconference will be available on replay a few hours after its
conclusion by dialing (888) 203-1112 and entering passcode
3865285.
About Sempra Energy
Sempra Energy's mission is to be
North America's premier energy
infrastructure company. With more than $60
billion in total assets in 2019, the San Diego-based company is the utility holding
company with the largest U.S. customer base. The Sempra Energy
companies' more than 18,000 employees deliver energy with purpose
to over 35 million consumers. The company is focused on the most
attractive markets in North
America, including California, Texas, Mexico
and the LNG export market. Sempra Energy has been consistently
recognized for its leadership in sustainability, and diversity and
inclusion, and is a member of the S&P 500 Utilities Index and
the Dow Jones Utility Index. The company was also named one of the
"World's Most Admired Companies" for 2020 by Fortune Magazine.
This press release contains statements that are not
historical fact and constitute forward-looking statements within
the meaning of the Private Securities Litigation Reform Act of
1995. Forward-looking statements are based on assumptions with
respect to the future, involve risks and uncertainties, and are not
guarantees of performance. Future results may differ materially
from those expressed in the forward-looking statements. These
forward-looking statements represent our estimates and assumptions
only as of the date of this press release. We assume no obligation
to update or revise any forward-looking statement as a result of
new information, future events or other factors.
In this press release, forward-looking statements can be
identified by words such as "believes," "expects," "anticipates,"
"plans," "estimates," "projects," "forecasts," "should," "could,"
"would," "will," "confident," "may," "can," "potential,"
"possible," "proposed," "target," "pursue," "outlook," "maintain,"
or similar expressions, or when we discuss our guidance, strategy,
goals, vision, mission, opportunities, projections or
intentions.
Factors, among others, that could cause our actual results
and future actions to differ materially from those described in any
forward-looking statements include risks and uncertainties relating
to: California wildfires and the
risk that we may be found liable for damages regardless of fault
and the risk that we may not be able to recover any such costs from
insurance, the wildfire fund established by California Assembly
Bill 1054 or in rates from customers; decisions, investigations,
regulations, issuances of permits and other authorizations, renewal
of franchises, and other actions by (i) the Comisión Federal de
Electricidad, California Public Utilities Commission (CPUC), U.S.
Department of Energy, Public Utility Commission of Texas, and other regulatory and governmental
bodies and (ii) states, cities, counties and other jurisdictions in
the U.S., Mexico and other
countries in which we operate or do business; the success of
business development efforts, construction projects and major
acquisitions and divestitures, including risks in (i) the ability
to make a final investment decision and completing construction
projects on schedule and budget, (ii) obtaining the consent of
partners, (iii) counterparties' financial or other ability to
fulfill contractual commitments, (iv) the ability to complete
contemplated acquisitions, and (v) the ability to realize
anticipated benefits from any of these efforts once completed; the
impact of the COVID-19 pandemic on our (i) ability to commence and
complete capital and other projects and obtain regulatory
approvals, (ii) supply chain and current and prospective
counterparties, contractors, customers, employees and partners,
(iii) liquidity, resulting from bill payment challenges experienced
by our customers, including in connection with a CPUC-ordered
suspension of service disconnections, decreased stability and
accessibility of the capital markets and other factors, and (iv)
ability to sustain operations and satisfy compliance requirements
due to social distancing measures or if employee absenteeism were
to increase significantly; the resolution of civil and criminal
litigation, regulatory inquiries, investigations and proceedings,
and arbitrations; actions by credit rating agencies to downgrade
our credit ratings or to place those ratings on negative outlook
and our ability to borrow at favorable interest rates; moves to
reduce or eliminate reliance on natural gas and the impact of the
extreme volatility and unprecedented decline of oil prices on our
businesses and development projects; weather, natural disasters,
accidents, equipment failures, computer system outages and other
events that disrupt our operations, damage our facilities and
systems, cause the release of harmful materials, cause fires and
subject us to liability for property damage or personal injuries,
fines and penalties, some of which may not be covered by insurance
(including costs in excess of applicable policy limits), may be
disputed by insurers or may otherwise not be recoverable through
regulatory mechanisms or may impact our ability to obtain
satisfactory levels of affordable insurance; the availability of
electric power and natural gas and natural gas storage capacity,
including disruptions caused by failures in the transmission grid,
limitations on the withdrawal or injection of natural gas from or
into storage facilities, and equipment failures; cybersecurity
threats to the energy grid, storage and pipeline infrastructure,
the information and systems used to operate our businesses, and the
confidentiality of our proprietary information and the personal
information of our customers and employees; expropriation of
assets, the failure of foreign governments and state-owned entities
to honor the terms of contracts, and property disputes; the impact
at San Diego Gas & Electric Company (SDG&E) on competitive
customer rates and reliability due to the growth in distributed and
local power generation, including from departing retail load
resulting from customers transferring to Direct Access, Community
Choice Aggregation or other forms of distributed or local power
generation, and the risk of nonrecovery for stranded assets and
contractual obligations; Oncor Electric Delivery Company LLC's
(Oncor) ability to eliminate or reduce its quarterly dividends due
to regulatory and governance requirements and commitments,
including by actions of Oncor's independent directors or a minority
member director; volatility in foreign currency exchange, interest
and inflation rates and commodity prices and our ability to
effectively hedge the risk of such volatility; changes in trade
policies, laws and regulations, including tariffs and revisions to
or replacement of international trade agreements, such as the newly
effective United
States-Mexico-Canada Agreement, that may increase our costs
or impair our ability to resolve trade disputes; the impact of
changes to U.S. federal and state and foreign tax laws and our
ability to mitigate adverse impacts; and other uncertainties, some
of which may be difficult to predict and are beyond our
control.
These risks and uncertainties are further discussed in the
reports that Sempra Energy has filed with the U.S. Securities and
Exchange Commission (SEC). These reports are available through the
EDGAR system free-of-charge on the SEC's website, www.sec.gov, and
on the company's website, www.sempra.com. Investors should not rely
unduly on any forward-looking statements.
Sempra North American Infrastructure, Sempra LNG, Sempra
Mexico, Sempra Texas Utilities, Oncor and Infraestructura
Energética Nova, S.A.B. de C.V. (IEnova) are not the same companies
as the California utilities,
SDG&E or Southern California Gas Company, and Sempra North
American Infrastructure, Sempra LNG, Sempra Mexico, Sempra Texas
Utilities, Oncor and IEnova are not regulated by the CPUC.
|
SEMPRA
ENERGY
Table
A
|
|
|
|
|
CONDENSED
CONSOLIDATED STATEMENTS OF OPERATIONS
|
|
|
|
|
|
|
|
|
|
|
|
|
|
|
|
|
|
|
|
|
|
|
|
|
|
Three months
ended
June 30,
|
|
Six months ended
June 30
|
|
|
(Dollars in millions,
except per share amounts; shares in thousands)
|
2020
|
|
2019
|
|
2020
|
|
2019
|
|
|
(unaudited)
|
|
REVENUES
|
|
|
|
|
|
|
|
|
|
Utilities
|
$
|
2,233
|
|
|
$
|
1,895
|
|
|
$
|
4,898
|
|
|
$
|
4,410
|
|
|
|
Energy-related
businesses
|
293
|
|
|
335
|
|
|
657
|
|
|
718
|
|
|
|
Total
revenues
|
2,526
|
|
|
2,230
|
|
|
5,555
|
|
|
5,128
|
|
|
|
|
|
|
|
|
|
|
|
|
EXPENSES AND OTHER
INCOME
|
|
|
|
|
|
|
|
|
|
Utilities:
|
|
|
|
|
|
|
|
|
|
Cost of natural
gas
|
(131)
|
|
|
(136)
|
|
|
(468)
|
|
|
(667)
|
|
|
|
Cost of electric fuel
and purchased power
|
(260)
|
|
|
(263)
|
|
|
(489)
|
|
|
(519)
|
|
|
|
Energy-related
businesses cost of sales
|
(51)
|
|
|
(63)
|
|
|
(110)
|
|
|
(171)
|
|
|
|
Operation and
maintenance
|
(898)
|
|
|
(838)
|
|
|
(1,849)
|
|
|
(1,670)
|
|
|
|
Depreciation and
amortization
|
(412)
|
|
|
(389)
|
|
|
(824)
|
|
|
(772)
|
|
|
|
Franchise fees and
other taxes
|
(121)
|
|
|
(112)
|
|
|
(258)
|
|
|
(242)
|
|
|
|
Gain on sale of
assets
|
—
|
|
|
66
|
|
|
—
|
|
|
66
|
|
|
|
Other income
(expense), net
|
62
|
|
|
28
|
|
|
(192)
|
|
|
110
|
|
|
|
Interest
income
|
22
|
|
|
21
|
|
|
49
|
|
|
42
|
|
|
|
Interest
expense
|
(274)
|
|
|
(258)
|
|
|
(554)
|
|
|
(518)
|
|
|
|
Income from
continuing operations before income taxes and equity
earnings
|
463
|
|
|
286
|
|
|
860
|
|
|
787
|
|
|
|
Income tax (expense)
benefit
|
(168)
|
|
|
(47)
|
|
|
39
|
|
|
(89)
|
|
|
|
Equity
earnings
|
233
|
|
|
118
|
|
|
496
|
|
|
219
|
|
|
|
Income from
continuing operations, net of income tax
|
528
|
|
|
357
|
|
|
1,395
|
|
|
917
|
|
|
|
Income from
discontinued operations, net of income tax
|
1,777
|
|
|
78
|
|
|
1,857
|
|
|
36
|
|
|
|
Net income
|
2,305
|
|
|
435
|
|
|
3,252
|
|
|
953
|
|
|
|
Earnings attributable
to noncontrolling interests
|
(28)
|
|
|
(45)
|
|
|
(179)
|
|
|
(86)
|
|
|
|
Preferred
dividends
|
(37)
|
|
|
(35)
|
|
|
(73)
|
|
|
(71)
|
|
|
|
Preferred dividends
of subsidiary
|
(1)
|
|
|
(1)
|
|
|
(1)
|
|
|
(1)
|
|
|
|
Earnings attributable
to common shares
|
$
|
2,239
|
|
|
$
|
354
|
|
|
$
|
2,999
|
|
|
$
|
795
|
|
|
|
|
|
|
|
|
|
|
|
|
Basic earnings per
common share (EPS):
|
|
|
|
|
|
|
|
|
|
Earnings
|
$
|
7.64
|
|
|
$
|
1.29
|
|
|
$
|
10.24
|
|
|
$
|
2.89
|
|
|
|
Weighted-average
common shares outstanding
|
293,060
|
|
|
274,987
|
|
|
292,925
|
|
|
274,831
|
|
|
|
|
|
|
|
|
|
|
|
|
Diluted
EPS:
|
|
|
|
|
|
|
|
|
|
Earnings
|
$
|
7.61
|
|
|
$
|
1.26
|
|
|
$
|
9.91
|
|
|
$
|
2.85
|
|
|
|
Weighted-average
common shares outstanding
|
294,155
|
|
|
279,619
|
|
|
307,962
|
|
|
278,424
|
|
|
|
|
|
|
|
|
|
|
|
SEMPRA ENERGY
Table A
(Continued)
RECONCILIATION OF SEMPRA ENERGY ADJUSTED EARNINGS TO SEMPRA
ENERGY GAAP EARNINGS (Unaudited)
Sempra Energy Adjusted Earnings and Adjusted EPS exclude items
(after the effects of income taxes and, if applicable,
noncontrolling interests) in 2020 and 2019 as follows:
Three months ended June 30,
2020:
- $1,754 million gain on the sale
of our South American businesses
Three months ended June 30,
2019:
- $45 million gain on the sale of
certain Sempra Renewables assets
Six months ended June 30,
2020:
- (72) million from impacts associated with Aliso Canyon natural
gas storage facility litigation at Southern California Gas Company
(SoCalGas)
- $(100) million equity losses at
RBS Sempra Commodities LLP, which represent an estimate of our
obligations to settle pending tax matters and related legal costs
at our equity method investment at Parent and Other
- $1,754 million gain on the sale
of our South American businesses
Six months ended June 30,
2019:
- $45 million gain on the sale of
certain Sempra Renewables assets
Associated with holding the South American businesses for
sale:
- $(103) million income tax expense
from outside basis differences in our South American businesses
primarily related to the change in our indefinite reinvestment
assertion from our decision in January
2019 to hold those businesses for sale
- $10 million income tax benefit to
reduce a valuation allowance against certain net operating loss
(NOL) carryforwards as a result of our decision to sell our South
American businesses
Sempra Energy Adjusted Earnings, Weighted-Average Common Shares
Outstanding – Adjusted and Adjusted EPS are non-GAAP financial
measures (GAAP represents accounting principles generally accepted
in the United States of America).
Because of the significance and/or nature of the excluded items,
management believes that these non-GAAP financial measures provide
a meaningful comparison of the performance of Sempra Energy's
business operations to prior and future periods. Non-GAAP financial
measures are supplementary information that should be considered in
addition to, but not as a substitute for, the information prepared
in accordance with GAAP. The table below reconciles for historical
periods these non-GAAP financial measures to Sempra Energy GAAP
Earnings, Weighted-Average Common Shares Outstanding – GAAP and
GAAP EPS, which we consider to be the most directly comparable
financial measures calculated in accordance with GAAP.
|
SEMPRA
ENERGY
Table A
(Continued)
|
|
|
|
Pretax
amount
|
Income tax
expense
(benefit)(1)
|
|
Earnings
|
|
Pretax
amount
|
Income tax
expense
(benefit)(1)
|
|
|
|
Earnings
|
|
|
(Dollars in millions,
except per share amounts; shares in thousands)
|
|
Three months ended
June 30, 2020
|
|
|
Three months ended
June 30, 2019
|
|
|
Sempra Energy GAAP
Earnings
|
|
|
|
|
|
$
|
2,239
|
|
|
|
|
|
$
|
354
|
|
|
|
Excluded
items:
|
|
|
|
|
|
|
|
|
|
|
|
|
|
|
|
|
|
|
|
|
|
|
|
|
|
|
|
|
|
|
|
|
Gain on sale of
South American businesses
|
|
|
$
|
(2,915)
|
|
$
|
1,161
|
|
|
(1,754)
|
|
|
$
|
—
|
|
$
|
—
|
|
|
—
|
|
|
|
Gain on sale of
certain Sempra Renewables assets
|
|
|
—
|
|
—
|
|
|
—
|
|
|
(61)
|
|
16
|
|
|
(45)
|
|
|
|
Sempra Energy
Adjusted Earnings
|
|
|
|
|
|
$
|
485
|
|
|
|
|
|
$
|
309
|
|
|
|
|
|
|
|
|
|
|
|
|
|
|
|
|
|
|
|
Diluted
EPS:
|
|
|
|
|
|
|
|
|
|
|
|
|
|
|
|
|
|
|
|
|
|
|
|
|
|
|
|
|
|
|
|
|
Weighted-average common shares outstanding,
diluted
|
|
|
|
|
|
294,155
|
|
|
|
|
|
279,619
|
|
|
|
Sempra Energy
GAAP EPS
|
|
|
|
|
|
$
|
7.61
|
|
|
|
|
|
$
|
1.26
|
|
|
|
|
|
|
|
|
|
|
|
|
|
|
|
|
|
|
|
|
|
|
|
|
|
|
|
|
|
|
|
|
|
|
|
|
|
|
|
|
|
|
|
|
|
|
|
|
|
|
|
|
|
|
|
|
|
|
|
|
Sempra Energy Adjusted
EPS
|
|
|
|
|
|
$
|
1.65
|
|
|
|
|
|
$
|
1.10
|
|
|
|
|
|
|
|
|
|
|
|
|
|
|
|
|
|
|
|
|
|
|
|
|
Six months ended June
30, 2020
|
|
Six months ended June
30, 2019
|
|
Sempra Energy GAAP
Earnings
|
|
|
|
|
|
$
|
2,999
|
|
|
|
|
|
$
|
795
|
|
|
|
Excluded
items:
|
|
|
|
|
|
|
|
|
|
|
|
|
|
Impacts
associated with Aliso Canyon litigation
|
|
|
$
|
100
|
|
$
|
(28)
|
|
|
72
|
|
|
$
|
—
|
|
$
|
—
|
|
|
—
|
|
|
|
Losses from
investment in RBS Sempra Commodities LLP
|
|
|
100
|
|
—
|
|
|
100
|
|
|
—
|
|
—
|
|
|
—
|
|
|
|
Gain on sale of
South American businesses
|
|
|
(2,915)
|
|
1,161
|
|
|
(1,754)
|
|
|
—
|
|
—
|
|
|
—
|
|
|
|
Gain on sale of
certain Sempra Renewables assets
|
|
|
—
|
|
—
|
|
|
—
|
|
|
(61)
|
|
16
|
|
|
(45)
|
|
|
|
Associated with
holding the South American businesses for sale:
|
|
|
|
|
|
|
|
|
|
|
|
|
|
Change in indefinite
reinvestment assertion of basis differences in
discontinued
operations
|
|
|
—
|
|
—
|
|
|
—
|
|
|
—
|
|
103
|
|
|
103
|
|
|
|
Reduction in tax
valuation allowance against certain NOL
carryforwards
|
|
|
—
|
|
—
|
|
|
—
|
|
|
—
|
|
(10)
|
|
|
(10)
|
|
|
|
Sempra Energy
Adjusted Earnings
|
|
|
|
|
|
$
|
1,417
|
|
|
|
|
|
$
|
843
|
|
|
|
|
|
|
|
|
|
|
|
|
|
|
|
|
|
|
|
Diluted
EPS:
|
|
|
|
|
|
|
|
|
|
|
|
|
|
Sempra Energy
GAAP Earnings
|
|
|
|
|
|
$
|
2,999
|
|
|
|
|
|
$
|
795
|
|
|
|
Add back
dividends for dilutive series A preferred stock
|
|
|
|
|
|
52
|
|
|
|
|
|
—
|
|
|
|
Sempra Energy
GAAP Earnings for GAAP EPS
|
|
|
|
|
|
$
|
3,051
|
|
|
|
|
|
$
|
795
|
|
|
|
Weighted-average common shares outstanding,
diluted – GAAP
|
|
|
|
|
|
307,962
|
|
|
|
|
|
278,424
|
|
|
|
Sempra Energy
GAAP EPS
|
|
|
|
|
|
$
|
9.91
|
|
|
|
|
|
$
|
2.85
|
|
|
|
|
|
|
|
|
|
|
|
|
|
|
|
|
|
|
|
|
|
|
Sempra Energy
Adjusted Earnings
|
|
|
|
|
|
$
|
1,417
|
|
|
|
|
|
$
|
843
|
|
|
|
Add back
dividends for dilutive series A and series B preferred
stock
|
|
|
|
|
|
71
|
|
|
|
|
|
—
|
|
|
|
Sempra Energy Adjusted
Earnings for Adjusted EPS
|
|
|
|
|
|
$
|
1,488
|
|
|
|
|
|
$
|
843
|
|
|
|
Weighted-average
common shares outstanding, diluted –
Adjusted(2)
|
|
|
|
|
|
312,575
|
|
|
|
|
|
278,424
|
|
|
|
Sempra Energy Adjusted
EPS
|
|
|
|
|
|
$
|
4.76
|
|
|
|
|
|
$
|
3.03
|
|
|
|
|
|
(1)
|
Except for
adjustments that are solely income tax and tax related to outside
basis differences, income taxes were primarily calculated based on
applicable statutory tax rates. We did not record an income tax
benefit for the equity losses from
our investment in
RBS Sempra Commodities LLP because, even though a portion of the
liabilities may be deductible under United Kingdom tax law, it is
not probable that the deduction will reduce United Kingdom
taxes.
|
|
(2)
|
In the six months
ended June 30, 2020, the denominator used to calculate Adjusted EPS
includes an add-back of an additional 4,613 shares for the dilutive
effect of the series B mandatory convertible preferred
stock.
|
SEMPRA ENERGY
Table A
(Continued)
RECONCILIATION OF SEMPRA ENERGY 2020 ADJUSTED EPS GUIDANCE
RANGE TO SEMPRA ENERGY 2020 GAAP EPS GUIDANCE RANGE
(Unaudited)
Sempra Energy 2020 Adjusted EPS Guidance Range of $7.20 to $7.80
excludes items (after the effects of income taxes and, if
applicable, noncontrolling interests) as follows:
- $(72) million from impacts
associated with Aliso Canyon natural gas storage facility
litigation at SoCalGas
- $(100) million equity losses at
RBS Sempra Commodities LLP, which represents an estimate of our
obligations to settle pending tax matters and related legal costs
at our equity method investment at Parent and Other
- $1,754 million gain on the sale
of our South American businesses, plus estimated post-closing
adjustments with respect to the sale of our Chilean businesses
Sempra Energy 2020 Adjusted EPS Guidance is a non-GAAP financial
measure. Because of the significance and/or nature of the excluded
items, management believes that this non-GAAP financial measure
provides a meaningful comparison of the performance of Sempra
Energy's business operations to prior and future periods. Sempra
Energy 2020 Adjusted EPS Guidance should not be considered an
alternative to Sempra Energy 2020 GAAP EPS Guidance. Non-GAAP
financial measures are supplementary information that should be
considered in addition to, but not as a substitute for, the
information prepared in accordance with GAAP. The table below
reconciles Sempra Energy 2020 Adjusted EPS Guidance Range to Sempra
Energy 2020 GAAP EPS Guidance Range, which we consider to be the
most directly comparable financial measure calculated in accordance
with GAAP.
|
|
|
Full-Year
2020
|
|
|
Sempra Energy GAAP
EPS Guidance Range(1)
|
|
|
$
|
12.59
|
|
to
|
|
$
|
13.19
|
|
|
Excluded
items:
|
|
|
|
|
|
|
|
|
|
|
|
Impacts associated
with Aliso Canyon litigation
|
|
|
0.25
|
|
|
|
|
0.25
|
|
|
Losses from
investment in RBS Sempra Commodities LLP
|
|
|
0.34
|
|
|
|
|
0.34
|
|
|
Gain on sale of South
American businesses
|
|
|
(5.98)
|
|
|
|
|
(5.98)
|
|
|
Sempra Energy
Adjusted EPS Guidance Range
|
|
|
$
|
7.20
|
|
to
|
|
$
|
7.80
|
|
|
Weighted-average
common shares outstanding, diluted
(millions)(2)
|
|
|
|
|
|
|
293
|
|
|
|
|
(1)
|
Sempra Energy's
prior GAAP EPS guidance range for full-year 2020 of $12.38 to
$13.32 has been updated to reflect the actual gain on sale of our
South American businesses, plus estimated post-closing adjustments
with respect to the sale of our Chilean businesses. It also
reflects a decrease in weighted-average common shares outstanding
from recent repurchases of Sempra Energy common stock under an
accelerated share repurchase program.
|
|
(2)
|
Weighted-average
common shares outstanding does not include the dilutive effect of
mandatory convertible preferred stock, as they are assumed to be
antidilutive for full-year 2020. If such mandatory convertible
preferred stock were dilutive for the full year, the 2020 GAAP EPS
Guidance Range would differ from the range presented
above.
|
|
|
|
|
|
|
|
|
|
|
|
|
|
SEMPRA
ENERGY
|
|
Table
B
|
|
|
|
|
|
CONDENSED
CONSOLIDATED BALANCE SHEETS
|
|
|
|
|
|
(Dollars in
millions)
|
June 30,
2020
|
|
December
31,
2019(1)
|
|
(unaudited)
|
|
|
|
ASSETS
|
|
|
|
|
Current
assets:
|
|
|
|
|
Cash and cash
equivalents
|
$
|
4,894
|
|
|
$
|
108
|
|
|
Restricted
cash
|
33
|
|
|
31
|
|
|
Accounts receivable –
trade, net
|
1,022
|
|
|
1,261
|
|
|
Accounts receivable –
other, net
|
406
|
|
|
455
|
|
|
Due from
unconsolidated affiliates
|
91
|
|
|
32
|
|
|
Income taxes
receivable
|
121
|
|
|
112
|
|
|
Inventories
|
267
|
|
|
277
|
|
|
Regulatory
assets
|
303
|
|
|
222
|
|
|
Greenhouse gas
allowances
|
80
|
|
|
72
|
|
|
Assets held for sale
in discontinued operations
|
—
|
|
|
445
|
|
|
Other current
assets
|
423
|
|
|
324
|
|
|
Total current
assets
|
7,640
|
|
|
3,339
|
|
|
|
|
|
|
Other
assets:
|
|
|
|
|
Restricted
cash
|
3
|
|
|
3
|
|
|
Due from
unconsolidated affiliates
|
603
|
|
|
742
|
|
|
Regulatory
assets
|
1,973
|
|
|
1,930
|
|
|
Nuclear
decommissioning trusts
|
1,062
|
|
|
1,082
|
|
|
Investment in Oncor
Holdings
|
11,758
|
|
|
11,519
|
|
|
Other
investments
|
2,197
|
|
|
2,103
|
|
|
Goodwill
|
1,602
|
|
|
1,602
|
|
|
Other intangible
assets
|
208
|
|
|
213
|
|
|
Dedicated assets in
support of certain benefit plans
|
463
|
|
|
488
|
|
|
Insurance receivable
for Aliso Canyon costs
|
505
|
|
|
339
|
|
|
Deferred income
taxes
|
224
|
|
|
155
|
|
|
Greenhouse gas
allowances
|
552
|
|
|
470
|
|
|
Right-of-use assets –
operating leases
|
578
|
|
|
591
|
|
|
Wildfire
fund
|
378
|
|
|
392
|
|
|
Assets held for sale
in discontinued operations
|
—
|
|
|
3,513
|
|
|
Other long-term
assets
|
694
|
|
|
732
|
|
|
Total other
assets
|
22,800
|
|
|
25,874
|
|
|
Property, plant and
equipment, net
|
37,945
|
|
|
36,452
|
|
|
Total
assets
|
$
|
68,385
|
|
|
$
|
65,665
|
|
|
|
(1) Derived from audited
financial statements.
|
|
SEMPRA
ENERGY
|
|
Table B
(Continued)
|
|
|
|
|
|
CONDENSED
CONSOLIDATED BALANCE SHEETS
|
|
|
|
|
|
(Dollars in
millions)
|
June 30,
2020
|
|
December
31,
2019(1)
|
|
(unaudited)
|
|
|
|
LIABILITIES AND
EQUITY
|
|
|
|
|
Current
liabilities:
|
|
|
|
|
Short-term
debt
|
$
|
3,143
|
|
|
$
|
3,505
|
|
|
Accounts payable –
trade
|
1,302
|
|
|
1,234
|
|
|
Accounts payable –
other
|
145
|
|
|
179
|
|
|
Due to unconsolidated
affiliates
|
9
|
|
|
5
|
|
|
Dividends and
interest payable
|
539
|
|
|
515
|
|
|
Accrued compensation
and benefits
|
350
|
|
|
476
|
|
|
Regulatory
liabilities
|
569
|
|
|
319
|
|
|
Current portion of
long-term debt and finance leases
|
2,285
|
|
|
1,526
|
|
|
Reserve for Aliso
Canyon costs
|
256
|
|
|
9
|
|
|
Greenhouse gas
obligations
|
80
|
|
|
72
|
|
|
Liabilities held for
sale in discontinued operations
|
—
|
|
|
444
|
|
|
Other current
liabilities
|
917
|
|
|
866
|
|
|
Total current
liabilities
|
9,595
|
|
|
9,150
|
|
|
|
|
|
|
Long-term debt and
finance leases
|
20,535
|
|
|
20,785
|
|
|
|
|
|
|
Deferred credits and
other liabilities:
|
|
|
|
|
Due to unconsolidated
affiliates
|
267
|
|
|
195
|
|
|
Pension and other
postretirement benefit plan obligations, net of plan
assets
|
1,068
|
|
|
1,067
|
|
|
Deferred income
taxes
|
2,574
|
|
|
2,577
|
|
|
Deferred investment
tax credits
|
20
|
|
|
21
|
|
|
Regulatory
liabilities
|
3,432
|
|
|
3,741
|
|
|
Asset retirement
obligations
|
2,950
|
|
|
2,923
|
|
|
Greenhouse gas
obligations
|
402
|
|
|
301
|
|
|
Liabilities held for
sale in discontinued operations
|
—
|
|
|
1,052
|
|
|
Deferred credits and
other
|
2,156
|
|
|
2,048
|
|
|
Total deferred
credits and other liabilities
|
12,869
|
|
|
13,925
|
|
|
Equity:
|
|
|
|
|
Sempra Energy
shareholders' equity
|
23,606
|
|
|
19,929
|
|
|
Preferred stock of
subsidiary
|
20
|
|
|
20
|
|
|
Other noncontrolling
interests
|
1,760
|
|
|
1,856
|
|
|
Total
equity
|
25,386
|
|
|
21,805
|
|
|
Total liabilities and
equity
|
$
|
68,385
|
|
|
$
|
65,665
|
|
|
|
(1)
Derived from audited financial
statements.
|
|
SEMPRA
ENERGY
|
|
Table
C
|
|
|
|
|
|
CONDENSED
CONSOLIDATED STATEMENTS OF CASH FLOWS
|
|
|
|
|
|
|
|
|
|
|
|
|
|
|
Six months ended June
30,
|
|
(Dollars in
millions)
|
2020
|
|
2019
|
|
(unaudited)
|
|
CASH FLOWS FROM
OPERATING ACTIVITIES
|
|
|
|
|
Net
income
|
$
|
3,252
|
|
|
$
|
953
|
|
|
Less: Income
from discontinued operations, net of income tax
|
(1,857)
|
|
|
(36)
|
|
|
Income from
continuing operations, net of income tax
|
1,395
|
|
|
917
|
|
|
Adjustments to
reconcile net income to net cash provided by operating
activities
|
429
|
|
|
482
|
|
|
Intercompany
activities with discontinued operations, net
|
—
|
|
|
64
|
|
|
Net change in
other working capital components
|
375
|
|
|
84
|
|
|
Insurance
receivable for Aliso Canyon costs
|
(166)
|
|
|
80
|
|
|
Changes in
other noncurrent assets and liabilities, net
|
35
|
|
|
(104)
|
|
|
Net cash
provided by continuing operations
|
2,068
|
|
|
1,523
|
|
|
Net cash (used
in) provided by discontinued operations
|
(1,041)
|
|
|
181
|
|
|
Net cash
provided by operating activities
|
1,027
|
|
|
1,704
|
|
|
|
|
|
|
CASH FLOWS FROM
INVESTING ACTIVITIES
|
|
|
|
|
Expenditures
for property, plant and equipment
|
(2,198)
|
|
|
(1,651)
|
|
|
Expenditures
for investments and acquisitions
|
(140)
|
|
|
(1,391)
|
|
|
Proceeds from
sale of assets
|
5
|
|
|
902
|
|
|
Purchases of
nuclear decommissioning trust assets
|
(797)
|
|
|
(497)
|
|
|
Proceeds from
sales of nuclear decommissioning trust assets
|
797
|
|
|
497
|
|
|
Advances to
unconsolidated affiliates
|
(25)
|
|
|
(16)
|
|
|
Repayments of
advances to unconsolidated affiliates
|
—
|
|
|
9
|
|
|
Intercompany
activities with discontinued operations, net
|
—
|
|
|
(2)
|
|
|
Other
|
17
|
|
|
13
|
|
|
Net cash used
in continuing operations
|
(2,341)
|
|
|
(2,136)
|
|
|
Net cash
provided by (used in) discontinued operations
|
5,195
|
|
|
(131)
|
|
|
Net cash
provided by (used in) investing activities
|
2,854
|
|
|
(2,267)
|
|
|
|
|
|
|
CASH FLOWS FROM
FINANCING ACTIVITIES
|
|
|
|
|
Common
dividends paid
|
(567)
|
|
|
(483)
|
|
|
Preferred
dividends paid
|
(71)
|
|
|
(71)
|
|
|
Issuances of
preferred stock
|
891
|
|
|
—
|
|
|
Issuances of
common stock
|
13
|
|
|
20
|
|
|
Repurchases of
common stock
|
(64)
|
|
|
(18)
|
|
|
Issuances of
debt (maturities greater than 90 days)
|
4,059
|
|
|
2,630
|
|
|
Payments on
debt (maturities greater than 90 days) and finance
leases
|
(1,970)
|
|
|
(871)
|
|
|
Decrease in
short-term debt, net
|
(1,871)
|
|
|
(444)
|
|
|
Advances from
unconsolidated affiliates
|
64
|
|
|
—
|
|
|
Purchases of
noncontrolling interests
|
(27)
|
|
|
(28)
|
|
|
Other
|
(16)
|
|
|
(41)
|
|
|
Net cash
provided by continuing operations
|
441
|
|
|
694
|
|
|
Net cash
provided by (used in) discontinued operations
|
401
|
|
|
(83)
|
|
|
Net cash
provided by financing activities
|
842
|
|
|
611
|
|
|
|
|
|
|
Effect of exchange
rate changes in continuing operations
|
(7)
|
|
|
—
|
|
|
Effect of exchange
rate changes in discontinued operations
|
(3)
|
|
|
—
|
|
|
Effect of
exchange rate changes on cash, cash equivalents and restricted
cash
|
(10)
|
|
|
—
|
|
|
|
|
|
|
Increase in cash,
cash equivalents and restricted cash, including discontinued
operations
|
4,713
|
|
|
48
|
|
|
Cash, cash
equivalents and restricted cash, including discontinued operations,
January 1
|
217
|
|
|
246
|
|
|
Cash, cash
equivalents and restricted cash, including discontinued operations,
June 30
|
$
|
4,930
|
|
|
$
|
294
|
|
|
SEMPRA
ENERGY
|
|
Table
D
|
|
|
SEGMENT
EARNINGS (LOSSES) AND CAPITAL EXPENDITURES, INVESTMENTS AND
ACQUISITIONS
|
|
|
|
|
|
|
|
|
Three months ended
June 30,
|
|
Six months ended June
30,
|
|
(Dollars in
millions)
|
|
2020
|
|
2019
|
|
2020
|
|
2019
|
|
|
|
(unaudited)
|
|
Earnings (Losses)
Attributable to Common Shares
|
|
|
|
|
|
|
|
|
SDG&E
|
|
|
|
$
|
193
|
|
|
$
|
143
|
|
|
$
|
455
|
|
|
$
|
319
|
|
|
SoCalGas
|
|
|
|
146
|
|
|
30
|
|
|
449
|
|
|
294
|
|
|
Sempra Texas
Utilities
|
|
|
|
144
|
|
|
113
|
|
|
249
|
|
|
207
|
|
|
Sempra
Mexico
|
|
|
|
61
|
|
|
73
|
|
|
252
|
|
|
130
|
|
|
Sempra
Renewables
|
|
|
|
—
|
|
|
46
|
|
|
—
|
|
|
59
|
|
|
Sempra LNG
|
|
|
|
61
|
|
|
6
|
|
|
136
|
|
|
11
|
|
|
Parent and
other
|
|
|
|
(141)
|
|
|
(127)
|
|
|
(389)
|
|
|
(244)
|
|
|
Discontinued
operations
|
|
|
|
1,775
|
|
|
70
|
|
|
1,847
|
|
|
19
|
|
|
Total
|
|
|
|
$
|
2,239
|
|
|
$
|
354
|
|
|
$
|
2,999
|
|
|
$
|
795
|
|
|
|
|
|
|
|
|
|
|
|
|
|
|
|
|
|
|
|
|
|
|
|
|
|
|
|
Three months ended
June 30,
|
|
Six months ended June
30,
|
|
(Dollars in
millions)
|
|
|
|
2020
|
|
2019
|
|
2020
|
|
2019
|
|
|
|
(unaudited)
|
|
Capital
Expenditures, Investments and Acquisitions
|
|
|
|
|
|
|
|
|
SDG&E
|
|
|
|
$
|
448
|
|
|
$
|
352
|
|
|
$
|
850
|
|
|
$
|
708
|
|
|
SoCalGas
|
|
|
|
497
|
|
|
335
|
|
|
885
|
|
|
659
|
|
|
Sempra Texas
Utilities
|
|
|
|
53
|
|
|
1,226
|
|
|
139
|
|
|
1,282
|
|
|
Sempra
Mexico
|
|
|
|
151
|
|
|
157
|
|
|
321
|
|
|
242
|
|
|
Sempra
Renewables
|
|
|
|
—
|
|
|
2
|
|
|
—
|
|
|
2
|
|
|
Sempra LNG
|
|
|
|
90
|
|
|
90
|
|
|
137
|
|
|
146
|
|
|
Parent and
other
|
|
|
|
3
|
|
|
3
|
|
|
6
|
|
|
3
|
|
|
Total
|
|
|
|
$
|
1,242
|
|
|
$
|
2,165
|
|
|
$
|
2,338
|
|
|
$
|
3,042
|
|
|
SEMPRA
ENERGY
|
|
Table
E
|
|
|
OTHER OPERATING
STATISTICS (Unaudited)
|
|
|
|
Three months ended
June 30,
|
|
Six months ended June
30,
|
|
|
2020
|
|
2019
|
|
2020
|
|
2019
|
|
UTILITIES
|
|
|
|
|
|
|
|
|
|
SDG&E and
SoCalGas
|
|
|
|
|
|
|
|
|
|
Gas sales
(Bcf)(1)
|
|
71
|
|
75
|
|
200
|
|
214
|
|
Transportation
(Bcf)(1)
|
|
129
|
|
124
|
|
277
|
|
268
|
|
Total
deliveries (Bcf)(1)
|
|
200
|
|
199
|
|
477
|
|
482
|
|
|
|
|
|
|
|
|
|
|
Total gas customer
meters (thousands)
|
|
|
|
|
|
6,943
|
|
6,902
|
|
|
|
|
|
|
|
|
|
|
|
SDG&E
|
|
|
|
|
|
|
|
|
|
Electric sales
(millions of kWhs)(1)
|
|
3,124
|
|
3,244
|
|
6,584
|
|
6,826
|
|
Direct Access and
Community Choice Aggregation (millions of kWhs)
|
|
847
|
|
848
|
|
1,616
|
|
1,688
|
|
Total
deliveries (millions of kWhs)(1)
|
|
3,971
|
|
4,092
|
|
8,200
|
|
8,514
|
|
|
|
|
|
|
|
|
|
|
Total electric
customer meters (thousands)
|
|
|
|
|
|
1,478
|
|
1,463
|
|
|
|
|
|
|
|
|
|
|
Oncor(2)
|
|
|
|
|
|
|
|
|
|
Total deliveries
(millions of kWhs)
|
|
31,038
|
|
31,516
|
|
61,458
|
|
61,628
|
|
Total electric
customer meters (thousands)
|
|
|
|
|
|
3,723
|
|
3,655
|
|
|
|
|
|
|
|
|
|
|
Ecogas
|
|
|
|
|
|
|
|
|
|
Natural gas sales
(Bcf)
|
|
1
|
|
1
|
|
2
|
|
2
|
|
Natural gas customer
meters (thousands)
|
|
|
|
|
|
136
|
|
126
|
|
|
|
|
|
|
|
|
|
|
|
|
|
|
|
|
|
|
|
ENERGY-RELATED
BUSINESSES
|
|
|
|
|
|
|
|
|
|
Power generated and
sold
|
|
|
|
|
|
|
|
|
|
Sempra
Mexico
|
|
|
|
|
|
|
|
|
|
Termoeléctrica de
Mexicali (TdM) (millions of kWhs)
|
|
457
|
|
693
|
|
1,283
|
|
1,830
|
|
Wind and solar
(millions of kWhs)(3)
|
|
381
|
|
445
|
|
803
|
|
690
|
|
|
|
(1)
|
Include
intercompany sales.
|
|
(2)
|
Includes 100% of
the electric deliveries and customer meters of Oncor Electric
Delivery Company LLC (Oncor), in which we hold an indirect 80.25%
interest through our investment
in Oncor Electric
Delivery Holdings Company LLC.
|
|
(3)
|
Includes 50% of
the total power generated and sold at the Energía Sierra Juárez
wind power generation facility, in which Sempra Energy has a 50%
ownership interest. Energía
Sierra
Juárez is not consolidated within Sempra Energy,
and the related investment
is accounted for under the equity method.
|
|
SEMPRA
ENERGY
|
|
|
Table F
(Unaudited)
|
|
|
STATEMENTS OF
OPERATIONS DATA BY SEGMENT
|
|
|
|
|
|
|
|
|
|
|
|
|
|
|
|
|
|
|
|
Three months ended
June 30, 2020
|
|
(Dollars in
millions)
|
|
SDG&E
|
|
SoCalGas
|
|
Sempra
Texas
Utilities
|
|
Sempra
Mexico
|
|
Sempra
Renewables
|
|
Sempra
LNG
|
|
Consolidating
Adjustments,
Parent & Other
|
|
|
Total
|
|
|
|
|
|
|
|
|
|
|
|
|
|
|
|
|
|
|
|
|
|
|
Revenues
|
|
$
|
1,235
|
|
|
$
|
1,010
|
|
|
$
|
—
|
|
|
$
|
275
|
|
|
$
|
—
|
|
|
$
|
69
|
|
|
$
|
(63)
|
|
|
|
$
|
2,526
|
|
|
Cost of sales and
other expenses
|
|
(690)
|
|
|
(611)
|
|
|
1
|
|
|
(111)
|
|
|
—
|
|
|
(74)
|
|
|
24
|
|
|
|
(1,461)
|
|
|
Depreciation and
amortization
|
|
(197)
|
|
|
(162)
|
|
|
—
|
|
|
(47)
|
|
|
—
|
|
|
(3)
|
|
|
(3)
|
|
|
|
(412)
|
|
|
Other income
(expense), net
|
|
18
|
|
|
(2)
|
|
|
—
|
|
|
36
|
|
|
—
|
|
|
—
|
|
|
10
|
|
|
|
62
|
|
|
Income (loss) before
interest and tax(1)
|
|
366
|
|
|
235
|
|
|
1
|
|
|
153
|
|
|
—
|
|
|
(8)
|
|
|
(32)
|
|
|
|
715
|
|
|
Net interest
(expense) income
|
|
(103)
|
|
|
(39)
|
|
|
—
|
|
|
(17)
|
|
|
—
|
|
|
3
|
|
|
(96)
|
|
|
|
(252)
|
|
|
Income tax (expense)
benefit
|
|
(70)
|
|
|
(49)
|
|
|
—
|
|
|
(54)
|
|
|
—
|
|
|
(18)
|
|
|
23
|
|
|
|
(168)
|
|
|
Equity earnings,
net
|
|
—
|
|
|
—
|
|
|
143
|
|
|
6
|
|
|
—
|
|
|
84
|
|
|
—
|
|
|
|
233
|
|
|
(Earnings) losses
attributable to noncontrolling interests
|
|
—
|
|
|
—
|
|
|
—
|
|
|
(27)
|
|
|
—
|
|
|
—
|
|
|
1
|
|
|
|
(26)
|
|
|
Preferred
dividends
|
|
—
|
|
|
(1)
|
|
|
—
|
|
|
—
|
|
|
—
|
|
|
—
|
|
|
(37)
|
|
|
|
(38)
|
|
|
Earnings (losses)
from continuing operations
|
|
$
|
193
|
|
|
$
|
146
|
|
|
$
|
144
|
|
|
$
|
61
|
|
|
$
|
—
|
|
|
$
|
61
|
|
|
$
|
(141)
|
|
|
|
464
|
|
|
Earnings from
discontinued operations(2)
|
|
|
|
|
|
|
|
|
|
|
|
|
|
|
|
|
1,775
|
|
|
Earnings attributable
to common shares
|
|
|
|
|
|
|
|
|
|
|
|
|
|
|
|
|
$
|
2,239
|
|
|
|
|
|
|
|
|
|
|
|
|
|
|
|
|
|
|
|
|
|
|
|
Three months ended
June 30, 2019
|
|
(Dollars in
millions)
|
|
SDG&E
|
|
SoCalGas
|
|
Sempra
Texas
Utilities
|
|
Sempra
Mexico
|
|
Sempra
Renewables
|
|
Sempra
LNG
|
|
Consolidating
Adjustments,
Parent & Other
|
|
|
Total
|
|
|
|
|
|
|
|
|
|
|
|
|
|
|
|
|
|
|
|
|
|
|
Revenues
|
|
$
|
1,094
|
|
|
$
|
806
|
|
|
$
|
—
|
|
|
$
|
318
|
|
|
$
|
3
|
|
|
$
|
86
|
|
|
$
|
(77)
|
|
|
|
$
|
2,230
|
|
|
Cost of sales and
other expenses
|
|
(642)
|
|
|
(599)
|
|
|
—
|
|
|
(130)
|
|
|
(9)
|
|
|
(88)
|
|
|
56
|
|
|
|
(1,412)
|
|
|
Depreciation and
amortization
|
|
(189)
|
|
|
(148)
|
|
|
—
|
|
|
(46)
|
|
|
—
|
|
|
(3)
|
|
|
(3)
|
|
|
|
(389)
|
|
|
Gain on sale of
assets
|
|
—
|
|
|
—
|
|
|
—
|
|
|
—
|
|
|
61
|
|
|
—
|
|
|
5
|
|
|
|
66
|
|
|
Other income
(expense), net
|
|
19
|
|
|
1
|
|
|
—
|
|
|
17
|
|
|
—
|
|
|
—
|
|
|
(9)
|
|
|
|
28
|
|
|
Income (loss) before
interest and tax(1)
|
|
282
|
|
|
60
|
|
|
—
|
|
|
159
|
|
|
55
|
|
|
(5)
|
|
|
(28)
|
|
|
|
523
|
|
|
Net interest
(expense) income
|
|
(101)
|
|
|
(33)
|
|
|
—
|
|
|
(10)
|
|
|
1
|
|
|
13
|
|
|
(107)
|
|
|
|
(237)
|
|
|
Income tax (expense)
benefit
|
|
(35)
|
|
|
4
|
|
|
—
|
|
|
(44)
|
|
|
(14)
|
|
|
(2)
|
|
|
44
|
|
|
|
(47)
|
|
|
Equity earnings
(losses), net
|
|
—
|
|
|
—
|
|
|
113
|
|
|
4
|
|
|
2
|
|
|
—
|
|
|
(1)
|
|
|
|
118
|
|
|
(Earnings) losses
attributable to noncontrolling interests
|
|
(3)
|
|
|
—
|
|
|
—
|
|
|
(36)
|
|
|
2
|
|
|
—
|
|
|
—
|
|
|
|
(37)
|
|
|
Preferred
dividends
|
|
—
|
|
|
(1)
|
|
|
—
|
|
|
—
|
|
|
—
|
|
|
—
|
|
|
(35)
|
|
|
|
(36)
|
|
|
Earnings (losses)
from continuing operations
|
|
$
|
143
|
|
|
$
|
30
|
|
|
$
|
113
|
|
|
$
|
73
|
|
|
$
|
46
|
|
|
$
|
6
|
|
|
$
|
(127)
|
|
|
|
284
|
|
|
Earnings from
discontinued operations
|
|
|
|
|
|
|
|
|
|
|
|
|
|
|
|
|
70
|
|
|
Earnings attributable
to common shares
|
|
|
|
|
|
|
|
|
|
|
|
|
|
|
|
|
$
|
354
|
|
|
|
|
|
|
|
|
|
|
|
|
|
|
|
|
|
|
|
|
|
|
|
(1)
|
Management
believes Income (Loss) Before Interest and Tax is a useful
measurement of our segments' performance because it can be used to
evaluate the effectiveness of our operations exclusive of interest
and income tax, neither of which is directly relevant to the
efficiency of those operations.
|
|
(2)
|
Includes $1,754
million gain on the sale of our South American businesses in the
second quarter of 2020.
|
|
SEMPRA
ENERGY
|
|
|
Table F
(Unaudited)
|
|
|
STATEMENTS OF
OPERATIONS DATA BY SEGMENT
|
|
|
|
|
|
|
|
|
|
|
|
|
|
|
|
|
|
|
|
|
|
|
Six months ended
June 30, 2020
|
|
(Dollars in
millions)
|
|
SDG&E
|
|
SoCalGas
|
|
Sempra
Texas
Utilities
|
|
Sempra
Mexico
|
|
Sempra
Renewables
|
|
Sempra
LNG
|
|
Consolidating
Adjustments,
Parent & Other
|
|
|
Total
|
|
|
|
|
|
|
|
|
|
|
|
|
|
|
|
|
|
|
|
|
|
|
Revenues
|
|
$
|
2,504
|
|
|
$
|
2,405
|
|
|
$
|
—
|
|
|
$
|
584
|
|
|
$
|
—
|
|
|
$
|
192
|
|
|
$
|
(130)
|
|
|
|
$
|
5,555
|
|
|
Cost of sales and
other expenses
|
|
(1,369)
|
|
|
(1,483)
|
|
|
—
|
|
|
(248)
|
|
|
—
|
|
|
(161)
|
|
|
87
|
|
|
|
(3,174)
|
|
|
Depreciation and
amortization
|
|
(398)
|
|
|
(321)
|
|
|
—
|
|
|
(94)
|
|
|
—
|
|
|
(5)
|
|
|
(6)
|
|
|
|
(824)
|
|
|
Other income
(expense), net
|
|
49
|
|
|
28
|
|
|
—
|
|
|
(247)
|
|
|
—
|
|
|
—
|
|
|
(22)
|
|
|
|
(192)
|
|
|
Income (loss) before
interest and tax(1)
|
|
786
|
|
|
629
|
|
|
—
|
|
|
(5)
|
|
|
—
|
|
|
26
|
|
|
(71)
|
|
|
|
1,365
|
|
|
Net interest
(expense) income
|
|
(203)
|
|
|
(78)
|
|
|
—
|
|
|
(31)
|
|
|
—
|
|
|
9
|
|
|
(202)
|
|
|
|
(505)
|
|
|
Income tax (expense)
benefit
|
|
(128)
|
|
|
(101)
|
|
|
—
|
|
|
253
|
|
|
—
|
|
|
(41)
|
|
|
56
|
|
|
|
39
|
|
|
Equity earnings
(losses), net
|
|
—
|
|
|
—
|
|
|
249
|
|
|
206
|
|
|
—
|
|
|
141
|
|
|
(100)
|
|
|
|
496
|
|
|
(Earnings) losses
attributable to noncontrolling interests
|
|
—
|
|
|
—
|
|
|
—
|
|
|
(171)
|
|
|
—
|
|
|
1
|
|
|
1
|
|
|
|
(169)
|
|
|
Preferred
dividends
|
|
—
|
|
|
(1)
|
|
|
—
|
|
|
—
|
|
|
—
|
|
|
—
|
|
|
(73)
|
|
|
|
(74)
|
|
|
Earnings (losses)
from continuing operations
|
|
$
|
455
|
|
|
$
|
449
|
|
|
$
|
249
|
|
|
$
|
252
|
|
|
$
|
—
|
|
|
$
|
136
|
|
|
$
|
(389)
|
|
|
|
1,152
|
|
|
Earnings from
discontinued operations(2)
|
|
|
|
|
|
|
|
|
|
|
|
|
|
|
|
|
1,847
|
|
|
Earnings attributable
to common shares
|
|
|
|
|
|
|
|
|
|
|
|
|
|
|
|
|
$
|
2,999
|
|
|
|
|
|
|
|
|
|
|
|
|
|
|
|
|
|
|
|
|
|
|
|
Six months ended
June 30, 2019
|
|
(Dollars in
millions)
|
|
SDG&E
|
|
SoCalGas
|
|
Sempra
Texas
Utilities
|
|
Sempra
Mexico
|
|
Sempra
Renewables
|
|
Sempra
LNG
|
|
Consolidating
Adjustments,
Parent & Other
|
|
|
Total
|
|
|
|
|
|
|
|
|
|
|
|
|
|
|
|
|
|
|
|
|
|
|
Revenues
|
|
$
|
2,239
|
|
|
$
|
2,167
|
|
|
$
|
—
|
|
|
$
|
701
|
|
|
$
|
10
|
|
|
$
|
227
|
|
|
$
|
(216)
|
|
|
|
$
|
5,128
|
|
|
Cost of sales and
other expenses
|
|
(1,339)
|
|
|
(1,512)
|
|
|
—
|
|
|
(322)
|
|
|
(20)
|
|
|
(230)
|
|
|
154
|
|
|
|
(3,269)
|
|
|
Depreciation and
amortization
|
|
(375)
|
|
|
(295)
|
|
|
—
|
|
|
(90)
|
|
|
—
|
|
|
(5)
|
|
|
(7)
|
|
|
|
(772)
|
|
|
Gain on sale of
assets
|
|
—
|
|
|
—
|
|
|
—
|
|
|
—
|
|
|
61
|
|
|
—
|
|
|
5
|
|
|
|
66
|
|
|
Other income,
net
|
|
41
|
|
|
17
|
|
|
—
|
|
|
36
|
|
|
—
|
|
|
—
|
|
|
16
|
|
|
|
110
|
|
|
Income (loss) before
interest and tax(1)
|
|
566
|
|
|
377
|
|
|
—
|
|
|
325
|
|
|
51
|
|
|
(8)
|
|
|
(48)
|
|
|
|
1,263
|
|
|
Net interest
(expense) income
|
|
(203)
|
|
|
(67)
|
|
|
—
|
|
|
(21)
|
|
|
8
|
|
|
23
|
|
|
(216)
|
|
|
|
(476)
|
|
|
Income tax (expense)
benefit
|
|
(40)
|
|
|
(15)
|
|
|
—
|
|
|
(116)
|
|
|
(4)
|
|
|
(6)
|
|
|
92
|
|
|
|
(89)
|
|
|
Equity earnings
(losses), net
|
|
—
|
|
|
—
|
|
|
207
|
|
|
6
|
|
|
5
|
|
|
2
|
|
|
(1)
|
|
|
|
219
|
|
|
Earnings attributable
to noncontrolling interests
|
|
(4)
|
|
|
—
|
|
|
—
|
|
|
(64)
|
|
|
(1)
|
|
|
—
|
|
|
—
|
|
|
|
(69)
|
|
|
Preferred
dividends
|
|
—
|
|
|
(1)
|
|
|
—
|
|
|
—
|
|
|
—
|
|
|
—
|
|
|
(71)
|
|
|
|
(72)
|
|
|
Earnings (losses)
from continuing operations
|
|
$
|
319
|
|
|
$
|
294
|
|
|
$
|
207
|
|
|
$
|
130
|
|
|
$
|
59
|
|
|
$
|
11
|
|
|
$
|
(244)
|
|
|
|
776
|
|
|
Earnings from
discontinued operations
|
|
|
|
|
|
|
|
|
|
|
|
|
|
|
|
|
19
|
|
|
Earnings attributable
to common shares
|
|
|
|
|
|
|
|
|
|
|
|
|
|
|
|
|
$
|
795
|
|
|
|
|
(1)
|
Management
believes Income (Loss) Before Interest and Tax is a useful
measurement of our segments' performance because it can be used to
evaluate the effectiveness of our operations exclusive of interest
and income tax, neither of which is directly relevant to the
efficiency of those operations.
|
|
(2)
|
Includes $1,754
million gain on the sale of our South American businesses in the
second quarter of 2020.
|
 View original content to download
multimedia:http://www.prnewswire.com/news-releases/sempra-energy-reports-second-quarter-2020-earnings-results-301106279.html
View original content to download
multimedia:http://www.prnewswire.com/news-releases/sempra-energy-reports-second-quarter-2020-earnings-results-301106279.html
SOURCE Sempra Energy