Hartford Financial Services Group Inc. (HIG)
reported third-quarter core earnings of $441.0 million or 93 cents
per share, beating the Zacks Consensus Estimate of 23 cents.
However,
earnings were behind the core earnings of $485 million or 98
cents per share reported in the third quarter of 2010.
The prior-year quarter earnings include the DAC unlock benefit
of $166 million, net prior-year reserve development benefit of $99
million, and a charge of $40 million to increase reserves as a
result of the company's annual environmental reserve
evaluation.
Hartford’s core earnings in the reported quarter exclude the
adjustments for DAC unlock charge of $227 million, prior-year
reserve strengthening of $2 million, current year accident
catastrophe loss of $134 million, re-estimation of current accident
year losses in Commercial Markets of $31 million and charges
related to assessments in connection with the liquidation of
Executive Life Insurance Company of New York of $14 million.
Including the adjustments, core earnings for the reported
quarter amounted to $33 million or 5 cents per share, declining
sharply from $710 million or $1.43 per share reported in the
year-ago quarter.
The decline in earnings was attributable to poor operating
results across most lines of business. While the net profits of the
Commercial Markets and Wealth Management segments plunged sharply
from the year-ago quarter, all the other segments reported net
losses.
Hartford’s net income in the reported quarter was nil, sinking
sharply from $666 million in the comparable quarter of 2010. On a
per share basis, the company incurred a net loss of 2 cents,
showing a steep decline from net income of $1.34 in the prior-year
quarter.
Segment Results
Commercial Markets: Commercial Markets
reported a net income of $77 million in the reported quarter, down
from $352 million in the year-ago period.
P&C Commercial core income plunged to $86 million from $294
million in the prior-year quarter, as it includes $93 million of
catastrophe losses, which surged
from $13 million in the year-ago quarter. The reported quarter also
included $9 million for prior accident year development, as against
$118 million in the year-ago quarter.
However, P&C Commercial written premiums increased 7% to
$1.55 billion from $1.45 billion in the year-ago quarter. Combined
ratio, excluding catastrophes and prior year development, was
99.4%, down from 92.2% in the prior-year quarter.
Group Benefits core earnings in the third quarter of 2011 were
$20 million compared with $44 million in the third quarter of
2010.
Group Benefits fully insured premiums declined to $1.00 billion
from $1.04 billion in the comparable quarter of 2010, while loss
ratio, excluding buy-out premiums, was 80.1%, increasing from 77.1%
in the year-ago quarter.
Consumer Markets: Hartford’s Consumer
Markets segment generated a net loss of $16 million in the quarter,
against net income of $70 million in the prior-year quarter. The
reported quarter’s loss includes a current accident
year catastrophe loss of $113 million pre-tax, compared to $42
million in the third quarter of 2010. Additionally, the reported
quarter’s loss also includes $9 million related to favorable prior
accident year reserve development, against $34 million included in
the year-ago income.
Written premiums were $964 million, down from $1.01 billion in
the prior-year period, while combined ratio was 95.6%, excluding
catastrophes and prior-year development, as compared to 93.3% in
the year-ago period.
Wealth Management: Wealth Management
segment’s net income, including a $516 million DAC unlock charge,
was $38 million, showing a substantial decrease from $320 million
in the prior-year quarter, which included a DAC unlock benefit of
$193 million.
Corporate and Other: The Corporate and
Other segment’s net loss was $99 million, up from $76 million in
the year-ago quarter. The reported quarter's loss
includes an after-tax reserve charge of $12 million, against $40
million in the prior-year quarter.
Financial Update
Hartford's total invested assets, excluding trading securities,
were $105.4 billion on September 30, 2011, compared with $101.1
billion on September 30, 2010. Net investment income, excluding
trading securities, was $1.1 billion, pre-tax, showing a 1%
year-over-year decrease.
Net unrealized gain on investments as on September 30, 2011
improved $789 million year over year to $1.6 billion. At the end of
the reported quarter, Hartford’s assets under management were
$277.7 billion, declining 7% year over year.
Book value per share improved to $46.72 as on September 30, 2011
from $42.11 as on September 30, 2010. Excluding accumulated other
comprehensive income (AOCI), Hartford’s book value increased to
$44.54 as on September 30, 2011 from $41.72 as on September 30,
2010.
Dividend Update
On October 27, 2011, Hartford declared a quarterly dividend of
10 cents per share, payable on January 3, 2012 to shareholders of
record as on December 1, 2011. The company also declared a dividend
of $18.125 per share on the Series F Preferred Stock, payable on
January 3, 2011 to shareholders of record as on December 15,
2011.
Our Take
Hartford’s performance deteriorated in the reported
quarter, with most segments reporting net losses or declining
income. Abnormally high catastrophe losses were responsible for the
dismal show. Net investment income also declined, reflecting
poor market trends.
While the catastrophe losses cannot be controlled, the company
needs to hedge itself from market fluctuations. It also needs to
improve its operating performance, particularly in the Consumer
Markets and Corporate and Other segment.
Hartford’s competitor, American International Group
Inc. (AIG), is expected to announce third-quarter earnings
after the market closes on November 3, 2011.
Another rival MetLife Inc. (MET) reported third
quarter operating earnings per share of $1.11, surpassing the Zacks
Consensus Estimate by 3 cents.
Hartford carries a Zacks #3 Rank, which translates into a
short-term Hold rating.
AMER INTL GRP (AIG): Free Stock Analysis Report
HARTFORD FIN SV (HIG): Free Stock Analysis Report
METLIFE INC (MET): Free Stock Analysis Report
Zacks Investment Research
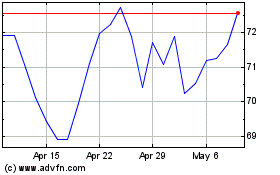
MetLife (NYSE:MET)
Historical Stock Chart
From Aug 2024 to Sep 2024

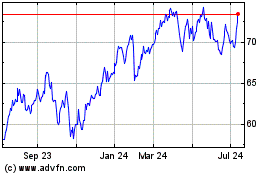
MetLife (NYSE:MET)
Historical Stock Chart
From Sep 2023 to Sep 2024
