Johnson & Johnson Down Over 4% After Seeking Drug Approval -- Data Talk
July 12 2019 - 12:52PM
Dow Jones News
Johnson & Johnson (JNJ) is currently at $134.01, down $6.10
or 4.35%
-- Would be lowest close since June 4, 2019, when it closed at
$133.73
-- On pace for largest percent decrease since Dec. 14, 2018,
when it fell 10.04%
-- Earlier Friday, The Janssen Pharmaceutical Companies of
Johnson & Johnson (JNJ) said it submitted an application with
the U.S. Food and Drug Administration seeking approval of its new
subcutaneous formulation of Darzalex, or daratumumab, for certain
patients with multiple myeloma
-- Credit Suisse initiated Johnson & Johnson at outperform
with a price target of $156.00/share, Benzinga reported
-- Currently down three consecutive days; down 5.23% over this
period
-- Worst three day stretch since the three days ending May 29,
2019, when it fell 6.05%
-- Down 3.78% month-to-date
-- Up 3.84% year-to-date
-- Down 9.54% from its all-time closing high of $148.14 on Jan.
22, 2018
-- Up 6.42% from 52 weeks ago (July 13, 2018), when it closed at
$125.93
-- Down 9.35% from its 52 week closing high of $147.84 on Dec.
13, 2018
-- Up 9.09% from its 52 week closing low of $122.84 on Dec. 24,
2018
-- Traded as low as $132.97; lowest intraday level since June 4,
2019, when it hit $132.58
-- Down 5.1% at today's intraday low; largest intraday percent
decrease since May 29, 2019, when it fell as much as 6.24%
-- Worst performer in the DJIA today
-- Second worst performer in the S&P 500 today
-- Subtracted 41.36 points from the DJIA so far today
All data as of 12:12:23 PM
Source: Dow Jones Market Data, FactSet
(END) Dow Jones Newswires
July 12, 2019 12:37 ET (16:37 GMT)
Copyright (c) 2019 Dow Jones & Company, Inc.
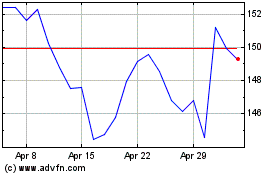
Johnson and Johnson (NYSE:JNJ)
Historical Stock Chart
From Mar 2024 to Apr 2024

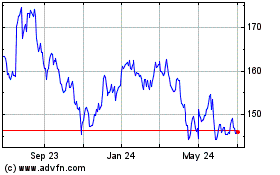
Johnson and Johnson (NYSE:JNJ)
Historical Stock Chart
From Apr 2023 to Apr 2024
