ETFs Focused on China Fall on Trade Concerns
May 06 2019 - 11:36AM
Dow Jones News
By Francesca Fontana
A number of exchange-traded funds with high exposure to China
fell sharply Monday after U.S. President Donald Trump suggested via
Twitter he could ramp up U.S. tariffs on $200 billion in Chinese
imports to 25% from the current 10%.
Among the ETFs trading lower were iShares China Large-Cap ETF
(FXI), Invesco Golden Dragon China ETF (PGJ), and First Trust
Chindia ETF (FNI).
The BlackRock-issued FXI tracks an index of the 50 largest and
most liquid Chinese stocks traded on the Hong Kong Stock Exchange,
according to ETF.com. Among its top ten holdings are Tencent
Holdings Ltd., China Construction Bank Corp., and Ping An Insurance
Company of China Ltd. FXI fell 2.9% to $43.62, according to
FactSet.
PGJ, issued by Invesco, tracks a market-cap-weighted index of
Chinese stocks and strictly holds U.S.-listed companies that derive
a majority of their revenues in China, according to ETF.com. Its
top ten holdings include Ctrip.com, NetEase Inc., and JD.com Inc.
PGJ fell 3.6% to $41.05.
FNI, issued by First Trust, tracks an index of stocks from China
and India screened by market cap and weighted in tiers, according
to ETF.com. Among its top ten holdings are JD.com Inc., Alibaba
Group Holding Ltd., and HDFC Bank Ltd. FNI fell 2.8% to $37.39.
Stock markets in the U.S., Europe and Asia slid after the
announcement, as investors became increasingly concerned about the
outcome of this week's scheduled trade talks. The Dow Jones
Industrial Average fell 0.8% to 26285, while the S&P 500 lost
0.9%. Ten of the 11 S&P 500 sectors dropped, led by declines in
materials and technology, which have heavy exposure to China.
Write to Francesca Fontana at francesca.fontana@wsj.com
(END) Dow Jones Newswires
May 06, 2019 11:21 ET (15:21 GMT)
Copyright (c) 2019 Dow Jones & Company, Inc.
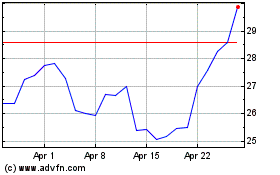
JD com (NASDAQ:JD)
Historical Stock Chart
From Mar 2024 to Apr 2024

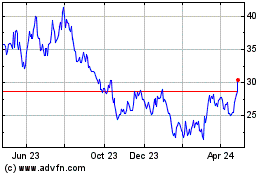
JD com (NASDAQ:JD)
Historical Stock Chart
From Apr 2023 to Apr 2024
