Intel Down Over 9% After 1Q Earnings, FY19 Forecast Cut -- Data Talk
April 26 2019 - 10:52AM
Dow Jones News
Intel Corp. (INTC) is currently at $52.16, down $5.46 or
9.47%
-- Would be lowest close since Feb. 21, 2019, when it closed at
$51.41
-- On pace for largest percent decrease since Sept. 29, 2008,
when it fell 10.05%
-- On Thursday, Intel reported that its first-quarter revenue of
$16.1 billion was roughly in line with expectations of analysts
surveyed by FactSet. Adjusted earnings of 89 cents a share were
slightly higher than forecasts of 87 cents a share
-- The company now expects earnings of $4.14 a share for
full-year 2019 on revenue of $69 billion, lower than the $4.35 a
share in profit on $71.5 billion in revenue it forecast three
months ago
-- Currently down five of the past six days
-- Currently down four consecutive days; down 11.33% over this
period
-- Longest losing streak since March 8, 2019, when it fell for
four straight trading days
-- Worst four day stretch since the four days ending Nov. 19,
2008, when it fell 13.44%
-- Down 2.88% month-to-date; on pace for worst month since
December 2018 when it fell 4.83%
-- Up 11.13% year-to-date
-- Down 30.34% from its all-time closing high of $74.88 on Aug.
31, 2000
-- Down 1.09% from 52 weeks ago (April 27, 2018), when it closed
at $52.73
-- Worst performer in the DJIA today
-- Worst performer in the S&P 500 today
-- Second most active stock in the S&P 500 today
-- Worst performer in the Nasdaq 100 today
-- Most active stock in the Nasdaq 100 today
-- Subtracted 37.02 points from the DJIA so far today
All data as of 10:05:19 AM
Source: Dow Jones Market Data, FactSet
(END) Dow Jones Newswires
April 26, 2019 10:37 ET (14:37 GMT)
Copyright (c) 2019 Dow Jones & Company, Inc.
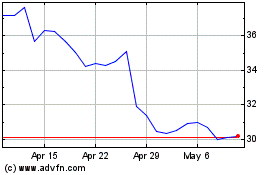
Intel (NASDAQ:INTC)
Historical Stock Chart
From Mar 2024 to Apr 2024

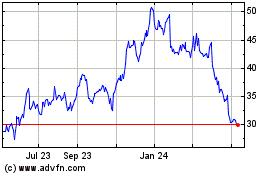
Intel (NASDAQ:INTC)
Historical Stock Chart
From Apr 2023 to Apr 2024
