PAOG Reported Overall Bullish By Stock Technical Analysis
December 18 2020 - 12:47PM
InvestorsHub NewsWire
December 18, 2020 -- InvestorsHub NewsWire --
via Stock
Technical Analysis PAOG
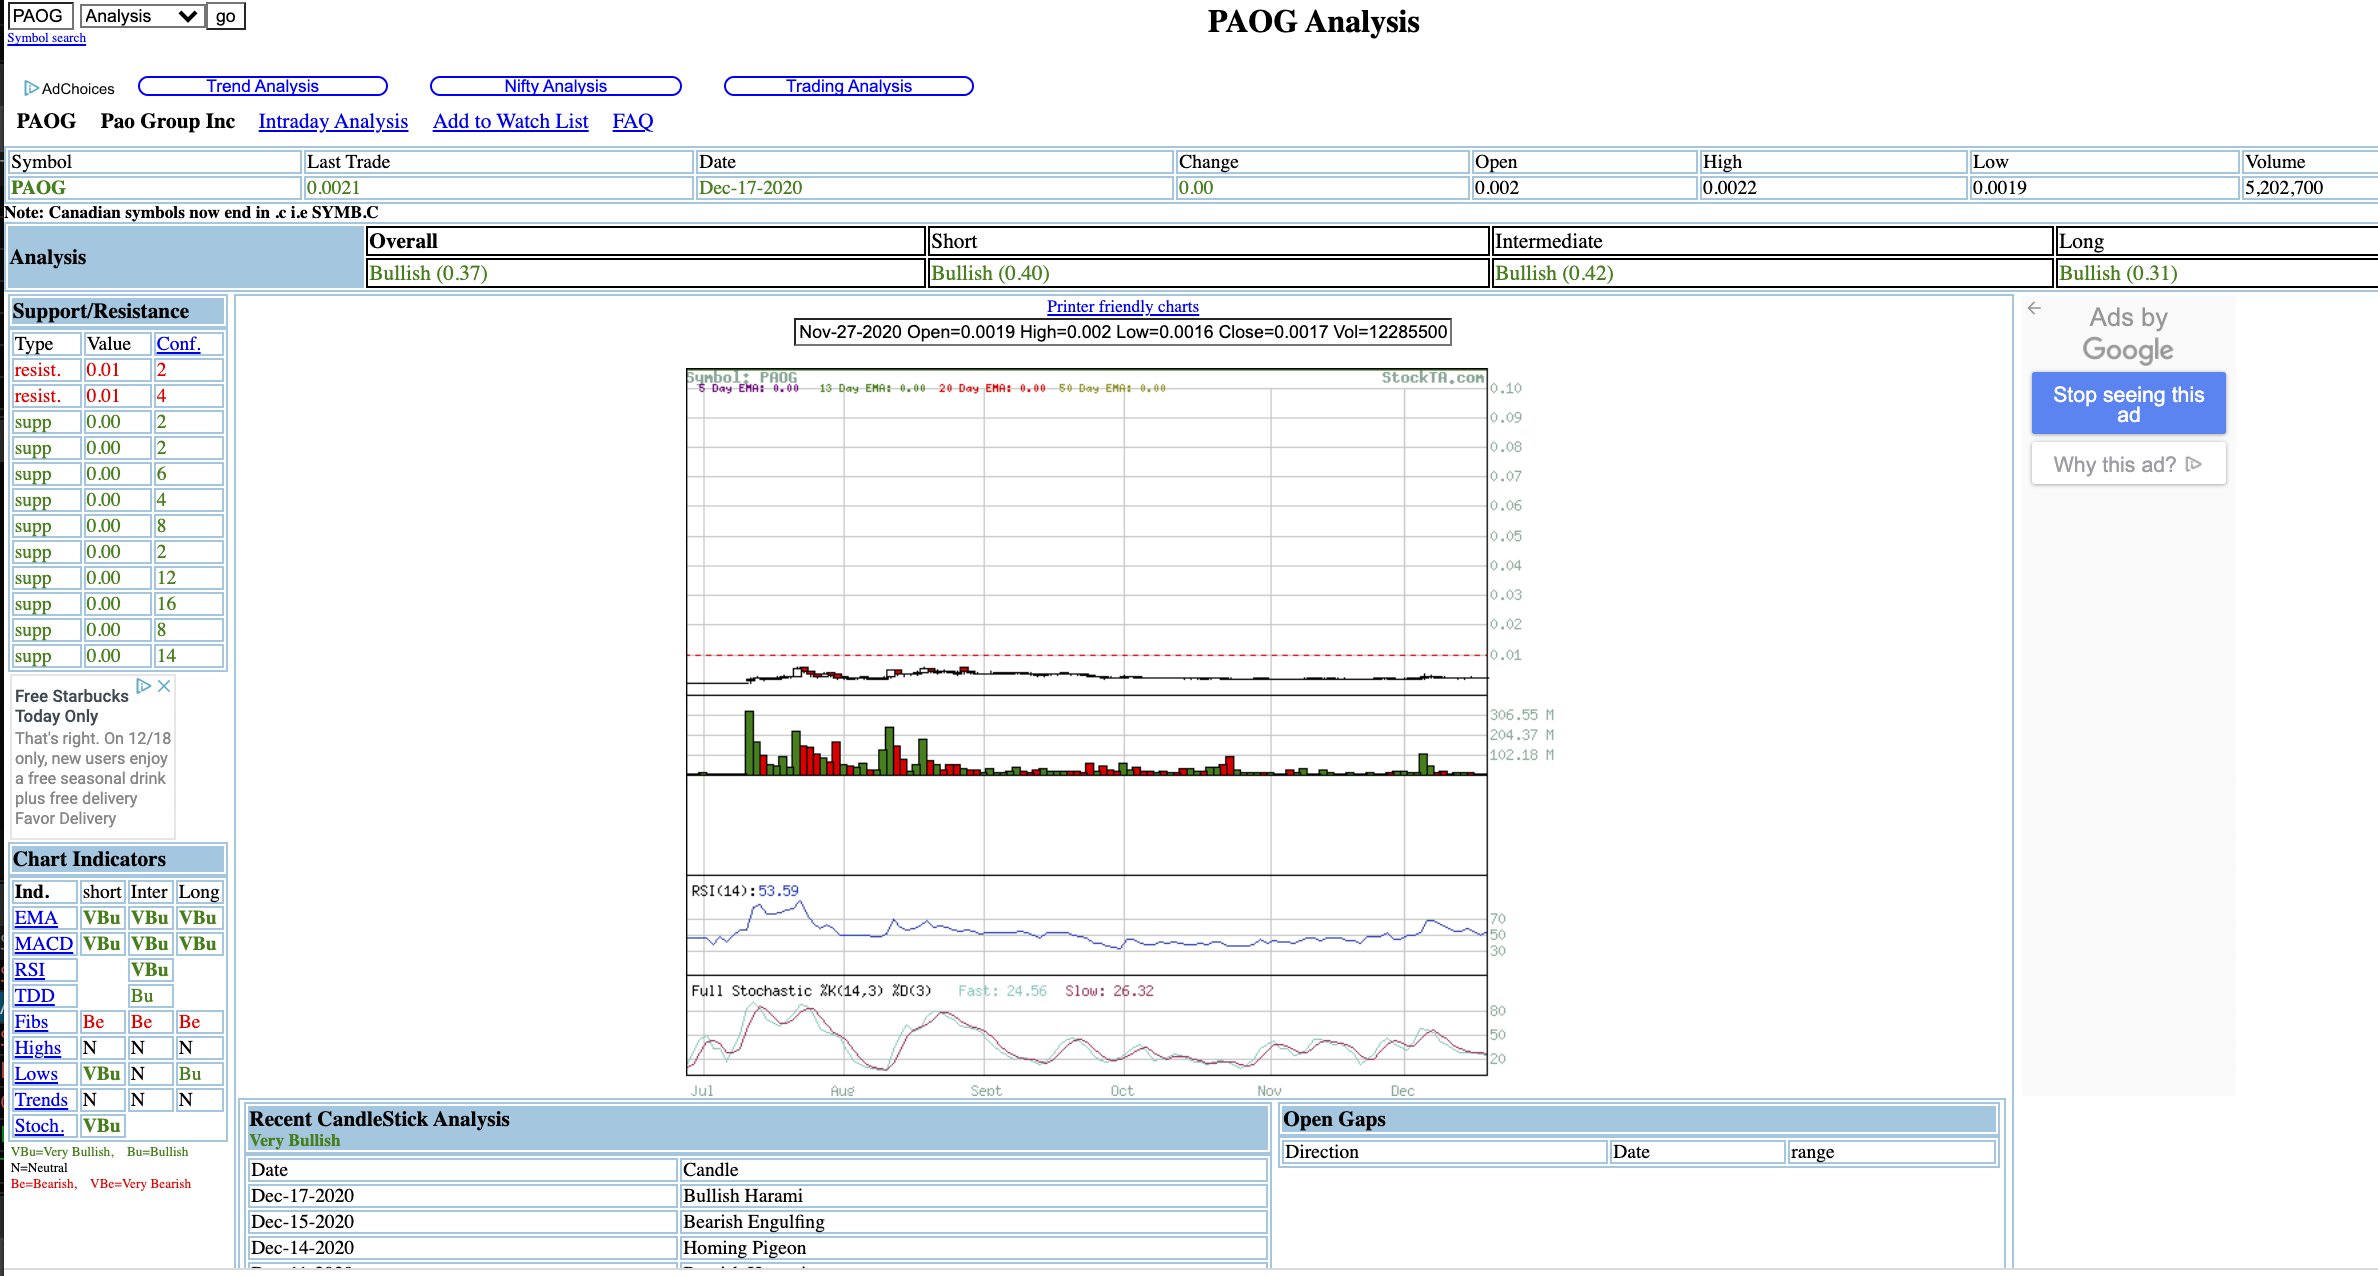
http://www.stockta.com/cgi-bin/analysis.pl?symb=PAOG&cobrand=&mode=stock
Stockcharts.com shows a 200 day moving average and 50 day moving
average breakout with a recent MACD cross.
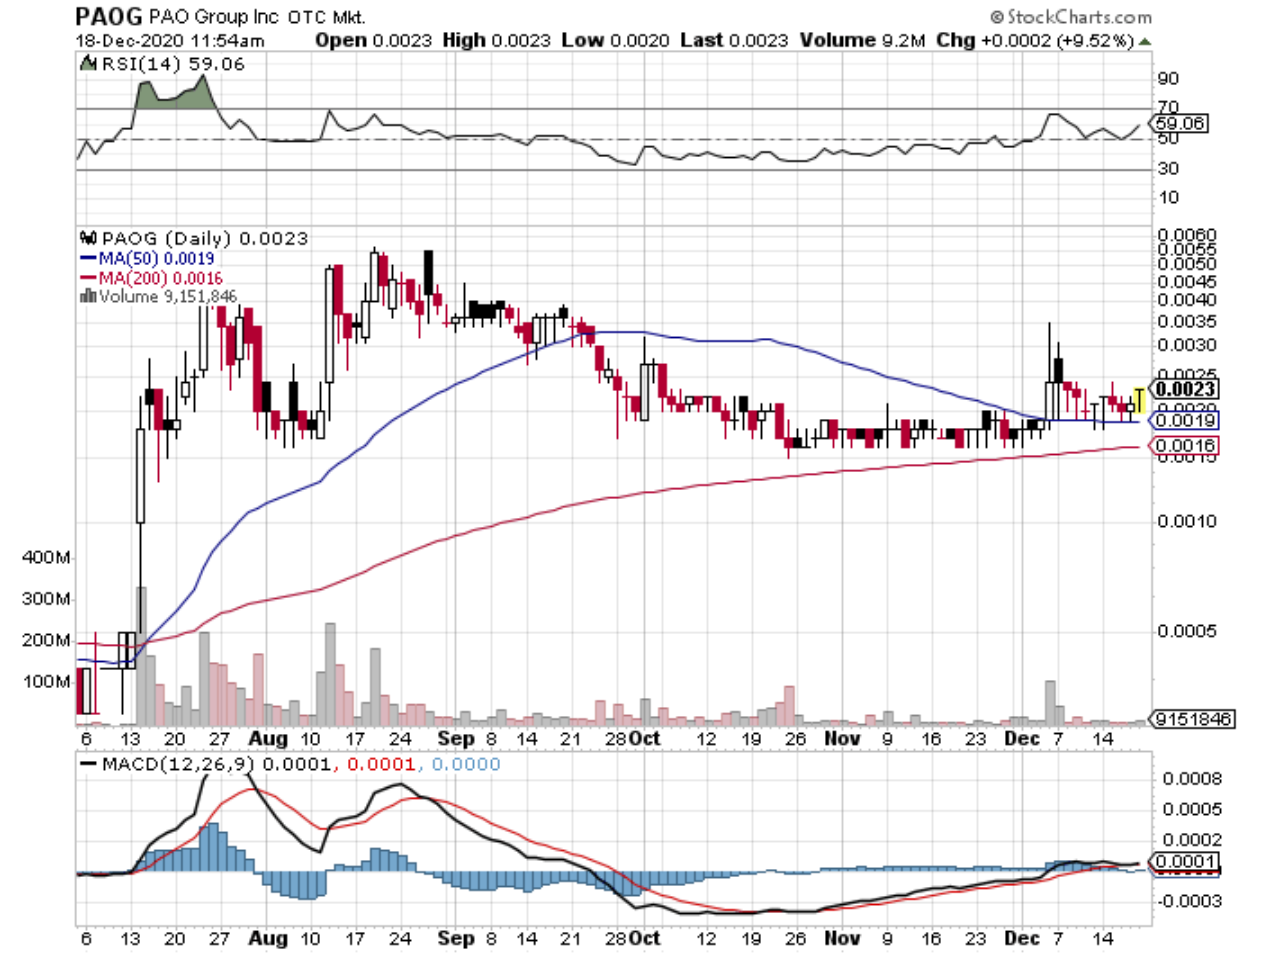
https://stockcharts.com/h-sc/ui?s=PAOG
Other stocks on the move include
GRLT,
MINE and
ARCS.
SOURCE: Stock
Technical Analysis PAOG
Minerco (CE) (USOTC:MINE)
Historical Stock Chart
From Mar 2024 to Apr 2024
 Charts.")
Minerco (CE) (USOTC:MINE)
Historical Stock Chart
From Apr 2023 to Apr 2024
 Charts.")