Gilead Sciences On Pace for Lowest Close Since October 2013 -- Data Talk
October 21 2020 - 1:07PM
Dow Jones News
Gilead Sciences, Inc. (GILD) is currently at $60.31, down $0.24
or 0.4%
-- Would be the lowest close since Oct. 9, 2013, when it closed
at $58.90; surpassing its closing low on Dec. 24, 2018, when it
closed at $60.54
-- Currently down seven consecutive days; down 6.57% over this
period
-- Late last week, the World Health Organization released
interim results from an international study of Covid treatments,
including remdesivir. To Gilead's dismay, the October 15 report
from the WHO study said that remdesivir made no clear difference in
mortality, the need for ventilators or the length of
hospitalization, Barron's reported
-- Longest losing streak since Jan. 21, 2020, when it fell for
seven straight trading days
-- Worst seven day stretch since the seven days ending Aug. 6,
2020, when it fell 6.67%
-- Down 4.56% month-to-date
-- Down 7.19% year-to-date; on pace for worst year since 2018,
when it fell 12.69%
-- Down 50.65% from its all-time closing high of $122.21 on June
23, 2015
-- Down 9.42% from 52 weeks ago (Oct. 23, 2019), when it closed
at $66.58
-- Down 28.2% from its 52 week closing high of $84.00 on April
30, 2020
-- Would be a new 52 week closing low
-- Traded as low as $59.90
-- Down 1.07% at today's intraday low
All data as of 12:28:43 PM
Source: Dow Jones Market Data, FactSet
(END) Dow Jones Newswires
October 21, 2020 12:52 ET (16:52 GMT)
Copyright (c) 2020 Dow Jones & Company, Inc.
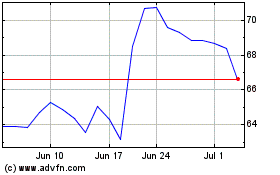
Gilead Sciences (NASDAQ:GILD)
Historical Stock Chart
From Mar 2024 to Apr 2024

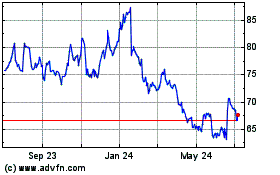
Gilead Sciences (NASDAQ:GILD)
Historical Stock Chart
From Apr 2023 to Apr 2024
