AT&T On Pace for Lowest Close In Over a Decade -- Data Talk
October 20 2020 - 12:08PM
Dow Jones News
AT&T Inc. (T) is currently at $26.74, down $0.13 or 0.5%
-- Would be lowest close since Aug. 30, 2010, when it closed at
$26.63
-- Currently down nine consecutive days; down 7.14% over this
period
-- On Monday, AT&T Inc. Chief Executive John Stankey said
the coronavirus pandemic showed that internet providers no longer
act as gatekeepers for online content, with most cable and fiber
networks performing well under the crush of Americans working and
studying remotely this year. But the CEO said tech giants like
Amazon.com Inc. and Apple Inc. should be scrutinized for their
power to restrict the kinds of apps and services allowed on their
platforms
-- Longest losing streak since Jan. 15, 2010, when it fell for
nine straight trading days
-- Worst nine day stretch since the nine days ending June 22,
2020, when it fell 7.69%
-- Down 6.19% month-to-date
-- Down 31.56% year-to-date; on pace for worst year on record
(Based on available data back to Nov. 21, 1983)
-- Down 54.81% from its all-time closing high of $59.19 on July
16, 1999
-- Down 29.93% from 52 weeks ago (Oct. 22, 2019), when it closed
at $38.17
-- Down 32.51% from its 52 week closing high of $39.63 on Nov.
18, 2019
-- Would be a new 52 week closing low
-- Traded as low as $26.73; lowest intraday level since March
23, 2020, when it hit $26.08
-- Down 0.56% at today's intraday low
-- Seventh most active stock in the S&P 500 today
All data as of 11:28:56 AM
Source: Dow Jones Market Data, FactSet
(END) Dow Jones Newswires
October 20, 2020 11:53 ET (15:53 GMT)
Copyright (c) 2020 Dow Jones & Company, Inc.
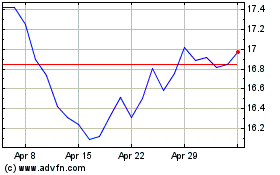
AT&T (NYSE:T)
Historical Stock Chart
From Mar 2024 to Apr 2024

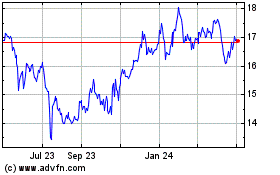
AT&T (NYSE:T)
Historical Stock Chart
From Apr 2023 to Apr 2024
