Netflix Up Over 10%, on Pace for Largest Percent Increase Since July 2017 -- Data Talk
March 19 2020 - 3:27PM
Dow Jones News
Netflix, Inc. (NFLX) is currently at $347.09, up $31.62 or
10.02%
-- Would be highest close since March 11, 2020, when it closed
at $349.92
-- On pace for largest percent increase since July 18, 2017,
when it rose 13.54%
-- Wednesday morning, J.P. Morgan internet analyst Doug Anmuth
cut estimates for most of the companies he covers in the face of
the expanding impact from the coronavirus pandemic, but he sees
benefits for online-based subscription businesses including
Netflix, Barron's reported
-- Currently up three of the past five days
-- Down 5.95% month-to-date
-- Up 7.27% year-to-date
-- Down 17.16% from its all-time closing high of $418.97 on July
9, 2018
-- Traded as high as $348.51; highest intraday level since March
11, 2020, when it hit $362.98
-- Up 10.47% at today's intraday high; largest intraday percent
increase since Jan. 23, 2018, when it rose as much as 13.24%
All data as of 2:45:06 PM
Source: Dow Jones Market Data, FactSet
(END) Dow Jones Newswires
March 19, 2020 15:12 ET (19:12 GMT)
Copyright (c) 2020 Dow Jones & Company, Inc.
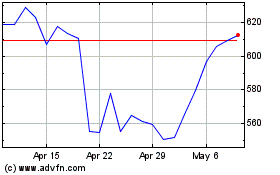
Netflix (NASDAQ:NFLX)
Historical Stock Chart
From Mar 2024 to Apr 2024

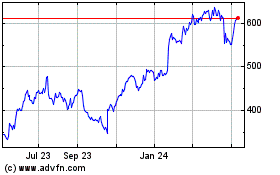
Netflix (NASDAQ:NFLX)
Historical Stock Chart
From Apr 2023 to Apr 2024
