GM On Track for Record Percent Plunge to All-Time Low -- Data Talk
March 18 2020 - 11:33AM
Dow Jones News
General Motors Company (GM) is currently at $16.65, down $3.67
or 18.06%
-- Would be new all-time low (Based on available data back to
Nov. 18, 2010)
-- Would be largest percent decrease on record (Based on
available data back to Nov. 18, 2010)
-- Earlier Wednesday, General Motors disclosed that it expects
to record total charges of $1.1 billion, primarily in the first
quarter and continuing through the end of 2020, as part of the
previously announced actions to wind down sales, design and
engineering operations in Australia and New Zealand, MarketWatch
reported
-- The company named Matt Tsien executive vice president and
chief technology officer, effective April 1
-- Currently down five of the past six days
-- Currently down three consecutive days; down 32.62% over this
period
-- Worst three day stretch on record (Based on available data
back to Nov. 18, 2010)
-- Down 45.41% month-to-date
-- Down 54.51% year-to-date
-- Down 64.18% from its all-time closing high of $46.48 on Oct.
24, 2017
-- Down 55.00% from 52 weeks ago (March 20, 2019), when it
closed at $37.00
-- Down 59.27% from its 52 week closing high of $40.88 on July
24, 2019
-- Would be a new 52 week closing low
-- Traded as low as $16.34; new all-time intraday low (Based on
available data back to Nov. 18, 2010)
-- Down 19.61% at today's intraday low; largest intraday percent
decrease on record (Based on available data back to Nov. 18,
2010)
-- 10th worst performer in the S&P 500 today
All data as of 10:53:26 AM
Source: Dow Jones Market Data, FactSet
(END) Dow Jones Newswires
March 18, 2020 11:18 ET (15:18 GMT)
Copyright (c) 2020 Dow Jones & Company, Inc.
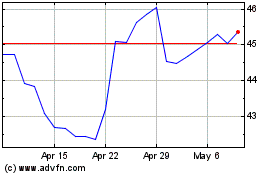
General Motors (NYSE:GM)
Historical Stock Chart
From Mar 2024 to Apr 2024

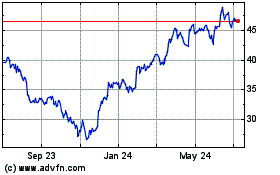
General Motors (NYSE:GM)
Historical Stock Chart
From Apr 2023 to Apr 2024
